owned this note
owned this note
Published
Linked with GitHub
# Analyze a Figure
## description
Students can use AI tools like chatGPT 4, which can interpret images, to help them understand complex figures from scientific articles. They can also ask follow-up questions about the figure, such as directing the AI to help them understand specific aspects of it.
## activity
1. For this activity, we're going to use OpenAI's GPT 4 (rather than the HUIT Sandbox, since it doesn't currently have the ability to interpret images).
2. Upload the figure from the scientific article you would like chatGPT to help you understand
3. Ask chatGPT to analyze the figure for you
4. Ask a follow-up question about one of the components of the figure (i.e., can you explain the x-axis of this chart to me in more detail)
---
## Transcript of activity example:
* USER:
* figure put into chatGPT-4
* 
```prompt: can you help me understand this figure?```
* AI:
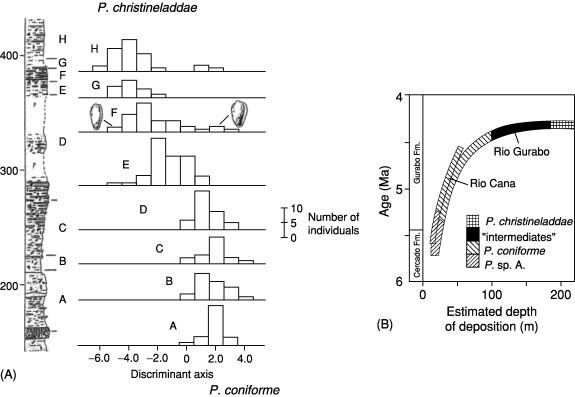
* This graphic comprises two separate panels (A and B), each presenting different types of data related to what appears to be a study on different species or variants.
* Panel A:
* Y-Axis: The Y-axis lists from A to H, which could be samples, layers, or groups in the study.
* X-Axis: This is labeled “Discriminant axis” and ranges from approximately -6.0 to 4.0. Discriminant analysis is a statistical method used to differentiate between two or more groups based on their characteristics.
* Histogram Bars: There are horizontal histograms that show the distribution of each group along the discriminant axis. It appears that each of these groups or samples has a unique distribution.
* Shells: There are images of shells placed next to some of the groups, suggesting that this study might be related to some mollusk species or shells.
* Species Labeling: On the top and bottom, two species are identified: “P. christinelladae” and “P. conforme”. The distribution suggests some differences between these species based on the discriminant analysis.
* Panel B:
* Y-Axis: It’s labeled “Age (Ma)“, which stands for millions of years ago. This axis indicates the time frame from 4 to 6 million years ago.
* X-Axis: Labeled “Estimated depth of deposition (m)“, it indicates the depth at which the samples or specimens were found, ranging from 0 to 200 meters.
* Curved Lines: These represent two locations - “Rio Gurabo” and “Rio Cana”. It appears to show the stratigraphic depth at which certain specimens or samples were found over time.
* Labels along the Curve: Four groups are identified along the curve: “P. christinelladae”, “intermediates”, “P. conforme”, and “P. sp. A”. This suggests that over the time frame from 4 to 6 million years ago, these different groups or species appeared at different depths, potentially indicating evolutionary changes or shifts in species abundance.
* Summary:
* The graphic likely presents data from a paleontological or geological study focusing on mollusk species or shells. Panel A analyzes the differences between these groups using discriminant analysis, while Panel B showcases the stratigraphic depth and age of the various species or groups found at two locations. The presence of “intermediates” might indicate a transitional form or a species that shares characteristics of the two main identified species.
### compare with:
* the figure description from the article:
* “Figure 3. Speciation through anagenesis. In this study a species of marginellid gastropod – (Prunum coniforme) – living in the Mio-Pliocene of the Dominican Republic was seen to show strong directional selection in shell morphology towards a new species –(Prunum christineladdae). (A) Histogram of individuals on the discriminant axis that best distinguishes the two species (endpoints of sampling) collected from successively higher stratigraphic levels within the section at Rio Gurabo, Dominican Republic (section thickness marked in meters at left). Notice that at level F there appears to be a mixed population which appears to have occupied 0.6–2.5% of the entire range of the ancestral species – (P. coniforme). (B) Over a longer time scale the species are distributed in sediments inferred to have been deposited in increasingly deeper water. Part of the history at Rio Gurabo is repeated at neighbouring Rio Cana. Reproduced from (Nehm RH and Geary DH (1994)) A gradual morphologic transition during a rapid speciation event in marginellid gastropods (Neogene; Dominican Republic). Journal of Paleontology 68: 787–795.”
 Sign in with Wallet


