---
tags: math615
robots: noindex, nofollow
---
# Data Architecture
By the end of this lecture students will understand that
* Data is recorded in different manners
* Spreadsheets are a common method of recording data
* Codebooks are an essential piece in learning about the data
* There is a difference between human readable and computer readable data formats
---
## Prior knowledge
:question: **What is data?**
Gunner - any meaningful information that exists or is collected/recorded. Used to understand a topic(s)
Matthew - Relevant information that is used to aid in answering a question
Meghan - The resulting information from variables that have been measured or surveyed.
Abbey - Information in different forms such as numbers that can be used to answer questions
Evan: Data is information and information is power
Jake - some amount of information that can be classified
Ryan - Recorded values
Sean- sets of information and variables which can be used to more deeply explore topics and questions
Jay - bits of information that can be collected, stored, and manipulated to tell a story
Eden - A collection of numbers and information that applies to them.
Kenji- information one obtains
Sruthi-Record values, classify, variables and better understand the data
:question: **In what manner/forms is data found?**
Gunner- letters,numbers, ordinal, categorical, numerical, discreet, continuous
Jake - Data can be categorical, ordinal, or integer, discrete or continuous
Sean-data can be measurements, observations, or forms of information
Evan: almost everything everywhere
Jay - digital storage centers, biological senses, all sorts of types
Abbey- numerical, categorical
Ryan - Discrete, continuous, categorical, numerical
Matthew - numbers, letters, observations
Meghan - numbers or categories
Kenji- numbers, samples, graphs
Eden - Graphs, tables, spreadsheets
Sruthi-data sets, categories, transcripts
:question: **How / where do you store data?**
Jay - I have it stored on every computer that I use at this time. I also store it in google drive
Kenji- Paper, hard drive, cloud
Abbey- Files on my computer, google drive
Meghan - Databases and files (.csv, .tsv, .txt) that are either locally or remotelt stored on a hard drive.
Gunner - your brain, digitally, cloud, analog
Matthew - file types, hard drive, cloud, google drive
Ryan - Specific folders on my harddrive, google drive
Evan: It's all up here (taps on head)
Jake - data can be stored in lists, spreadsheets, test, and the placement of realworld objects.
Sean - I store data on files on my hard drive, on google drive, box, dropbox
Eden - Excel, Google Drive, thumbdrive, computer hard drive, Box
Raquel - spreadsheet
Sruthi-desktop folders, drive, box
-------
:question: **What do we use data for?**
Kenji-support/refute hypotheses, further a topic, argument
Raquel - to find patterns
Evan: mostly for marketing things
Sean - To further understand a question, to agree or disagree with hypotheses, to more deeply understand differences and similarities in variables
Sruthi-Drive, Box,SPSS
Jake - Seeing the world and making descisions.
Ryan - To examine variables, their relationships, and inform questions regarding these data
Matthew - Answer questions, prove or disprove arguments
Gunner - To live life, answer questions, prove, disprove, categorize, average
Abbey - To understand something or find trends / patterns. To make visualizations.
Eden - To make charts and graphs, which show trends in the data.
# Working with data in Spreadsheets
:question: **What kind of tasks do you do in spreadsheets?**
Jake - I use spreadsheets to record data in my fieldbook
Evan: raw data entry and organization
Raquel - organize information
Kenji- Graph, plot, organize
Abbey - organize information, make plots
Jay - Math, organization of information
Meghan - Conditional formatting to look for trends, sorting, summarizing data, formatting changes...
Sean - graphing, plotting, organizing
Matthew - Organize, plot, conditional formatting, sort
Ryan - Organize data by value, category, etc.
Sruthi-Organizing, uploading and saving values for different categories
Eden - To do calculations, store data, organize data
:question: **Which tasks do you think spreadsheets are good for?**
Jake- Recording data in a easily conceptualized space.
Jay - Creating a space where one piece of information affects other bits of information and the changes are automatic based on spreadsheet
Gunner - accounting, financial data, numerical data, organizing different types of data, having nice looking columns
Abbey - organizing data and performing calculations. Graphs and plots
Meghan - It can be helpful for sorting data by a specific variable and using conditional formatting to visually look for trends in the data.
Sean- organizing and cleaning up raw data
Kenji- Plotting a graph to put in research papers
Ryan - Visualizing raw data, sorting data, a good format to pull data from for analysis
Evan: inputting data, basic calculations and organizing
Sruthi-To look up for information quickly for various categories
Matthew - Organizing data, calcutate raw data
Eden - Doing calculations, organizing data, making charts and graphs.
:question: **Spreadsheet frustrations (Pain points)** _(What have you accidentally done that made you frustrated or sad)_
Jake - Skipped a row during data entry.
Sruthi-Not saving the data and going back without saving Abbey - Graph making
Jay - I didn't store my data and lost everything when my computer turned into a brick
Gunner - boring, need lots of formatting, columns (sigh), Microsofts bane to our existence, necessary for organization
Sean - forgetting to save, not keeping organized
Kenji- Axes flipped, points off by a decimal, wrong formula
Evan - switching between Excel, Google Sheets, and Libreoffice Calc is painful
Meghan - Graphing! I find graphing in excel super
frustrating and it never does what I expect it to do. It also runs super slow with large data sets...
Ryan - Accidentally delete a whole column and go "what the heck just happened". Stare at it because I don't know what to do. Not saving.
Matthew - Calculate lots of data is time consuming
Eden - Glitches or has small errors that cause big problems.
## :books: Example - livestock data
Consider a study of agricultural practices among farmers in two countries in eastern sub-Saharan Africa (Mozambique and Tanzania). Researchers conducted interviews with farmers in these countries to collect data on household statistics (e.g. number of household members, number of meals eaten per day, availability of water), farming practices (e.g. water usage), and assets (e.g. number of farm plots, number of livestock). They also recorded the dates and locations of each interview.
If they were to keep track of the data like this:
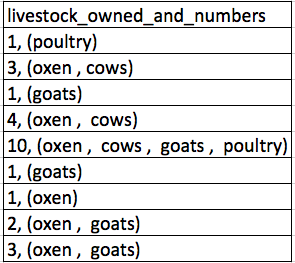
:question: **What are some of the problems with this?**
Jake - The different livestock types could be their own variables, with each cell describing the number of animals.
Sean - There are several repeated data points which are confusingly displayed. It isnt clear what the table is trying to say - i.e. do three people own "oxen and cows" and are they counted in just "oxen" or "cows" etc.. Zero organization.
Gunner - No descending order, title is confusing, no description of data, are numbers totals or individual amounts? Who knows? General confusion
Kenji- There are points where oxen overlaps with another animal, possible indication of repeated/neglected data. Not useful for analysis individual species.
Abbey - Data is not organized or displayed in a way that is easy to understand. Title does not make sense. It is difficult to understand what is being conveyed
Eden- The data does not specify one specific number for one specific type of livestock. There is too much room to misunderstand how many of what animal is there.
Ryan - Livestock appear to be collected under the same numerical value, rather than a sum. Any analysis done regarding quantities of specific livestock types won't be possible. No way to know if each line is a specific farmer, configuration of livestock, etc. I.e. are there 2 farmers that have a certain amount of oxen and goats, and 3 with a different amount of oxen and goats? Does one farmer have 2 animals and one have 3?
Meghan - The number of each type of animal cannot be summarized well since the values such as "10 (oxens, cows, goats, poultry)" do not specify how many of which animal were surveyed.
Matthew - The numbers and livestock are within the same cell. Lots of information is missing. For multiple species the total number is not separated.
Jay - Each unique bit of information should be in its own column. It is difficult to determine what information this table is trying to convey.
Evan: Multiple variables are mixed in the same column, so segregating them is necessary prior to analyzing in software. Moreover, info is lost due to recording only the total livestock and not the count of each animal.
 Sign in with Wallet
Connect another wallet
Sign in with Wallet
Connect another wallet