---
tags: sysprog
---
# [CS:APP](https://hackmd.io/c/S1vGugaDQ/) Assign5.18
contributed by <[`krimson8`](https://github.com/krimson8), [`aben20807`](https://github.com/aben20807)>
原始程式碼: [`assign_5_18`](https://github.com/aben20807/assign_5_18)
==[解說錄影](https://youtu.be/jC3jnC1dsAg)==
<style>
.red {
color: red;
}
</style>
### 取得程式並操作
```shell
$ sudo apt install linux-tools-common linux-tools-generic linux-tools-`uname -r`
$ git clone https://github.com/aben20807/assign_5_18.git
$ cd assign_5_18
$ make default
```
:::info
+ 在 `linux-tools-generic` 後面的 "uname -r" 表示 Linux 核心的版本號,這是因為 Linux 工具依賴特定的核心版本,請留意
+ 每次執行結果不同純屬正常現象,目前僅適用於 Intel 處理器,AMD 處理器可能會得到不合理數值
+ 簡單分析:`1,10: 1.557728` (spliting: 1, unrolling: 10, CPE: 1.557728)
:::
### 格式
+ <`username`>
```
程式執行結果
```
==請協助張貼你的測試結果==
+ < `jserv` >
```
Intel(R) Xeon(R) CPU E5-2650 v4 @ 2.20GHz
CPU max freq = 2900000000 hz
4,3: 1.737207
3,5: 1.757538
4,2: 1.758800
1,7: 1.781275
2,7: 1.784738
```
+ < `jserv` >
```
Intel(R) Xeon(R) CPU E5-2630 v3 @ 2.40GHz
CPU max freq = 3200000000 hz
1,5: 1.682050
2,5: 1.754485
1,8: 1.769745
1,10: 1.784482
1,6: 1.794553
```
+ <`krimson8`>
```
Intel(R) Core(TM) i5-8250U CPU @ 1.60GHz
CPU max freq = 3400000000 hz
1,10: 1.557728
1,7: 1.579318
1,9: 1.581421
1,6: 1.584928
1,8: 1.591485
```
+ <`aben20807`>
```
Intel(R) Core(TM) i7-7500U CPU @ 2.70GHz
CPU max freq = 3500000000 hz
1,5: 1.464338
1,6: 1.491294
1,4: 1.492169
1,10: 1.519267
2,3: 1.519608
```
+ <`aben20807`>
```
Intel(R) Core(TM) i5-2410M CPU @ 2.30GHz
CPU max freq = 2900000000 hz
2,5: 1.481825
2,4: 1.511792
1,8: 1.528567
1,7: 1.533028
1,9: 1.533798
```
+ <`PC-65304`>
```
Intel(R) Core(TM) i7-4770 CPU @ 3.40GHz
CPU max freq = 3900000000 hz
1,10: 1.529312
1,5: 1.533042
1,9: 1.538325
1,6: 1.539013
1,8: 1.541636
```
+ <`siahuat0727`>
```
Intel(R) Core(TM) i7-7700HQ CPU @ 2.80GHz
CPU max freq = 3800000000 hz
1,5: 1.448289
1,6: 1.470505
1,4: 1.472320
1,10: 1.484981
1,7: 1.495011
```
+ <`popo`>
```
Intel(R) Core(TM) i5-5200U CPU @ 2.20GHz
CPU max freq = 2700000000 hz
1,4: 1.525435
1,8: 1.533894
1,10: 1.535570
1,9: 1.536876
1,6: 1.547811
```
+ <`jkrvivian`>
```
Intel(R) Core(TM) i7-8700 CPU @ 3.20GHz
CPU max freq = 4600000000 hz
1,8: 5.673868
1,9: 5.735219
1,7: 5.765324
1,10: 5.877991
1,6: 5.905658
```
+ <`LuisHsu`>
```
Intel(R) Core(TM) i5-6500 CPU @ 3.20GHz
CPU max freq = 3600000000 hz
1,5: 1.465735
1,6: 1.482332
1,4: 1.488030
1,10: 1.505698
2,5: 1.514749
```
+ <`MetalheadKen`>
```
Intel(R) Core(TM) i7-8550U CPU @ 1.80GHz
CPU max freq = 4000000000 hz
1,5: 1.438794
1,4: 1.465550
1,6: 1.470298
2,5: 1.500268
1,10: 1.502166
```
+ <`Joey Wang`>
```
Intel(R) Core(TM) i7-8700 CPU @ 3.20GHz
CPU max freq = 4600000000 hz
1,5: 1.482901
1,7: 1.500007
1,6: 1.504536
1,4: 1.506638
1,8: 1.522769
```
+ <`wingard`>
```
Intel(R) Core(TM) i5-2520M CPU @ 2.50GHz
CPU max freq = 3200000000 hz
2,5: 1.735831
1,8: 1.773536
1,9: 1.777615
1,4: 1.779965
2,4: 1.781268
```
+ <`Dino Lai`>
```
Intel(R) Pentium(R) CPU 4405U @ 2.10GHz
CPU max freq = 2100000000 hz
1,5: 1.533945
1,6: 1.554499
1,4: 1.562855
1,10: 1.568273
2,5: 1.579696
```
+ <`dange0`>
```
Intel(R) Core(TM) i7-7700 CPU @ 3.60GHz
CPU max freq = 4200000000 hz
1,8: 5.304001
1,9: 5.392760
1,7: 5.409107
1,10: 5.501278
1,6: 5.525200
```
+ <`allenchen8210`>
```
Intel(R) Core(TM) i5-5250U CPU @ 1.60GHz
CPU max freq = 2700000000 hz
1,10: 2.018828
1,8: 2.053969
1,9: 2.063561
1,11: 2.073265
1,7: 2.077761
```
+ <`jerryzj`>
```
Intel(R) Core(TM) i9-9900K CPU @ 3.60GHz
CPU max freq = 5000000000 hz
1,10: 1.144024
1,9: 1.163693
1,8: 1.165456
1,7: 1.172884
2,5: 1.192368
```
+ <`tigercosmos`>
```
Intel(R) Core(TM) i5-7500 CPU @ 3.40GHz
CPU max freq = 3800000000 hz
1,10: 1.122532
1,6: 1.137390
1,9: 1.140676
1,7: 1.142612
1,8: 1.147359
```
## 先備
### CPE (Cycles Per Element)
==Page 345==
:::success
Cycles Per Element 的 element 指的是對一個單位操作平均使用的 cycles
函式整體 cycles = CPE $\times$ n + overhead
```c
void psum1(float a[], float p[], long n) {
long i;
p[0] = a[0];
for (i = 1; i < n; i++)
p[i] = p[i-1] + a[i];
}
```
更直觀的解釋:
輸入 $n$ 個元素,平均每個元素獲得的 cycles 就接近 CPE ($n$ 夠大時可省略 overhead)
:::
## CSAPP:P365 - 練習題 5.18
==Page 395== (國際版的第 609 頁)
在練習題 5.5 和 5.6 中我們考慮了多項式求值的任務,既有直接求值,也有用 Horner 方法求值。試著用我們講過的優化技術寫出這個函數更快的版本,這些技術包括循環展開、並行累積和重新組合。你會發現有很多不同的方法可以將 Horner 方法和直接求值與這些優化技術混合起來。理想狀況下,你能達到的 CPE 應該接近於你的機器的吞吐量界限。我們最佳版本在參考機上能使 CPE 達到 1.07。
## CSAPP:P365 - 練習題 5.5
==Page 365==
假設寫一個多項式求值的函數,這裡,多項式的次數為 $n$,係數為 $a_{0}$, $a_{1}$, ... , $a_{n}$。對於值 $x$,我們對多項式求值,計算
$a_{0}+a_{1}x+a_{2}x^{2}+...+a_{n}x^n$
這個求值可以用下面的函數來實作,參數包括一個係數數組 $a$、值 $x$ 和多項式的次數 `degree` (等式 (5.2) 中的值 $n$)。在這個函數的一個循環中,我們計算連續的等式的項,及連續的 $x$ 的冪:
```c=
double poly(double a[], double x, long degree)
{
long i;
double result = a[0];
double xpwr = x;
for (i = 1; i <= degree; i++) {
result += a[i] * xpwr;
xpwr = x * xpwr;
}
return result;
}
```
1. 對於次數 $n$,這段程式碼執行多少次加法和多少次乘法運算?
2. 在我們的參考機上,算術運算的延遲如圖 5-12 所示,我們測量這個函數的 CPE 等於 5.00。根據由於實作函數第 7~8 行的操作迭代之間形成的數據相關,解釋為什麼會得到這樣的 CPE。
## CSAPP:P365 - 練習題 5.6
==Page 366==
我們繼續探索練習題 5.5 中描述的多項式求值的方法。通過採用 Horner 法 (以英國數學家 [William G. Horner](https://en.wikipedia.org/wiki/William_George_Horner) (1786 - 1837) 命名) 對多項式求值,我們可減少乘法的數量。其思想是反覆提出 $x$ 的冪,得到下面的求值:
$$
a_{0}+x(a_{1}+x(a_{2}+...+x(a_{n-1}+xa_{n})...))
$$
使用 Horner 法,我們可以用下面的程式碼實作多項式求值:
```c=
/* Apply Horner's method */
double poly_5_06(double a[], double x, long degree)
{
long i;
double result = a[degree];
for (i = degree - 1; i >= 0; i--) {
result = a[i] + x * result;
}
return result;
}
```
1. 給定輸入 $n$,這段程式碼執行加法和乘法運算各多少次?
2. 在我們的參考機上,算術運算的延遲如圖 5-12 所示,測量這個函數的 CPE 等於 8.00。根據由於上述函式第 7 行的操作迭代之間形成的數據相關,解釋為什麼會得到這樣的 CPE。
3. 請解釋雖然練習題 5.5 中所示的函式需要更多的操作,但是它如何運行的更快。
## 實驗 & 測試
### 實驗流程
```flow
st=>start: 開始
e=>end: 結束
init=>operation: degree = 0
op=>operation: 測試 poly 函式
共測量 100 次,每次執行各 100 次的多項式求值
並把測量到的 100 次的 CPE
去除前後 5% 極端值後平均得出此 degree 的 CPE
cond=>condition: degree >= 1000?
add=>operation: degree += 10
st->init->op->cond
cond(no)->add
add->op
cond(yes)->e
```
### 測量 CPE (舊)
#### 獲得 cycle 數
:::info
#### PAPI
+ cycles 計算方式:時間 $\times$ 最大頻率 [[link]](http://icl.cs.utk.edu/papi/docs/d7/d7b/aix_8c.html#a277b9293ce27a63edf362e15a846f793)
```c=6216
long long
PAPI_get_real_cyc( void )
{
return ( _papi_os_vector.get_real_cycles( ) );
}
```
```c=667
{
return ( _aix_get_real_usec( ) *
( long long ) _papi_hwi_system_info.hw_info.cpu_max_mhz );
}
```
:::
+ 使用 `PAPI_get_real_cyc()`
[來源](https://icl.cs.utk.edu/projects/papi/wiki/PAPIC:PAPI_get_real_cyc.3)
```
...return the total real time passed since some arbitrary starting
point. The time is returned in clock cycles or microseconds
respectively...
```
+ Ubuntu 環境需要**安裝 `libpapi-dev`** 才能使用
```shell
$ sudo apt-get install libpapi-dev
```
#### 此方式遭遇的問題
### 測量 CPE (新)
### 統計方式
+ 主要影響因素為 degree 大小,所以 x 軸為 degree (0~100, 間隔 10)
+ 針對每個 degree 做 10000 次 poly 函式測試,並利用 `PAPI_get_real_cyc()`
+ 10000 次執行完後先去除前後 5% 的極端值,加總取平均,得圖中的一點,共 100 點 (100 個 degree)
+ 在測試程式內附加上檢測答案正確性的程式碼
### 計算方式(新)
使用獨立計算時間的方式 `CLOCK_GETTIME`,然後在固定頻率的情況下跑測試程式,則 **程式碼運行時間 × CPU 頻率 = CYCLE 數**
以最高頻率執行的方式 (利用 cpupower),來達到相對準確的 cycle 數,因此我們計算 cycle 的方式為:在執行時以最大頻率執行並利用 `clock_gettime()` 得到時間,讀取 Linux 中 `/proc` 所記錄的最大頻率,相乘及得。
### 爲何不用 RDTSC 或 PAPI 來計算 CPE?
上面提到所使用的 `PAPI` 的計算原理可見上方
至於 RDTSC 的操作原理可見 [Intel® 64 and IA-32 Architectures Software Developer’s Manual](https://software.intel.com/sites/default/files/managed/39/c5/325462-sdm-vol-1-2abcd-3abcd.pdf?fbclid=IwAR0kf-U2QSg3yBwDpgPRecrZiu8bWhoty0oL7qR-DVBuCSdhe9jE2kpDyR0) 的第 3309 頁的 17-17 章節
> Processor families increment the time-stamp counter differently:
> 1. ...the time-stamp counter increments with every internal processor clock cycle.
The internal processor clock cycle is determined by the current core-clock to bus-clock ratio.
> 2. ... the time-stamp counter increments at a constant rate. That rate may be set by the
maximum core-clock to bus-clock ratio of the processor or may be set by the maximum resolved frequency at
which the processor is booted. The maximum resolved frequency may differ from the processor base
frequency, ...
簡單來說,在 `Pentium 4` 之前的處理器,`TSC` 暫存器裡面的內容是會根據每個 cycle 來進行 increment 的,但 `Pentium 4` 之後的處理器因多核的原因而改成使用 constant rate,而且這個 constant rate 會依頻率而浮動,因此出現下圖的狀況

<!--  -->
比方說,在筆電 intel U 系列處理器上,往往有着較低的基底 (base) 頻率,和很高的加速 (burst) 頻率,這樣設計的目的是當計算需求低的時候可以使用低頻率,然後當處理器探測到需要高計算力時便開始增加頻率,於是便出現上圖的穩定增加 cycle ,然後 cycle 開始快速降落,再來繼續穩定提升
因此爲了穩定的計算準確的 CPE,我們設計如下 **實驗環境與條件**
### 硬體實驗環境
首先附上硬體環境,其中請注意 `model name` 項目,此**處理器的基底頻率爲 1.60 GHz**
```
Architecture: x86_64
CPU op-mode(s): 32-bit, 64-bit
Byte Order: Little Endian
Address sizes: 39 bits physical, 48 bits virtual
CPU(s): 8
On-line CPU(s) list: 0-7
Thread(s) per core: 2
Core(s) per socket: 4
Socket(s): 1
NUMA node(s): 1
Vendor ID: GenuineIntel
CPU family: 6
Model: 142
Model name: Intel(R) Core(TM) i5-8250U CPU @ 1.60GHz
Stepping: 10
CPU MHz: 1400.093
CPU max MHz: 1801.0000
CPU min MHz: 400.0000
BogoMIPS: 3601.00
Virtualization: VT-x
L1d cache: 32K
L1i cache: 32K
L2 cache: 256K
L3 cache: 6144K
NUMA node0 CPU(s): 0-7
```
### 軟體實驗環境
在執行上述程式碼的時候,使用二個 CPU affinity 相關工具來達到最佳效果
* [taskset](https://linux.die.net/man/1/taskset)
* [nice](https://linux.die.net/man/1/nice)
具體實作方式如下(需要 root 權限)
```shell
$ sudo taskset -c 0 nice --adjustment=-20 ./(your app)
```
`-c 0` 的意思是讓程式只能在 **cpu 0 上面運作,不會切換到其他CPU 核**
接下來,我們需要完成避免對 `TSC` 的依賴
具體做法: **鎖定CPU 頻率 $\to$ 使用別的時間計算方式 $\to$ 時間 $\times$ 頻率 得到 CYCLE**
**鎖定 CPU 頻率**
:::danger
需要更改系統設定與開機變數,有一定風險,請務必在嘗試前備份資料
:::
首先使用的工具是 [cpupower](https://linux.die.net/man/1/cpupower),接下來的 **所有operation 都需要使用 root 權限**
```bash
$ sudo apt install linux-tools-4.15.0-39-generic
```
* **第一步,確認 CPU driver**
```bash
$ cpupower frequency-info | grep driver
```
可以不用 `grep`,輸出結果如下
```bash
driver: intel_pstate
```
可以看到結果是 `intel_pstate`,關於這個裝置驅動程式的詳細描述可以看 [這裏](https://www.kernel.org/doc/html/v4.12/admin-guide/pm/intel_pstate.html),其中重點是
> There are two P-state selection algorithms provided by intel_pstate in the active mode: powersave and performance. The way they both operate depends on whether or not the hardware-managed P-states (HWP) feature has been enabled in the processor and possibly on the processor model.
上述內容敘述的是 `intel_pstate` 這個裝置驅動程式僅有兩種 governor:`performance` 和 `powersave`。governor 的意思可以理解成 profile,意思說不同 profile 有着不同的效能設定,而最重要的是 **我們並無法去對這兩個 governor 進行調整與設定**
* **第二步,更換 CPU driver**
有兩種方法,分別是 temporary 和 permanent 的方法
* **暫時性**
* 開機的進入 grub 畫面的時候,選擇 Advanced boot options for XXX
* 選擇想要 boot 的 linux 核心版本,按 `e`
* 尋找開頭是 `linux` 的命令,在末端(引號內)加入如下字串
```
intel_pstate=disable
```
範例:
```
linux ... = "quiet splash intel_pstate=disable"
```
* 修改完畢按 ctrl + x 開機
* **永久性修改(永久性指非單次開機)**
* 修改以下這個文件 (需 root)
```bash
$ gedit /etc/default/grub
```
的這一行,同樣是加入 disable intel_pstate 的功能
```
GRUB_CMDLINE_LINUX_DEFAULT="quiet splash intel_pstate=disable"
```
* 執行下列命令
```shell
$ update-grub
```
* 往後要恢復原本的裝置驅動程式時,就先吧 `intel_pstate=disable` 字串拿掉,再執行 `update-grub` 即可
更換完畢並且從新開機後,`cpupower frequency-info | grep driver` 的輸出變爲
```
driver: acpi-cpufreq
```
也可以使用 `cat /proc/cmdline` 來查看 boot 參數
* **第三步,切換 governor**
執行 `cpupower -c 0 frequency-info` 可得到如下結果(-c 0 爲指定觀察 cpu 0)
```
analyzing CPU 0:
driver: acpi-cpufreq
CPUs which run at the same hardware frequency: 0
CPUs which need to have their frequency coordinated by software: 0
maximum transition latency: 10.0 us
hardware limits: 400 MHz - 1.80 GHz
available frequency steps: 1.80 GHz, 1.80 GHz, 1.70 GHz, 1.60 GHz, 1.50 GHz, 1.40 GHz, 1.30 GHz, 1.20 GHz, 1.10 GHz, 1000 MHz, 900 MHz, 800 MHz, 700 MHz, 600 MHz, 500 MHz, 400 MHz
available cpufreq governors: userspace performance schedutil
current policy: frequency should be within 400 MHz and 1.80 GHz.
The governor "userspace" may decide which speed to use
within this range.
current CPU frequency: Unable to call hardware
current CPU frequency: 1.40 GHz (asserted by call to kernel)
boost state support:
Supported: yes
Active: yes
```
我們可以看到 `available cpufreq governors` 那一欄出現跟之前不同的選項,而我們允許更改的是 `userspace` governor 選項,若此選項沒有出現請執行下列指令
```shell
$ modprobe cpufreq_userspace
```
之後更換使用的 governor
```shell
$ cpupower frequency-set -g userspace
```
* 第四步,更改 CPU 的頻率
:::warning
目前測試錯誤
* 若設定低於 base 頻率,則頻率都能維持穩定,若高於base 則不穩定,尚待理清原因
* ubuntu 環境下有問題,無法設定頻率,不知道是作業系統的問題還是 8 代處理器(Coffee Lake)的問題,需要繼續測試
:::
執行如下命令
```shell
$ cpupower frequency-set -f 1500MHz
```
可用 GHz 或 kHz,注意**所設訂的頻率還需要符合 `available frequency steps` 內的頻率不能胡亂設定**
設定好後可以用下列的命令觀察 CPU 頻率
```shell
$ grep MHz /proc/cpuinfo 0 < 17:10:44
cpu MHz : 1400.082
cpu MHz : 1400.100
cpu MHz : 1400.009
cpu MHz : 1400.000
cpu MHz : 1400.026
cpu MHz : 1400.123
cpu MHz : 1400.026
cpu MHz : 1400.002
$ cpupower -c all frequency-info | grep -P "analyzing|current CPU frequency"
analyzing CPU 0:
current CPU frequency: Unable to call hardware
current CPU frequency: 1.40 GHz (asserted by call to kernel)
analyzing CPU 1:
current CPU frequency: Unable to call hardware
current CPU frequency: 1.40 GHz (asserted by call to kernel)
analyzing CPU 2:
current CPU frequency: Unable to call hardware
current CPU frequency: 1.40 GHz (asserted by call to kernel)
analyzing CPU 3:
current CPU frequency: Unable to call hardware
current CPU frequency: 1.40 GHz (asserted by call to kernel)
analyzing CPU 4:
current CPU frequency: Unable to call hardware
current CPU frequency: 1.40 GHz (asserted by call to kernel)
analyzing CPU 5:
current CPU frequency: Unable to call hardware
current CPU frequency: 1.40 GHz (asserted by call to kernel)
analyzing CPU 6:
current CPU frequency: Unable to call hardware
current CPU frequency: 1.40 GHz (asserted by call to kernel)
analyzing CPU 7:
current CPU frequency: Unable to call hardware
current CPU frequency: 1.40 GHz (asserted by call to kernel)
```
* 第五步 執行結果

### 使用 dlopen 動態鏈接
[man dlopen](https://linux.die.net/man/3/dlopen)
:::danger
經實驗,動態鏈接 .o 檔執行程式會有顯著的效能負面影響,繼續研究中
:::
因爲不同數量的 unrolling 和 splitting 的程式碼長得是非常類似,因此我們討論過後撰寫了以下這個程式執行流程,希望大家可以來幫助我們執行程式收集實驗數據
* 首先執行主程式 (`test_poly`)
* 程式去判斷所要執行的函式類型(總共 8 個 unroll × 8 個 splitting = 64 個),也可能是執行完全部 64 個函式
* 因爲考量到程式碼佔用空間,因此使用 dlopen 和動態產生程式碼的部分,主程式內的函式會根據命令列參數生成相應的 .c 檔
* 用 `system()` 另建立一個行程呼叫 gcc ,再用 `dlopen()` 把已編譯的 `.o` 檔動態鏈結,主程式就能使用
* 執行過程 CPE 比原本的硬生生多了三倍左右
### 其他
#### cache 影響
發現有沒有清空 cache (每次迴圈) 並==不影響==,但清空 cache 需要花更多時間執行整個程式,因此排除 cache 影響
+ 清空方式:(需使用 `sudo ./test_poly`)
```c
FILE *fp = fopen("/proc/sys/vm/drop_caches", "w");
if (fp != NULL) {
fprintf(fp, "3");
fclose(fp);
}
```
或者直接
```shell
$ free -m && echo --------- && sudo sh -c 'echo 3 >/proc/sys/vm/drop_caches' && free -m
```
兩次 `free` 命令來觀察釋放的記憶體
附上清除記憶體前與清除後的結果對比圖:
- [ ] 清除前

- [ ] 清除後

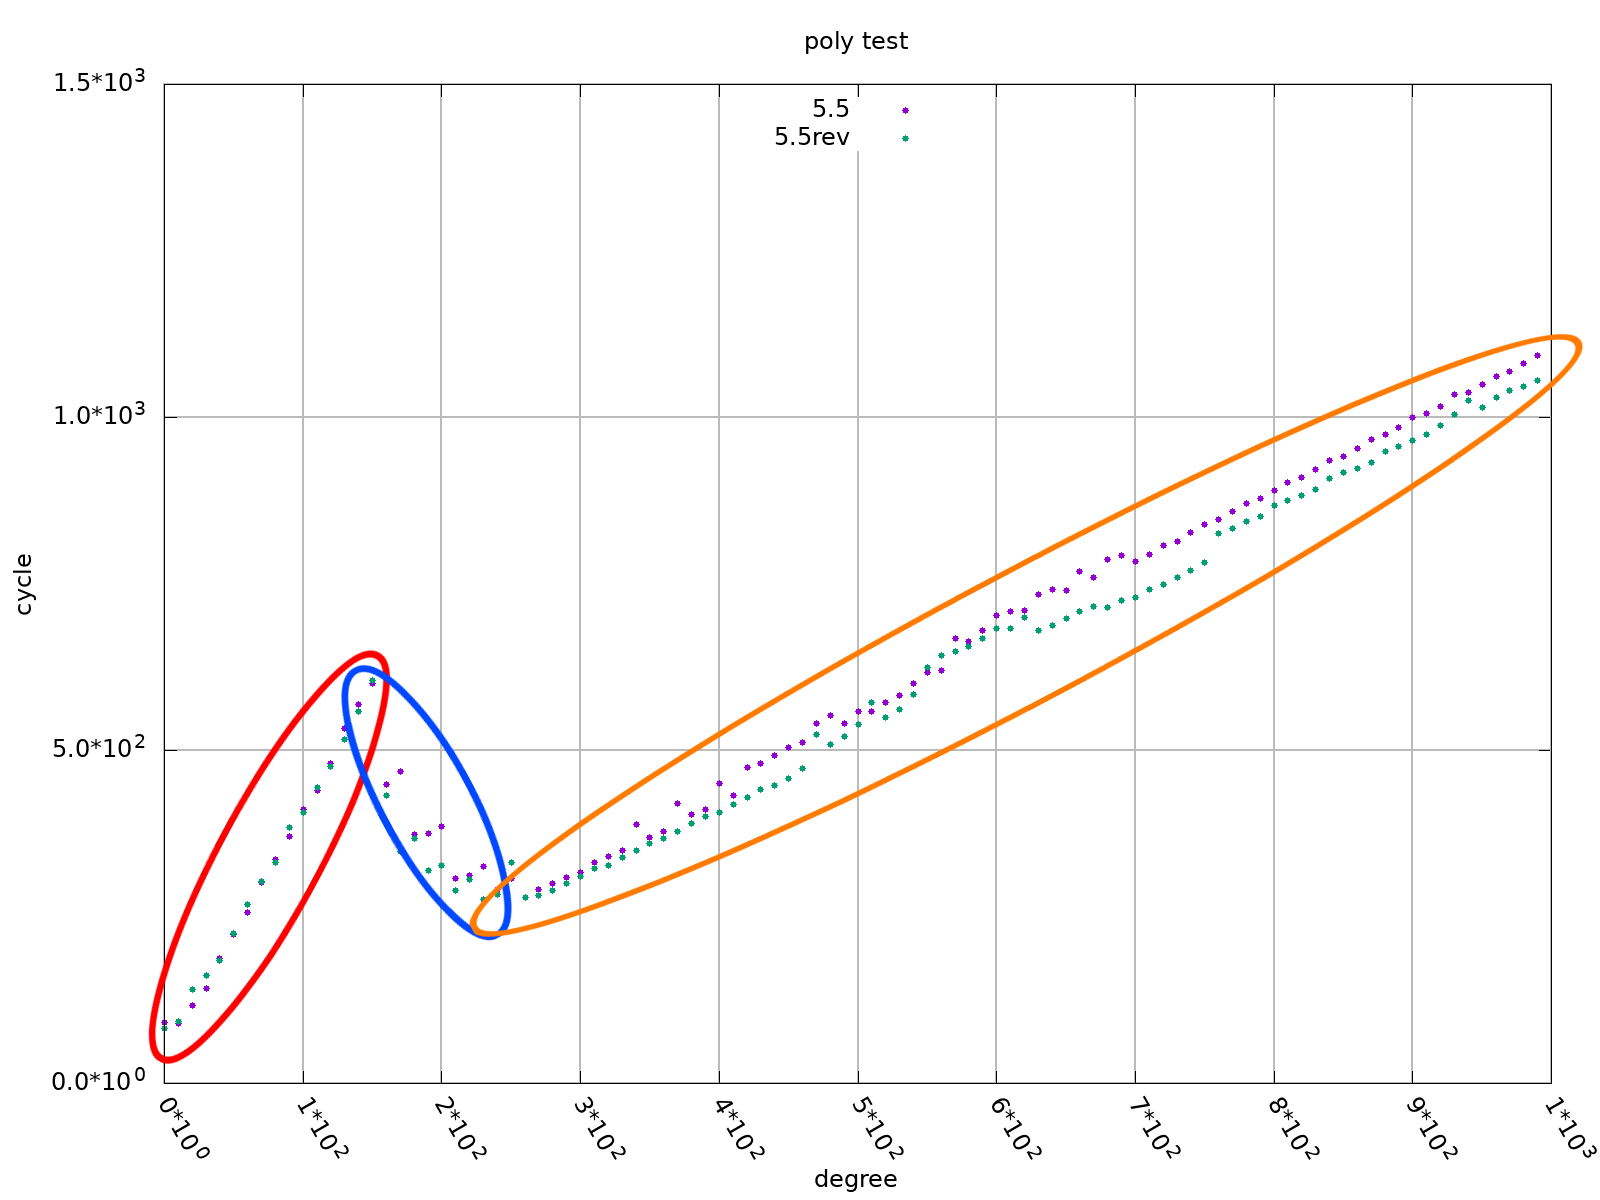
### `5.5` vs. `5.6`

## 程式碼最佳化
CS:APP 5.18 的作業要求是將 `5.5` 和 `5.6` 節計算一元多次方程式的程式碼進行最佳化,將分別原本是 CPE 5(5.5)和 CPE 8(5.6)的程式碼極限最佳化,課本給出的參考 CPE 是 1.07 左右,而課本所使用的爲 [第四代 intel core i7](https://ark.intel.com/products/75122/Intel-Core-i7-4770-Processor-8M-Cache-up-to-3-90-GHz-)

### 命名
接下來因為函式命名關係,我們統一和 CSAPP `5.5` 的比較 CPE (圖片斜率) 並將其命名為 (1, 1):一個 splitting, 一個 unrolling,其程式碼因為**自動產生**的原因所以變成以下的型式,但是經過測試因為 overhead 較小所以幾乎不影響與最上方 `5.5` 的結果。
```c
double poly_0(double a[], double x, long degree)
{ //(1, 1)
long i;
double result_0 = a[0];
double xpwr = x;
double x_pow_0 = 1;
double x_pow_1 = x;
for (i = 1; i <= degree - 0; i += 1) {
result_0 += (a[i + 0] * x_pow_0) * xpwr;
xpwr = xpwr * x_pow_1;
}
for (; i <= degree; i++) {
result_0 += a[i] * xpwr;
xpwr = xpwr * x;
}
return result_0;
}
```
首先我們嘗試 **Loop Splitting** 的最佳化,做法可參閱課程共筆 [CS:APP 第 5 章重點提示和練習](https://hackmd.io/@sysprog/CSAPP-ch5)。
程式碼的部分嘗試 split 成 2 個到 8 個變數分別進行計算,最後再相加。
以下程式碼分成 4 個變數
```c
double poly_36(double a[], double x, long degree)
{ //(4, 1)
long i;
double result_0 = a[0];
double result_1 = 0;
double result_2 = 0;
double result_3 = 0;
double xpwr = x;
double x_pow_0 = 1;
double x_pow_1 = x;
double x_pow_2 = x_pow_1 * x;
double x_pow_3 = x_pow_2 * x;
double x_pow_4 = x_pow_3 * x;
for (i = 1; i <= degree - 3; i += 4) {
result_0 += (a[i + 0] * x_pow_0) * xpwr;
result_1 += (a[i + 1] * x_pow_1) * xpwr;
result_2 += (a[i + 2] * x_pow_2) * xpwr;
result_3 += (a[i + 3] * x_pow_3) * xpwr;
xpwr = xpwr * x_pow_4;
}
for (; i <= degree; i++) {
result_0 += a[i] * xpwr;
xpwr = xpwr * x;
}
return result_0 + result_1 + result_2 + result_3;
}
```
此段程式碼相比原本 (1, 1) 的 cycle 數少 2 倍多:

接下來嘗試的是 **Loop Unrolling**,根據共筆的提示,將 array 的 load 以三次爲單位作爲一整個 operation,詳見下方程式碼
```c
double poly_2(double a[], double x, long degree)
{ //(1, 3)
long i;
double result_0 = a[0];
double xpwr = x;
double x_pow_0 = 1;
double x_pow_1 = x;
double x_pow_2 = x_pow_1 * x;
double x_pow_3 = x_pow_2 * x;
for (i = 1; i <= degree - 2; i += 3) {
result_0 += (a[i + 0] * x_pow_0 + a[i + 1] * x_pow_1 + a[i + 2] * x_pow_2) * xpwr;
xpwr = xpwr * x_pow_3;
}
for (; i <= degree; i++) {
result_0 += a[i] * xpwr;
xpwr = xpwr * x;
}
return result_0;
}
```
這樣的做法其實就是 `5.6` 節提到的 **horner method** 的變形
其結果比純粹使用 4 個 splitting 還快:

再根據上方的程式碼,嘗試進行 **Loop Splitting**,即結合兩種方法,以下程式碼實作 2 個 splitting 同時 3 個 unrolling
這個型式也是網際網路上常見的解答
```c
double poly_14(double a[], double x, long degree)
{ //(2, 3)
long i;
double result_0 = a[0];
double result_1 = 0;
double xpwr = x;
double x_pow_0 = 1;
double x_pow_1 = x;
double x_pow_2 = x_pow_1 * x;
double x_pow_3 = x_pow_2 * x;
double x_pow_4 = x_pow_3 * x;
double x_pow_5 = x_pow_4 * x;
double x_pow_6 = x_pow_5 * x;
for (i = 1; i <= degree - 5; i += 6) {
result_0 += (a[i + 0] * x_pow_0 + a[i + 1] * x_pow_1 + a[i + 2] * x_pow_2) * xpwr;
result_1 += (a[i + 3] * x_pow_3 + a[i + 4] * x_pow_4 + a[i + 5] * x_pow_5) * xpwr;
xpwr = xpwr * x_pow_6;
}
for (; i <= degree; i++) {
result_0 += a[i] * xpwr;
xpwr = xpwr * x;
}
return result_0 + result_1;
}
```
比較如下圖:
可以看出 (2, 3) 的 CPE 已經相當接近 1

## 分析
+ 改進方式有兩個方向:
+ 一行之內載入多個陣列元素
+ 迴圈內展開多行
+ 由於發現一直去更改函式內容再測試及繪圖相當耗費時間,所以使用自動生成程式碼去測試,發現:
+ 網路上提供的解答不是最快的
+ 最快的型式並不一定都是同一個
+ 以我 (`aben20807`) 為例
+ 大部份最快的是 (1, 10):也就是指使用 unrolling 而不使用 splitting,甚至前五名所用的方法都是靠大量的 unrolling,但是如果畫成圖片可以發現都相當接近
## 問題與困難
1. Intel 官方可公開資訊目前只到 Skylake。Kaby Lake、Kaby Lake Refresh 沒有公開架構
2. [已解決] 在測較小的測資時 CPU 頻率未達最高,導致執行時間久,但是計算 cycle 的方式又是 `時間 x 最高頻率`,所以有很大的誤差,目前以接上電源解決,如下圖:

3. 目前在同一行載入越多可以越快,展開越多行也是,都會有微小的進步,但似乎沒有極限,找不到會變慢的時候,因此可以一直更快?如上圖,紫色:(3, 2), 綠色:(4, 2)
```c
for (i = 1; i <= degree - 7; i += 8) {
result_0 += (a[i] +
a[i + 1] * x +
a[i + 2] * x_pow_2 +
a[i + 3] * x_pow_3
) * xpwr;
result_1 += (a[i + 4] * x_pow_4 +
a[i + 5] * x_pow_5 +
a[i + 6] * x_pow_6 +
a[i + 7] * x_pow_7
) * xpwr;
xpwr = xpwr * x_pow_8;
}
```
## 延伸閱讀
* [Architectures Optimization Manual](https://software.intel.com/sites/default/files/managed/9e/bc/64-ia-32-architectures-optimization-manual.pdf)
* [Store forwarding Address vs Data: What the difference between STD and STA in the Intel Optimization guide?](https://stackoverflow.com/questions/47701898/store-forwarding-address-vs-data-what-the-difference-between-std-and-sta-in-the)
* [一個 CPU 核包含幾個加法器?](https://www.zhihu.com/question/64149034)
* [What does "cpu MHz" field mean in the `/proc/cpuinfo` of a hyper-threading cpu?](https://unix.stackexchange.com/a/295356)