owned this note
owned this note
Published
Linked with GitHub
# Sandbox versus GPT-4: Problem Sets in R
prompt used: "a diagram of statistical analysis using R"
## description
GPT-4, which is one of the tools available through the Harvard AI Sandbox, can perform data analysis, including in R. You can use AI to generate practice problems that help students learn how to use R for data analysis. Students can also ask GPT to help them understand the steps they'd need to take to complete these problem sets in R.
## activity
1. Log into chatGPT using the Harvard AI Sandbox

3. Log into chat-GPT directly through OpenAI in another window.
4. Before entering your prompt, remember:
* If you only hit Enter or Return, this will automatically submit your prompt.
* You can also add three ticks (''') to indicate a paragraph break if you prefer
5. In the Sandbox window, ask the following sequence of questions.
* Can you give me some practice problems to help me get better using R for data analysis?
* Can you suggest some problems using the built-in data sets?
* Can you walk me through the steps for one of the suggested problems that involves a time series?
* Note: The Sandbox will not be able to show you the output for each step due to its lack of the data analytics plugin.
* but one possible use-case here is to use the Sandbox almost as a tutor bot that will *not* give students the answer (since it can't!)
6. In the GPT-4 window, ask the same sequence of questions.
7. For further analysis, stay in the GPT-4 window. Ask it to:
* Walk you through the steps for one of the suggested problems that involves a time series.
* Note: GPT-4 can do this well because it has the data analytics plugin that the sandbox lacks
By comparing the responses from both tools, you'll be able to see the difference in capabilities.
---
## TRANSCRIPT OF ACTIVITY EXAMPLE:
### GPT 4
1. Can you give me some practice problems to help me get better using R for data analysis?
2. Can you suggest some problems using the built-in data sets?
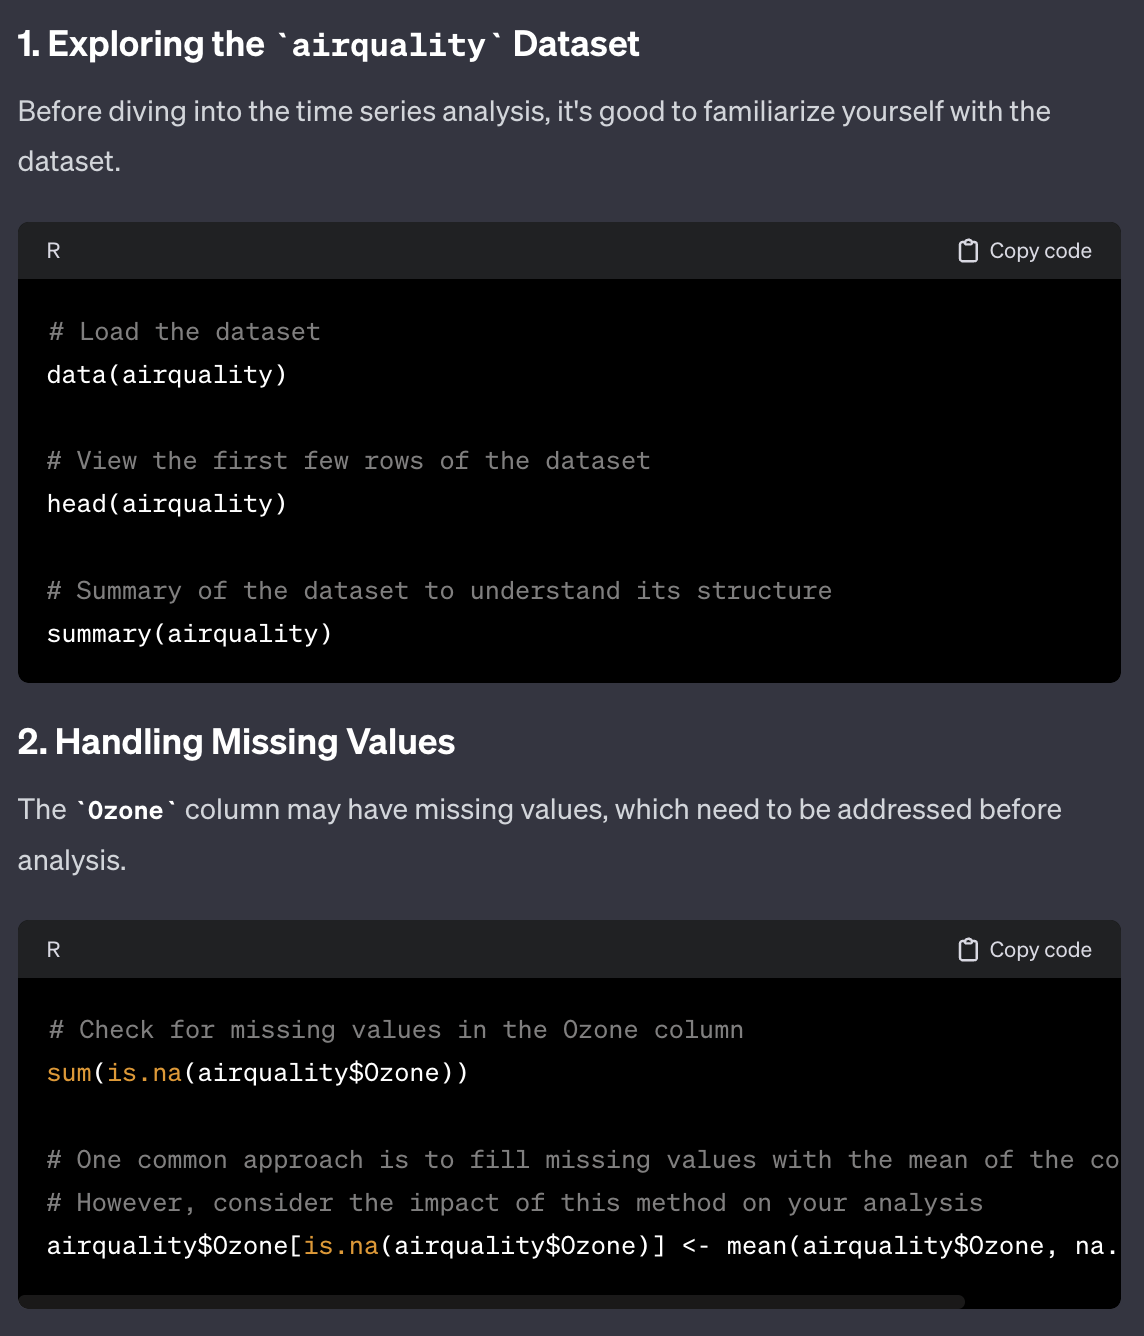
3. Can you walk me through the steps for the 'airquality' dataset?
4. Can you show me the output for each step so I can follow along?
### Sandbox
* USER:
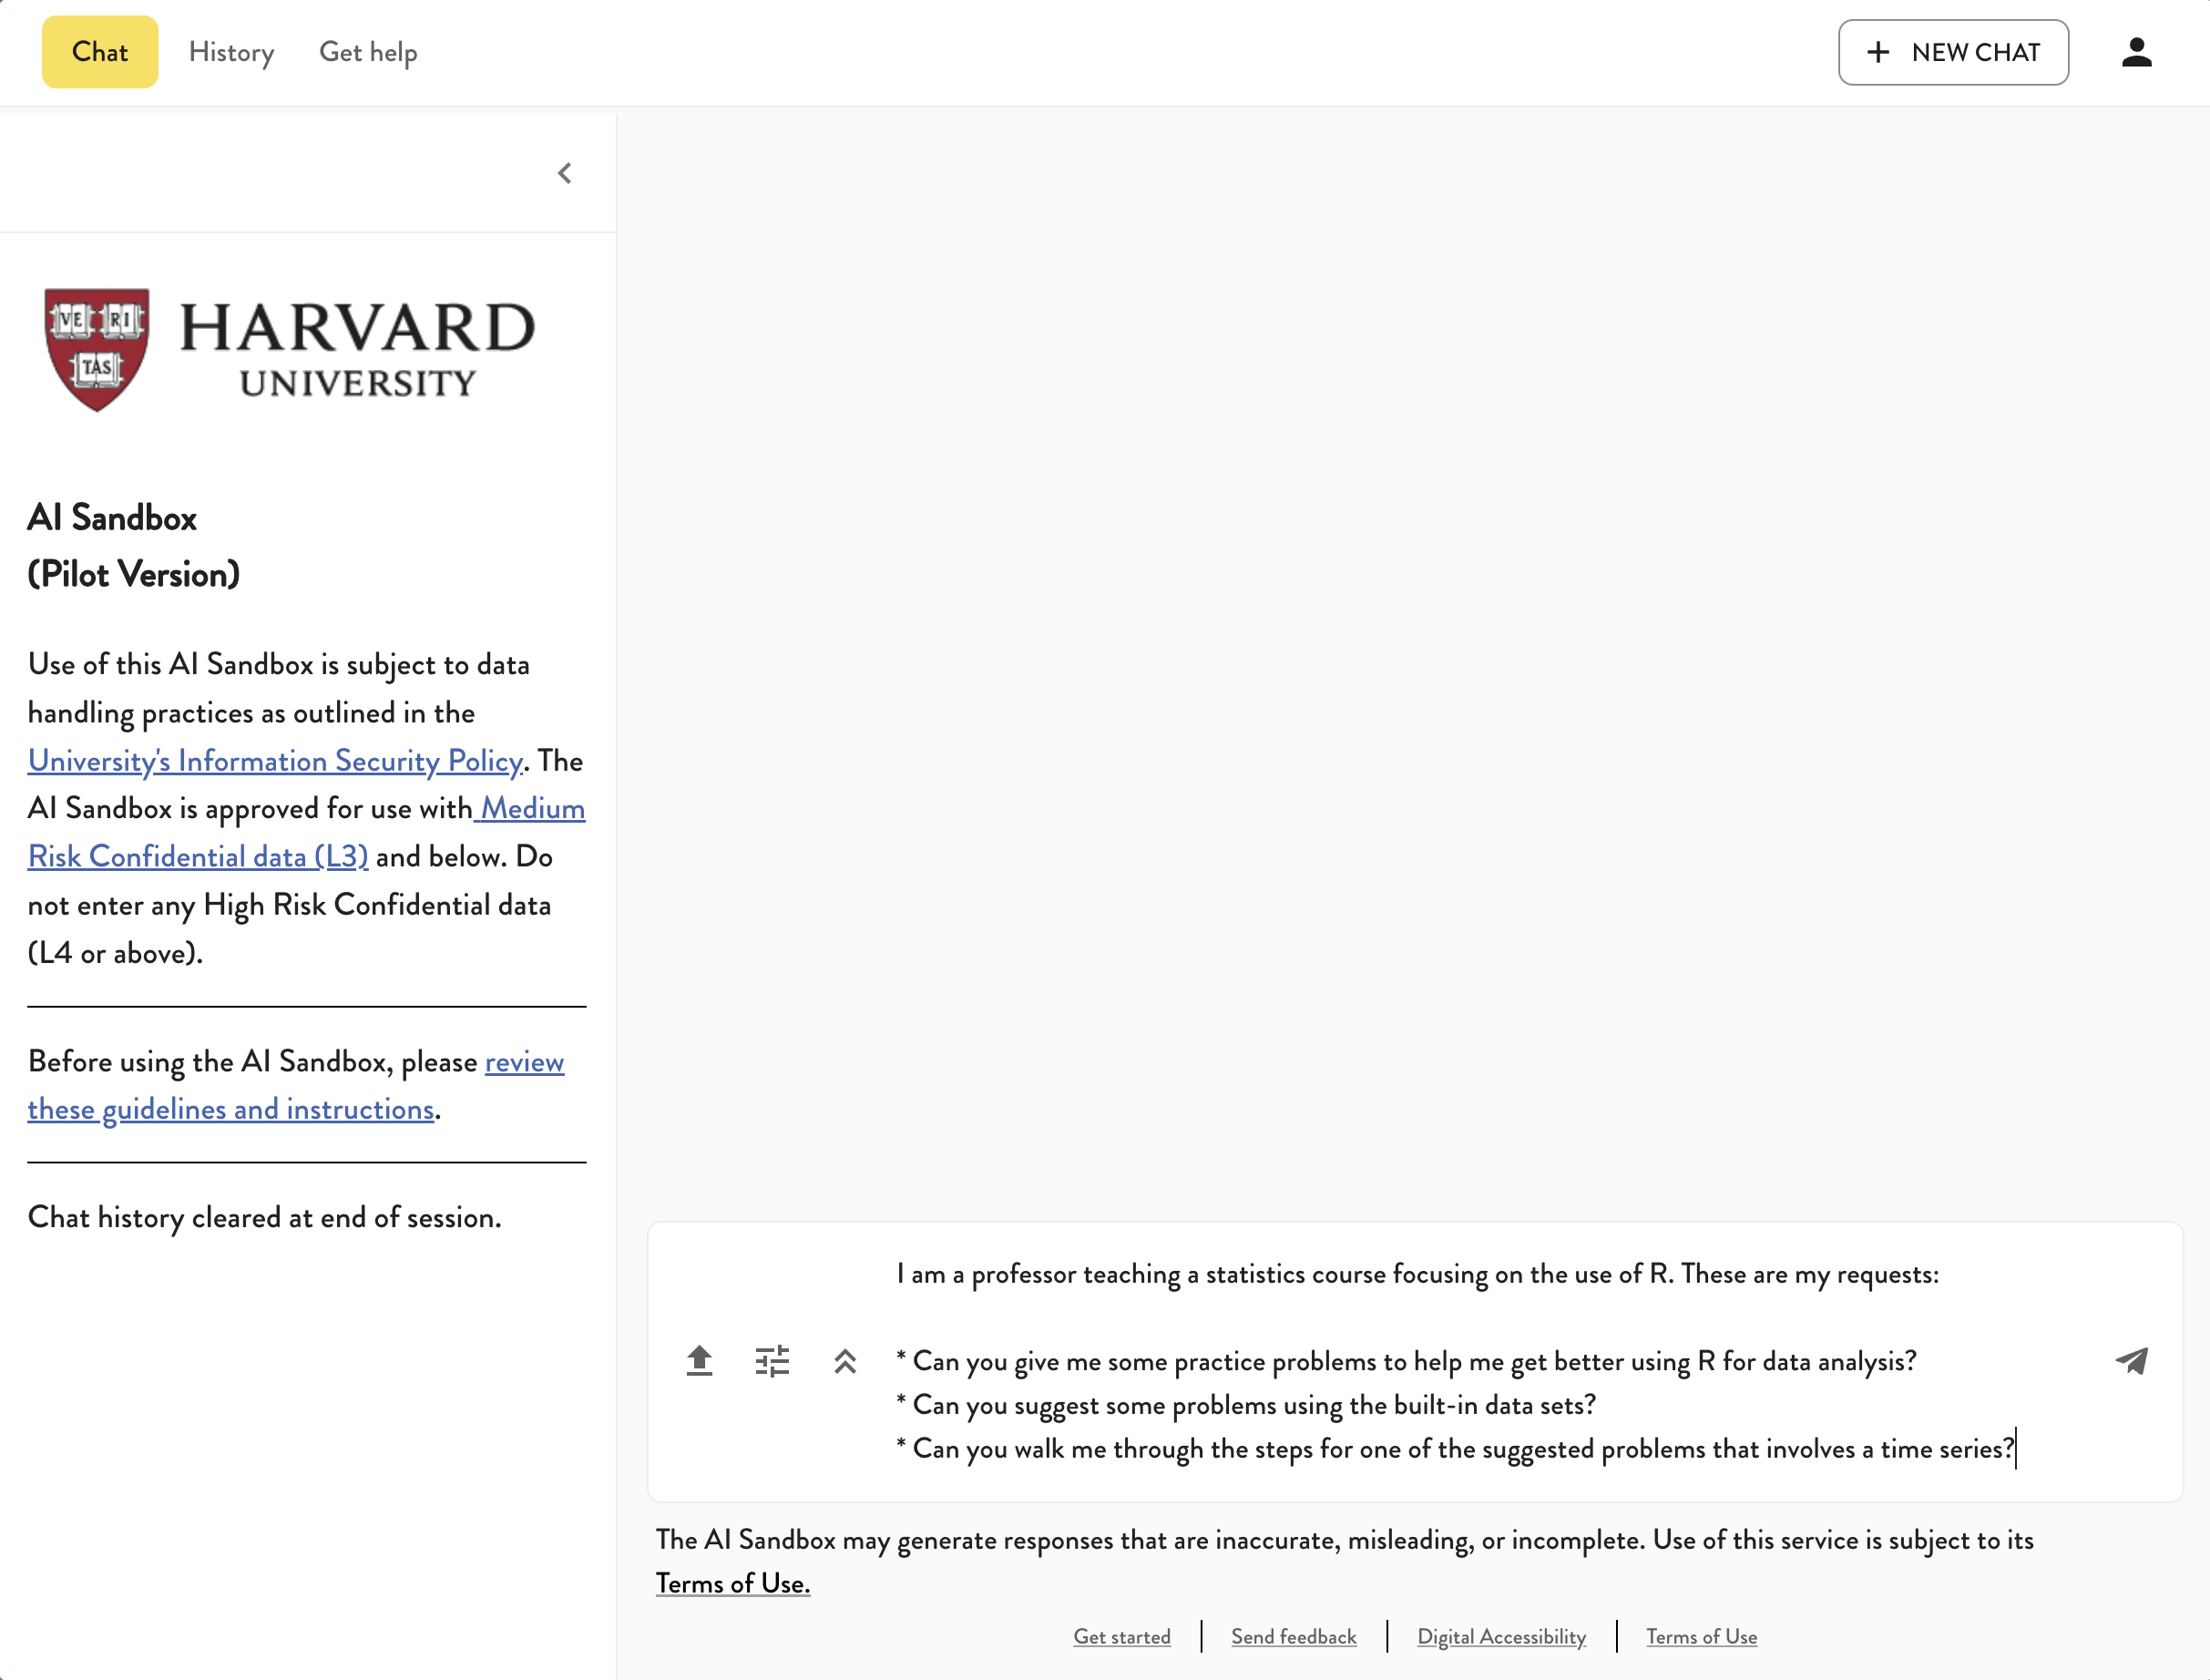
* I am a professor teaching a statistics course focusing on the use of R. These are my requests:
* Can you give me some practice problems to help me get better using R for data analysis?
* Can you suggest some problems using the built-in data sets?
* Can you walk me through the steps for one of the suggested problems that involves a time series?
* AI:
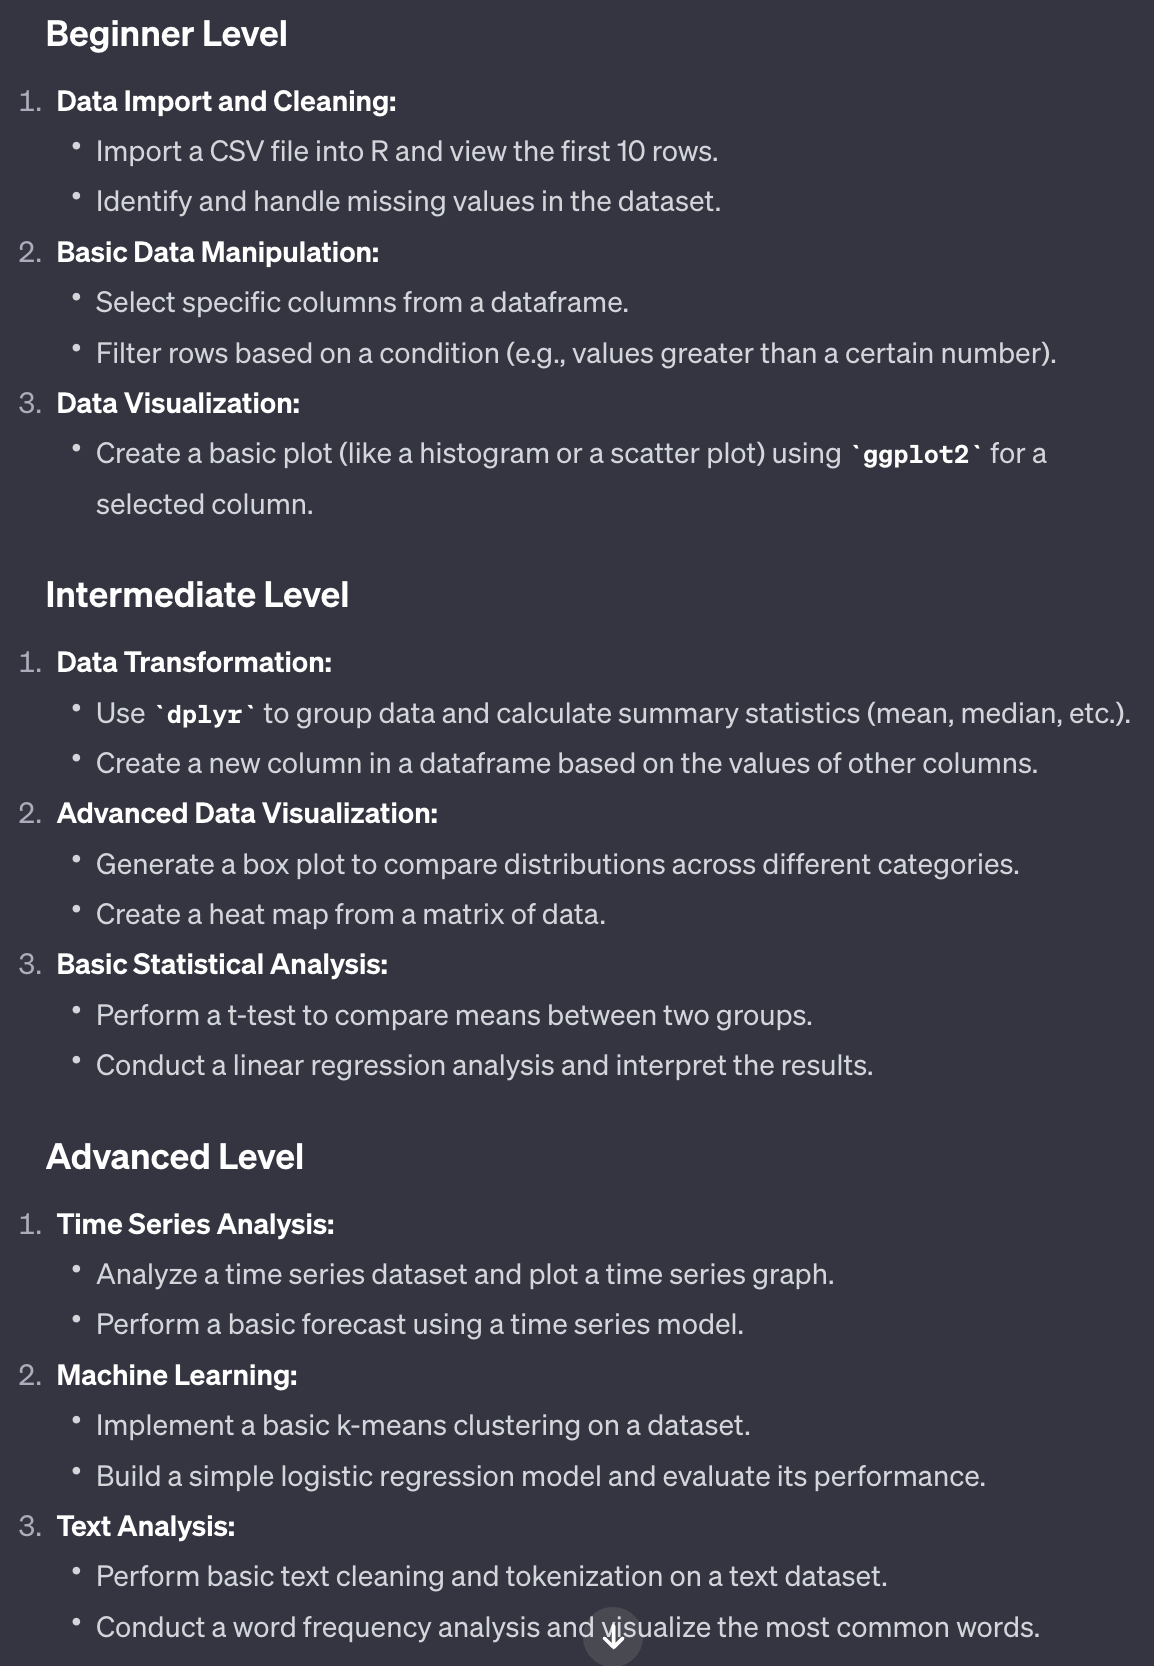
* Of course, I'd be happy to help. Here are some practice problems you can use to improve your skills in R for data analysis:
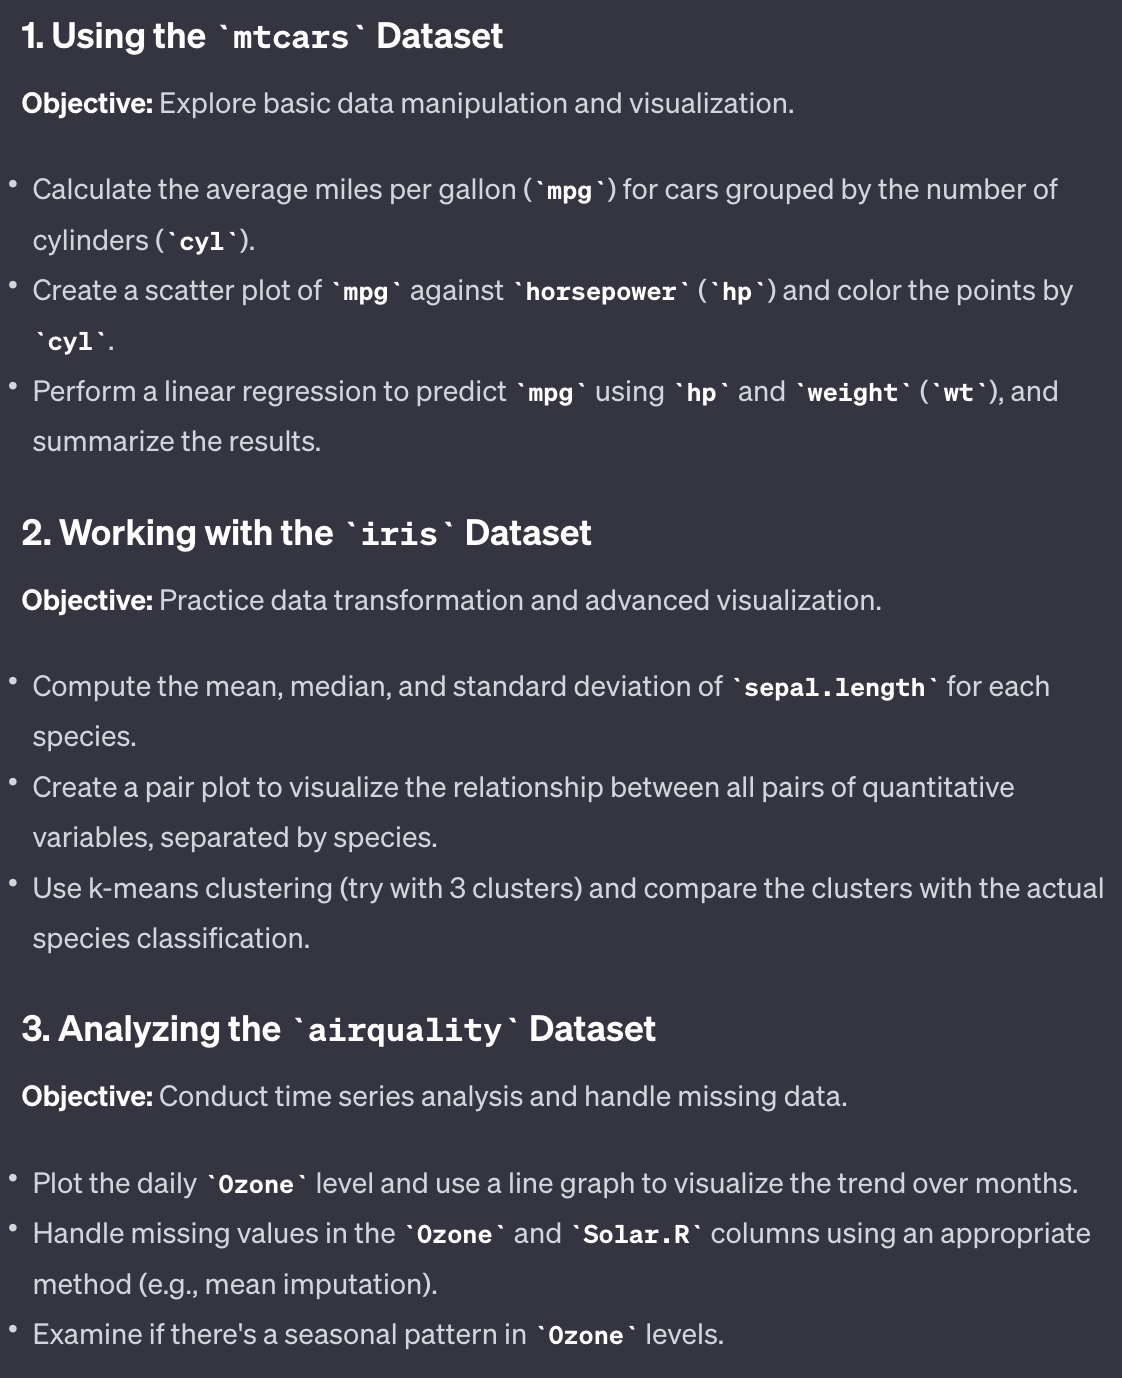
* Load the "mtcars" dataset in R and perform a linear regression analysis. The goal is to predict mpg (miles per gallon) using the variables of cyl (number of cylinders), hp (horsepower), and wt (weight).
* Use the "iris" dataset in R to perform a clustering analysis. Try to group the iris species based on sepal length and width, and petal length and width.
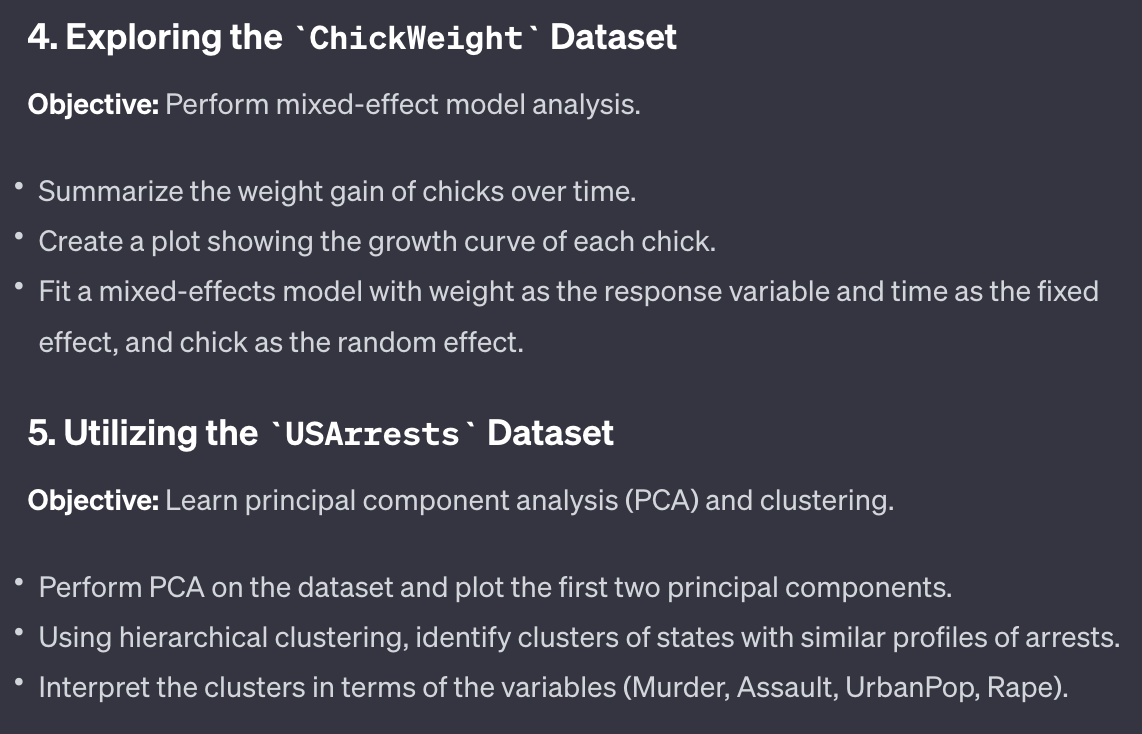
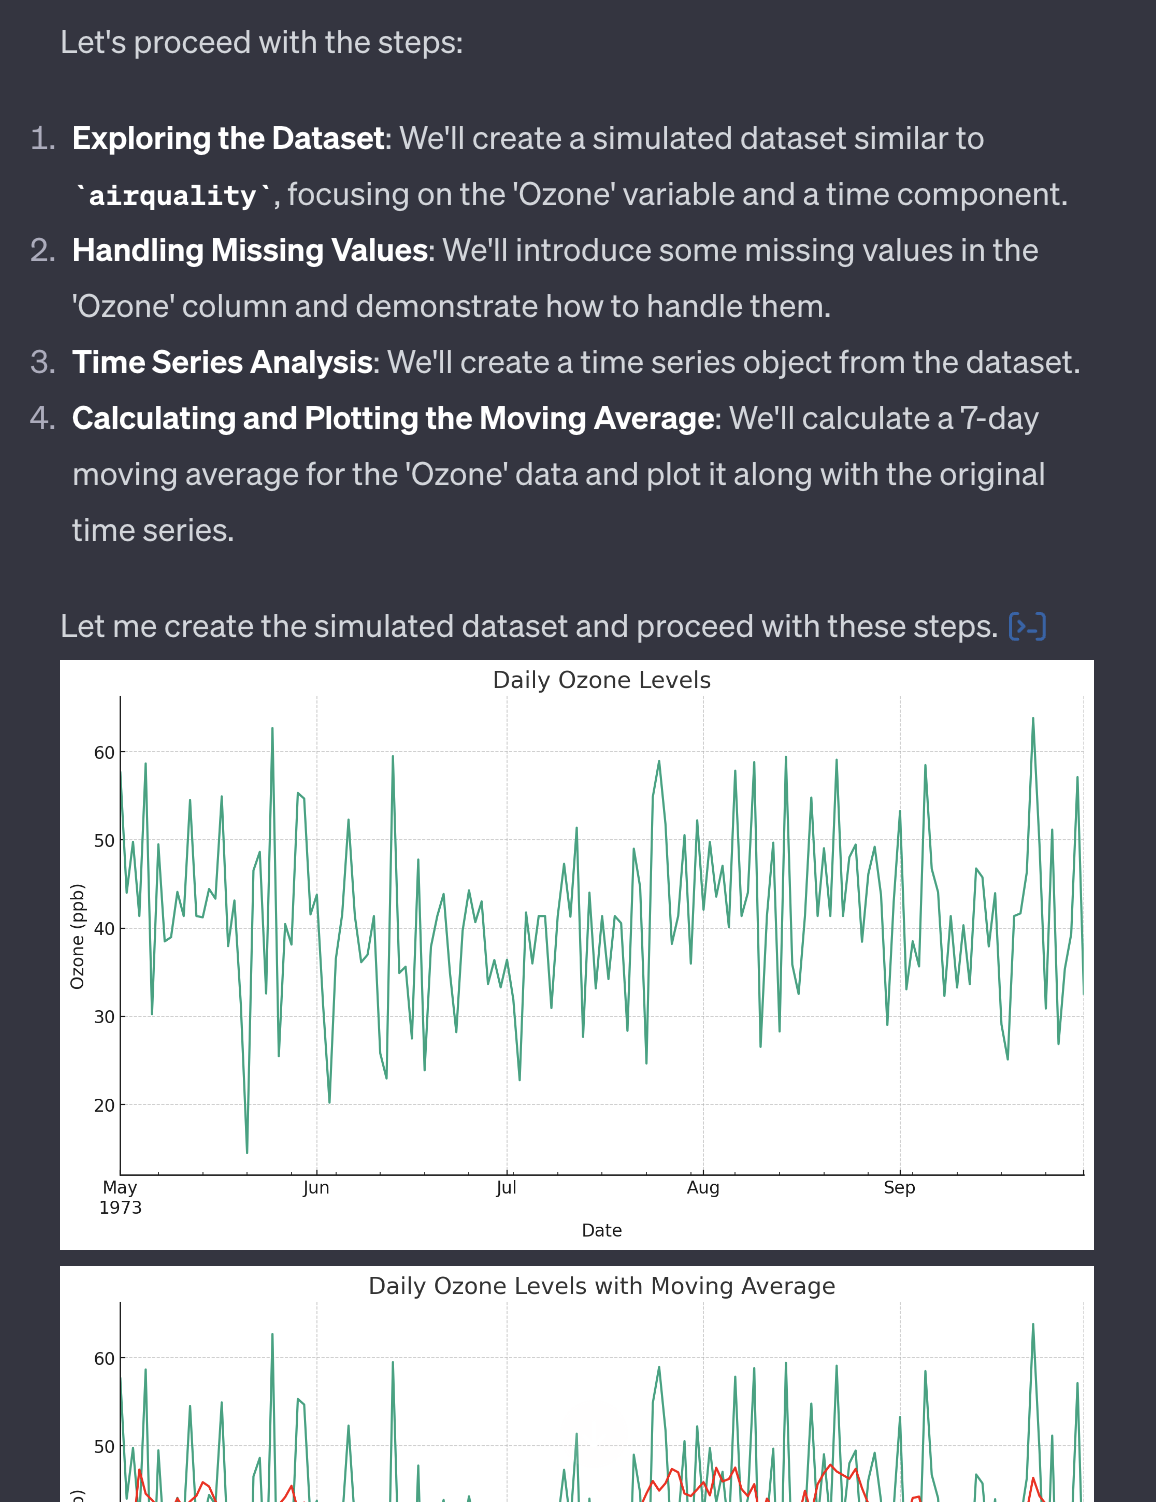
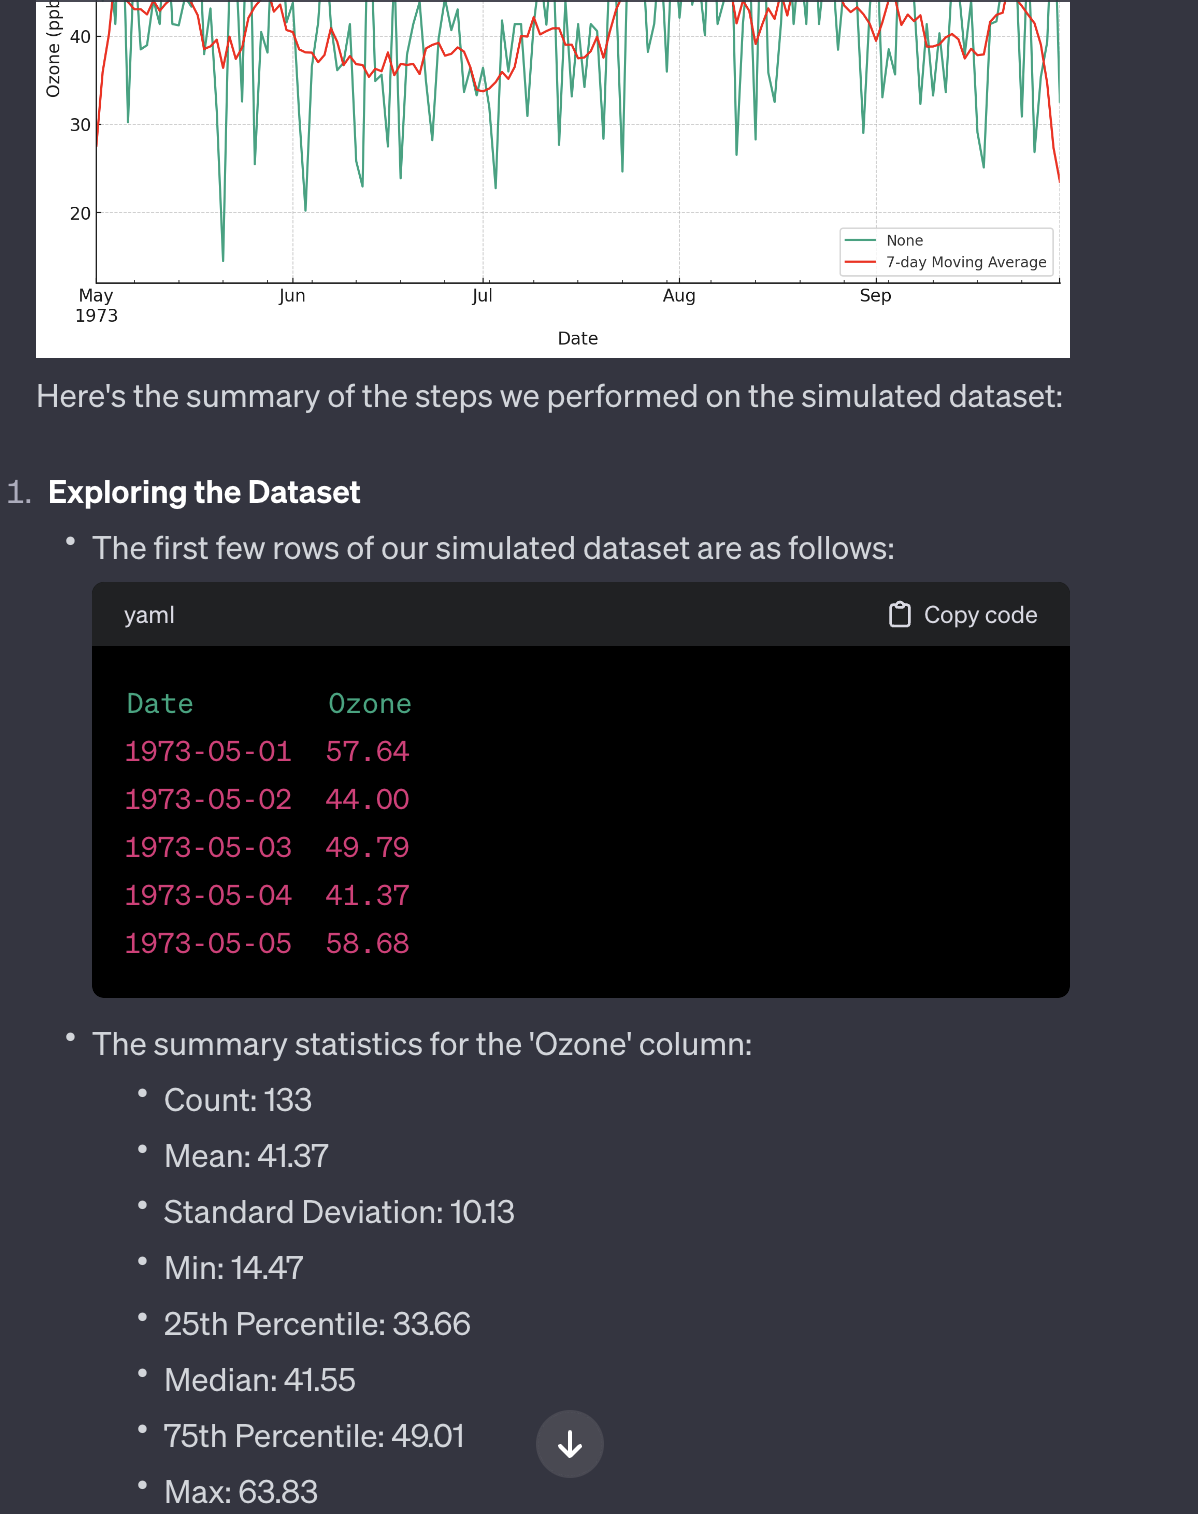
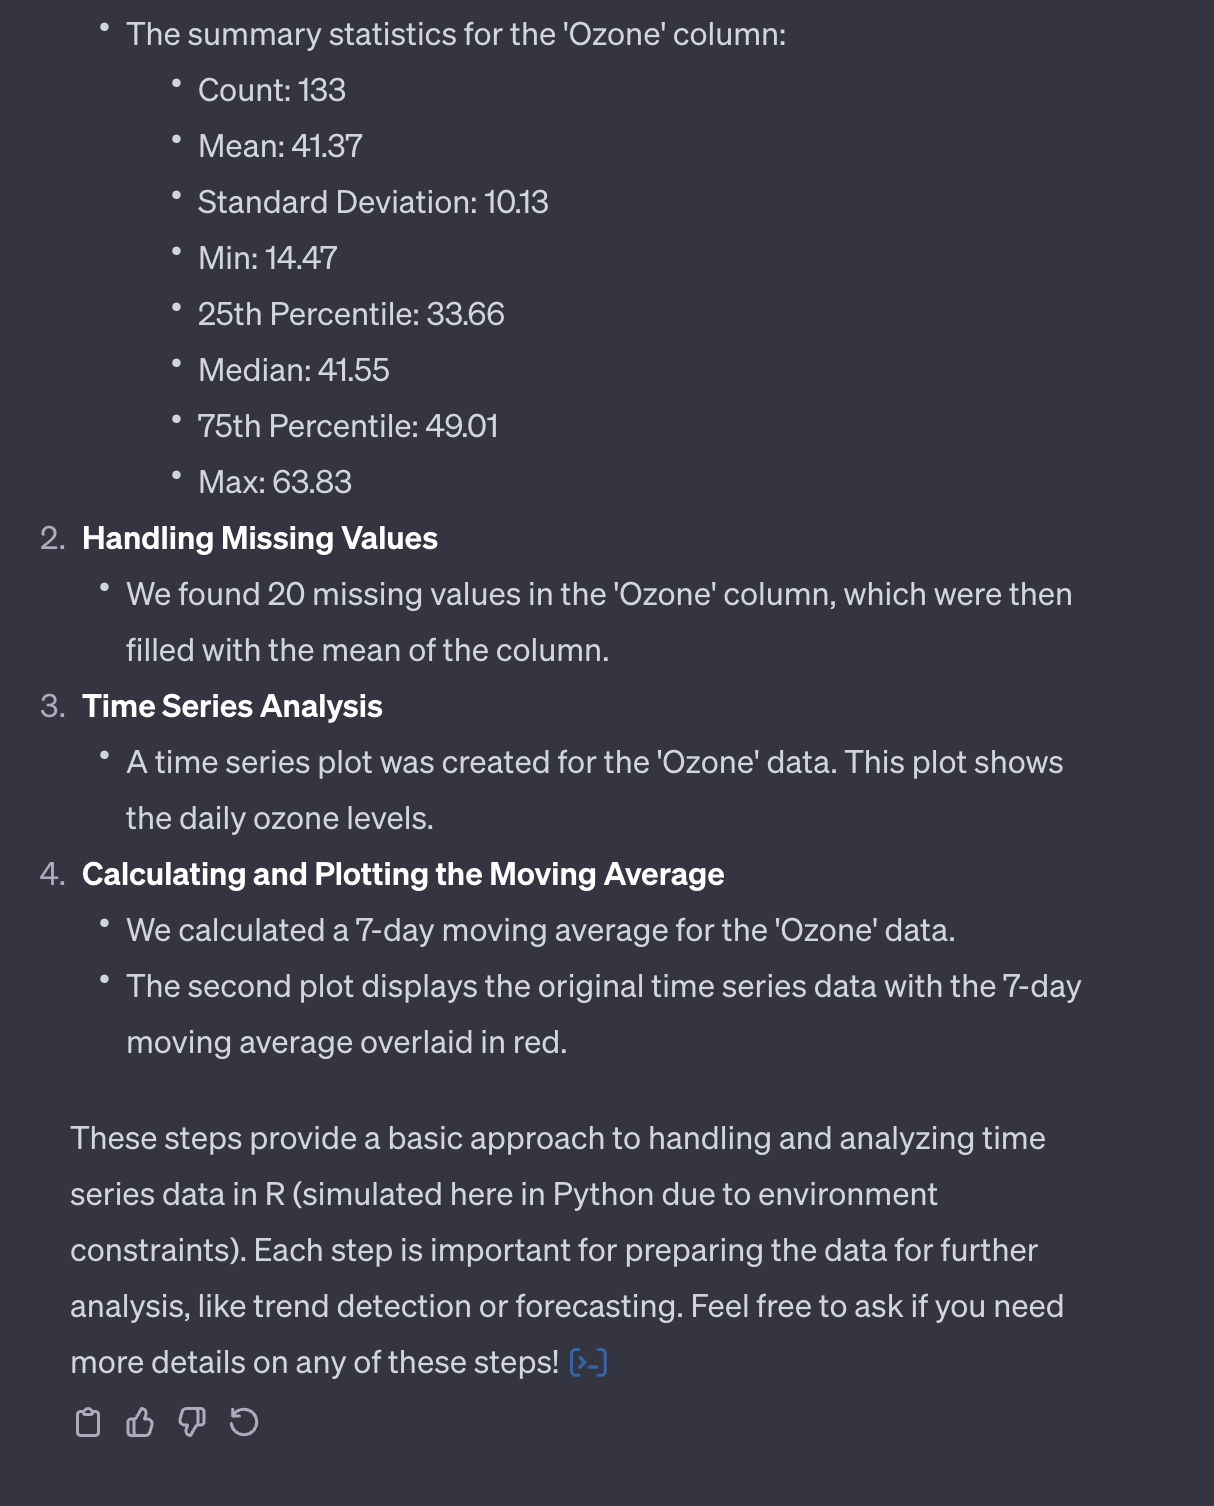
* With the "airquality" dataset, perform a time series analysis on the daily average temperature.
* Use the "USArrests" dataset to create a correlation matrix and visualize it using a heatmap.
* Use the "mtcars" dataset again, but this time perform a logistic regression. The goal is to predict am (transmission type) using the variables of mpg and hp.
* Now, let's walk through the steps for the time series analysis problem using the "airquality" dataset:
* Load the "airquality" dataset: data("airquality")
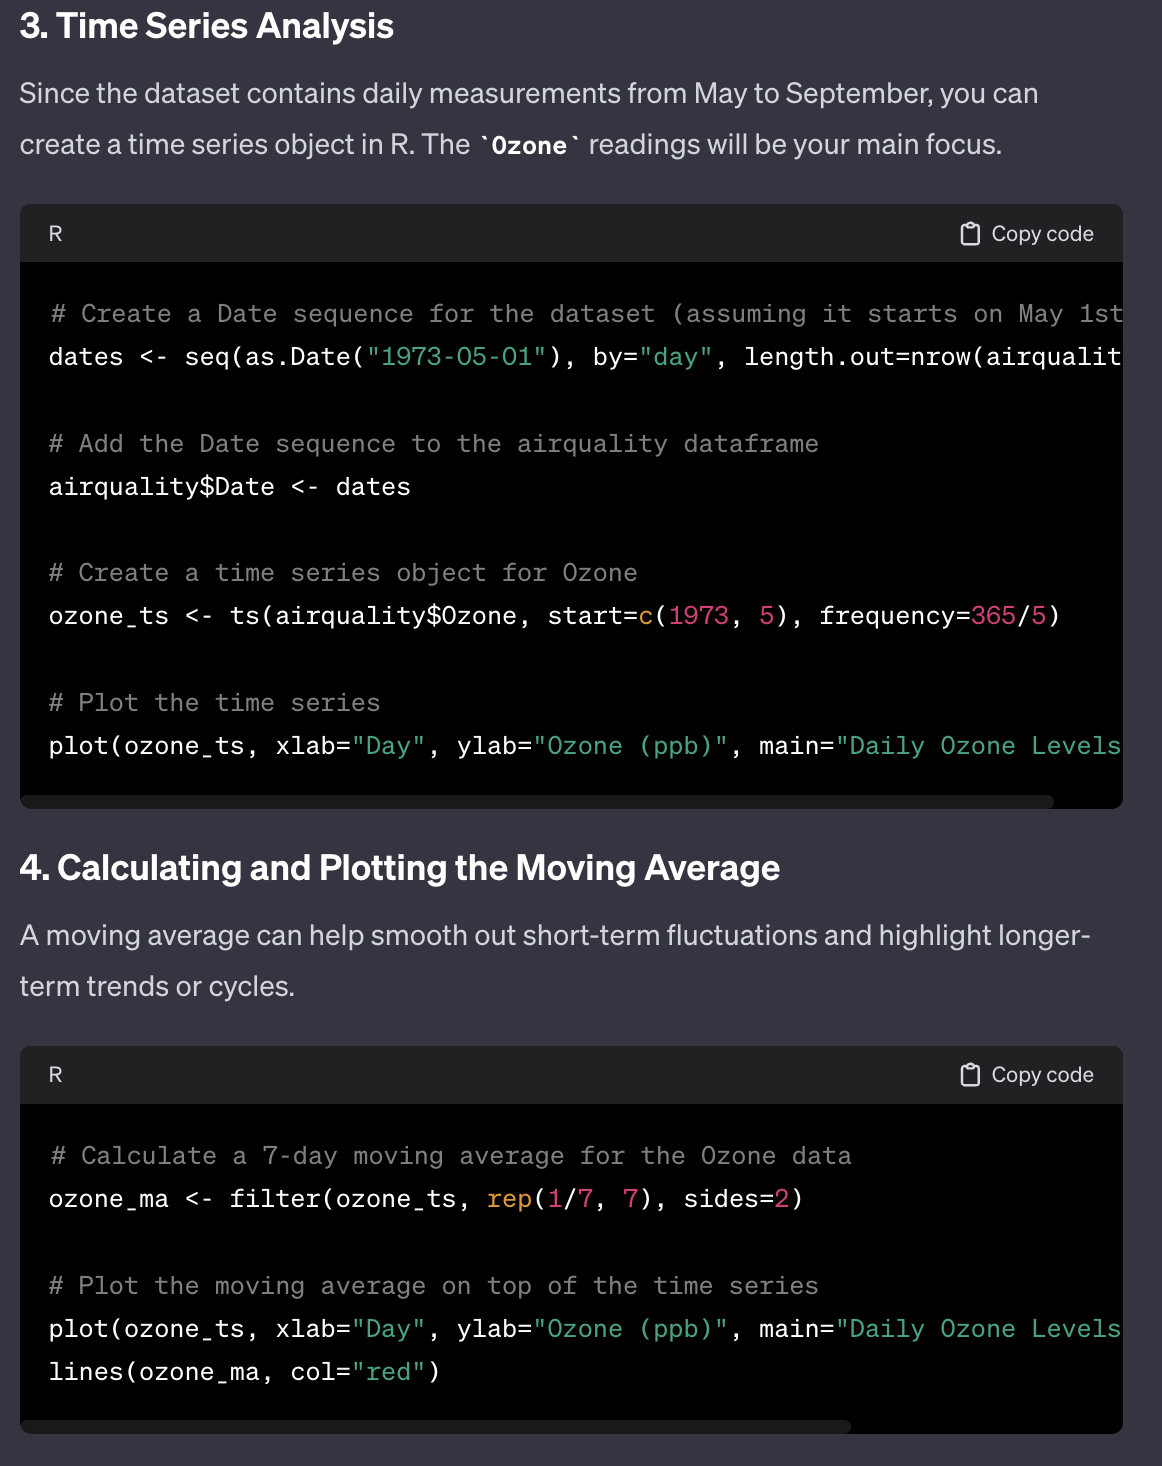
* Convert the dataset into a time series object. Since the data is recorded from May to September (5 months), we have a frequency of 153 (31 days in May, June, July, and August, plus 30 days in September): temp_ts <- ts(airquality$Temp, start = c(1973, 5), frequency = 153)
* Plot the time series data: plot(temp_ts, main = "Daily Temperature Time Series", xlab = "Time", ylab = "Temperature")
* Decompose the time series data into its components (trend, seasonal, and random): temp_decomp <- decompose(temp_ts)
* Plot the decomposed time series data: plot(temp_decomp)
* Forecast the future values using an ARIMA model. First, determine the best parameters (p, d, q) for the ARIMA model using the auto.arima() function from the "forecast" package. Then, use these parameters to fit the model: library(forecast); temp_arima <- auto.arima(temp_ts); forecast_temp <- forecast(temp_arima)
* Plot the forecasted values: plot(forecast_temp)
* Remember to interpret your results at each step. For example, in the decomposition step, you might observe a clear upward trend in temperature over the months, or a specific pattern repeating itself every month (seasonality). In the forecasting step, you might observe how the model expects the temperature to change in the future.
 Sign in with Wallet


