# 2016q3 Homework1 (phonebook)
contributed by <`kevinbird61`>
[2015秋季留下的筆記](https://hackpad.com/Embedded-System-Hw2--Kb2ocXebcwO)
## 規劃
- [x]閱讀phonebook程式架構
- 如何搭配makefile做使用
- [x]搭配makefile + script 了解perf & gnuplot使用
- [x]測試第1版本(origin)
- [x]測試第2版本(opt - huffman tree,使用字串壓縮)
- [ ]改善程式效能
## About Makefile
- Cool part
- [IMPL] 利用Makefile裡頭的編譯參數-D[...]來告訴程式此時該include檔案全名
- 這樣就能達到只使用同一個main.c來編譯所有檔案
- `$@`、`$<`
- 稱之為自動變數
- $@ = target
- $< = 第一個dependency
- `%`
- 樣式規則
```shell
main: main.o foo1.o foo2.o
${CC} main.o foo1.o ${CFLAGS} ${INC} ${LIB} -o $@
%.o: %.c target.h
${CC} $< ${CFLAGS} ${INC} ${LIB} -lpthread -c
```
舉個例子來看,在編譯時,target main裡頭需要main.o及foo1.o,此時便到%.o該行去,這時的%便是main,而`$<`就是main.c;而換成foo1.o時,此行的%便成為foo1了,而`$<`此時就是foo1.c
## About Gnuplot
- 察看script裡頭的runtime.gp來閱讀gnuplot的指令(配makefile)
- 以空白為界,上半部主要為設定值(字體、標題等等),下半部主要為設定位置
```shell
plot [:][:0.150]'output.txt'
using 2:xtic(1) with histogram title 'original', \
'' using ($0-0.06):(0):2 with labels title ' '
```
* plot 後面接的兩個分別為[x scale][y scale]'input filename'
* 第1行using後面便是拿input file第二行的資料來繪製長條圖;第2行using後面則是設定數字繪製的位置。
## Origin Version & Structure optimizing version
- 原先使用的全串接linked-list,append()及findName()所花費的時間都很多
- 藉由修改原本structure,把不必要的部份以pointer的方式暫時移出,變得到大幅改善
## String compression version(Huffman Compression)
- 主要是去年沒有做出來,想把他完成,再次實作
- 經過計算words.txt裡頭的字母出現的數量來建Huffman code tree(目前先用手動方式建樹)便可以得到26個英文字母的huffman encode的結果
```xml
A:110
B:000001
C:00001
D:01111
E:100
F:111110
G:11110
H:10101
I:0001
J:11111110
K:001110
L:1110
M:01110
N:0101
O:0100
P:10100
Q:11111111
R:0010
S:0110
T:1011
U:00110
V:0000000
W:0000001
X:11111101
Y:001111
Z:11111100
```

##### 觀察
- 可以看到藍色為Huffman compression的實作結果
- 其append()的花費時間頂破天際,但在findName()的表現還算可以
##### 探討
- Huffman compression主要的壓縮方式為:
- Step 1:統計所有字元出現次數
- Step 2:依據字元出現數量,來對該字元做一個壓縮的動作
- 例如原本的abccbcc,ax1,bx2,cx4;依據出現愈頻繁,壓縮後的字串愈短來假設,a = 00 , b = 01 , c = 1;原本存取abccbcc的大小需要7個char,也就是7*8 = 56 bits;而壓縮後則可以看到,2x1+2x2+1x4 = 10 bits,相對減少記憶體的需求
- Step 3:有了compression的方式後,再每次appendName()時都需要Huffman壓縮過,並動態配置記憶體給lastName
- 每次的appendName都需要查表並多了加上compression的動作,導致append時間大幅上升
- 但是再次壓縮了檔案大小,使得cache-misses的數量下降:
- 原始
```XML
Performance counter stats for './phonebook_orig' (100 runs):
942,621 cache-misses # 85.133 % of all cache refs ( +- 0.91% )
1,107,232 cache-references ( +- 1.01% )
260,742,129 instructions # 1.40 insns per cycle ( +- 0.02% )
185,766,505 cycles ( +- 0.52% )
0.058256961 seconds time elapsed ( +- 2.26% )
```
- 更改datastructure
```XML
Performance counter stats for './phonebook_opt' (100 runs):
120,558 cache-misses # 47.111 % of all cache refs ( +- 1.78% )
255,901 cache-references ( +- 2.12% )
244,779,086 instructions # 1.74 insns per cycle ( +- 0.02% )
140,485,801 cycles ( +- 1.56% )
0.044147859 seconds time elapsed ( +- 1.82% )
```
- Huffman compression
```XML
Performance counter stats for './phonebook_strcp' (100 runs):
81,212 cache-misses # 49.898 % of all cache refs ( +- 1.82% )
162,754 cache-references ( +- 2.58% )
773,720,487 instructions # 2.14 insns per cycle ( +- 0.09% )
361,496,589 cycles ( +- 1.82% )
0.111428579 seconds time elapsed ( +- 1.83% )
```
>「程式輸出的文字訊息」請勿使用圖片表示,請改由文字貼上[name=課程助教]
- Step 4:之後findName(),把輸入的Name同樣以Huffman compression過後比對
- 增加繪製cache-misses的script來檢視每次運行產生的cache-misses

- 順便看到perf輸出於stderr,非stdout,所以除了在command時加上2>&1之外,還可以用perf stat -o <fileName>來輸出,並可再加上 -x <file separator>來處理我要輸出的特定字串資訊,這樣就不需要對直接輸出的格式做負責的處理。
##### 改進空間
- 由結果看,Huffman compression為優化data structure的方式之一;而如何降低append時所帶來的巨大消耗則是關鍵
- 可以加上Hash function來減少append以及findName時的查找時間
## Reference
- [Makefile Intro](http://tetralet.luna.com.tw/?op=ViewArticle&articleId=185)
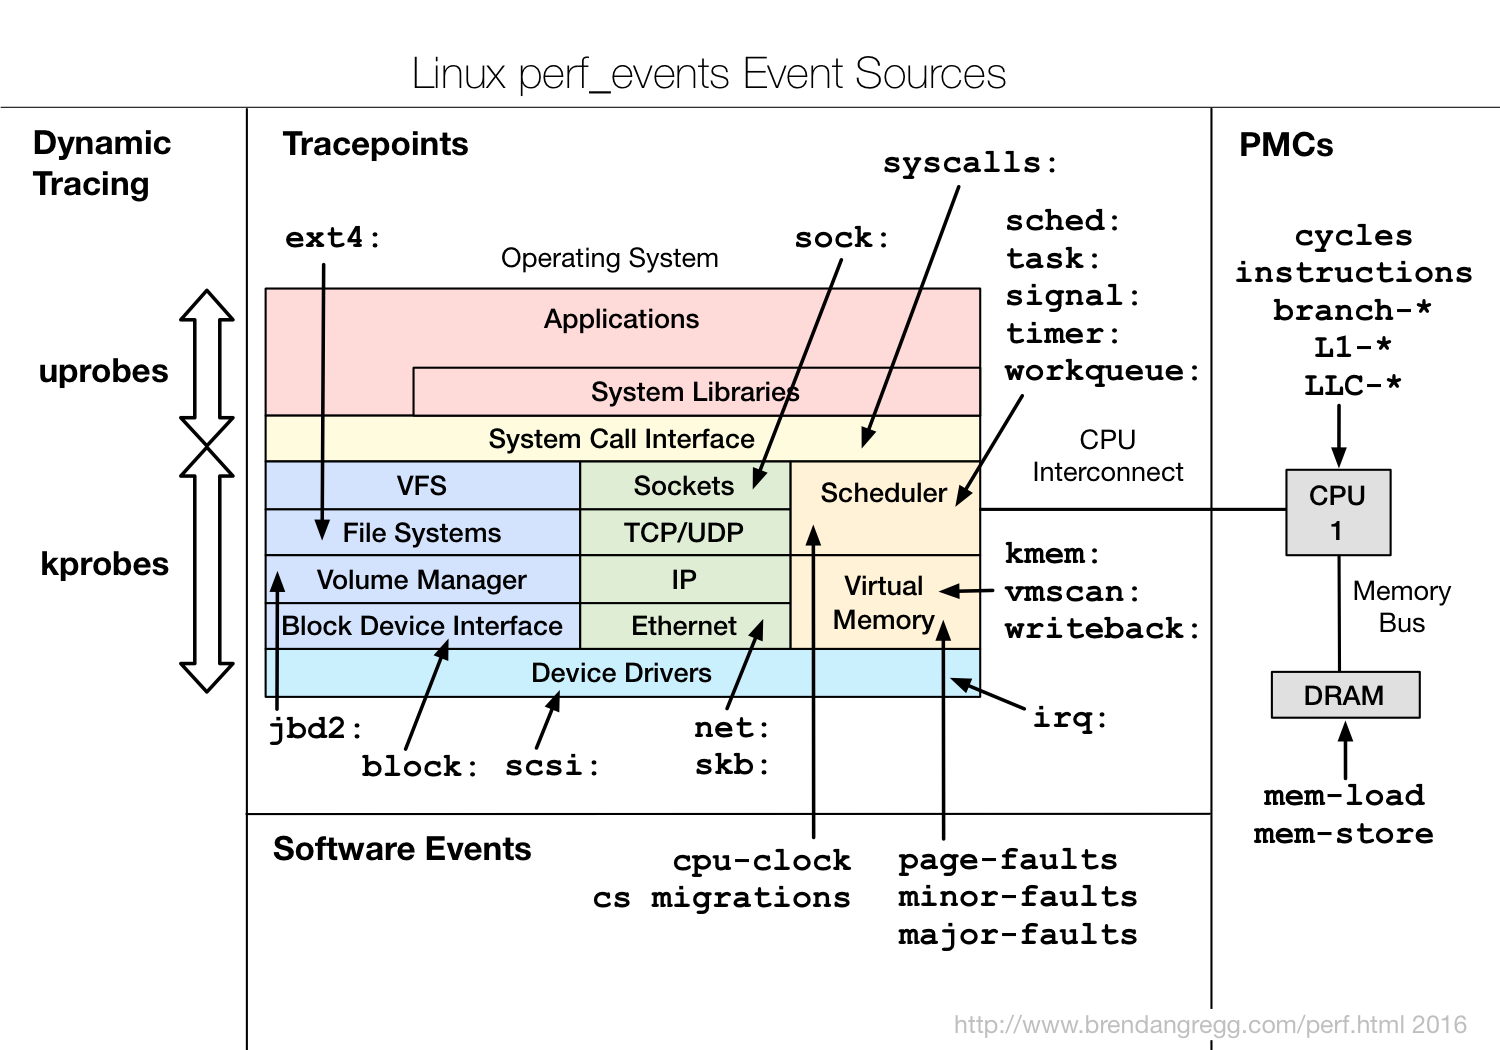
- Perf & Event
 Sign in with Wallet
Connect another wallet
Sign in with Wallet
Connect another wallet