# 2017q1 Homework1 (phonebook)
contributed by <`Weinux`>
###### tags: `sysprog2017` `w1` `phonebook` `Weinux`
## Review by `Sean1127`
1. 實驗的結果在用 gnuplot 的時候,除了`append()`, `findName()`之外還可以增加`total`(也就是前面兩者相加)這一欄,實驗結果會更清楚
2. `$ sudo dmidecode -t cache | more`跟`$ lscpu`有什麼不同,結果有出入要如何解釋?
```
$ lscpu | grep cache
L1d cache: 32K
L1i cache: 32K
L2 cache: 256K
L3 cache: 3072K
```
```
$ sudo dmidecode -t cache
# dmidecode 3.0
Getting SMBIOS data from sysfs.
SMBIOS 2.7 present.
Handle 0x000A, DMI type 7, 19 bytes
Cache Information
Socket Designation: CPU Internal L1
Configuration: Enabled, Not Socketed, Level 1
Operational Mode: Write Back
Location: Internal
Installed Size: 128 kB
Maximum Size: 128 kB
Supported SRAM Types:
Unknown
Installed SRAM Type: Unknown
Speed: Unknown
Error Correction Type: Single-bit ECC
System Type: Other
Associativity: 8-way Set-associative
```
這是在我的電腦上跑的結果,這邊寫我的`L1 cache`有 128 kB,但上面寫我只有 64 kB
另外`cache block`大小這個指令並沒有顯示,那要如何知道?
3. cache miss 的計算需要再確認
4. 需要
>回答以下問題:本例選用的 dataset (也就是輸入電話簿的姓名) 是否存在問題?
>* 有代表性嗎?跟真實英文姓氏差異大嗎?
>* 資料難道「數大就是美」嗎?
>* 如果我們要建立符合真實電話簿情境的輸入,該怎麼作?
5. git commit message 寫的不錯!
## 目標
* 作業要求 [B01: phonebook](https://hackmd.io/MwJgHAplBsELQGMAMwCGcAsHjDgIwgBMBOOAdmlSULADMRiBWYiIA===?both)
* 準備 GNU/Linux 開發工具
* 學習使用 Git 與 GitHub
* 學習效能分析工具
* 研究軟體最佳化
* 技術報告寫作練習
> 不是第一次接觸這個作業, 所以這次主要目標
> 1. 思考並實驗不同資料結構對於效能的影響(cache miss, append() & findName()時間比較).
> 2. 以及思考電話簿字典檔的結構與可能問題
> 3. 嘗試實作挑戰題
> 4. 針對之前不熟悉的開發工具再學習與練習
>
> [name=Weinux]
## 開發環境
* OS:Lubuntu 16.04 LTS
* Linux 系統版本: 4.4.0-63-generic
* Architecture: x86_64
* CPU 作業模式: 32-bit, 64-bit
* Byte Order: Little Endian
* CPU: Intel(R) Core(TM) i5-2410M CPU @ 2.30GHz
* Model name: Intel(R) Core(TM) i5-2410M CPU @ 2.30GHz
* Memory: 6GB (5870MB)
* Cache:
* L1d cache: 32K
* L1i cache: 32K
* L2 cache: 256K
* L3 cache: 3072K
也可以使用指令得到電腦的系統架構圖
```
$ sudo apt-get install hwloc
$ lstopo
```

## 作業分析: phonebook
### 更改 struct size
```clike=7
typedef struct __PHONE_BOOK_ENTRY {
char lastName[MAX_LAST_NAME_SIZE];
char firstName[16];
char email[16];
char phone[10];
char cell[10];
char addr1[16];
char addr2[16];
char city[16];
char state[2];
char zip[5];
struct __PHONE_BOOK_ENTRY *pNext;
} entry;
```
```
size of entry : 136 bytes
execution time of append() : 0.047197 sec
execution time of findName() : 0.005958 sec
Performance counter stats for './phonebook_orig' (100 runs):
1,955,691 cache-misses # 92.003% of all cache refs
2,125,670 cache-references
261,892,576 instructions # 1.38 insns per cycle
189,481,205 cycles
0.084996230 seconds time elapsed
```
```
size of entry : 32 bytes
execution time of append() : 0.042181 sec
execution time of findName() : 0.003178 sec
Performance counter stats for './phonebook_opt' (100 runs):
327,951 cache-misses # 59.565% of all cache refs
550,578 cache-references
250,927,988 instructions # 1.78 insns per cycle
141,234,044 cycles
0.070440497 seconds time elapse
```

### 使用 Hash Function
```
Performance counter stats for './phonebook_hash' (100 runs):
885,265 cache-misses # 79.024 % of all cache refs ( +- 0.03% )
1,120,246 cache-references ( +- 0.13% )
350,152,192 instructions # 1.46 insns per cycle ( +- 0.21% )
239,262,574 cycles ( +- 0.34% )
0.107383867 seconds time elapsed
```

* 回答以下問題:本例選用的 dataset (也就是輸入電話簿的姓名) 是否存在問題?
* 有代表性嗎?跟真實英文姓氏差異大嗎?
* 資料難道「數大就是美」嗎?
* 如果我們要建立符合真實電話簿情境的輸入,該怎麼作?
## cache 相關知識
從 1980 年代開始,main memory 和 CPU 的速度差距急速拉大,主記憶體存取速度雖然時有提升,卻仍不及 CPU 的進展,因此需要一個中間層 cache 來彌補因為兩者間速度落差帶來的效能衝擊。

* 原理:cache 利用記憶體架構的兩大原則來設計
**1. Temporal Locality:** 剛剛用過的記憶體很容易再被使用(例如,for迴圈)
**2. Spatial Locality:** 如果一個記憶體剛剛使用過,他附近的記憶體位址也很可能被使用到(例如,陣列存取)
* "cache" 是為了讓資料存取的速度適應 CPU 的處理速度允許 CPU 直接到 cache memory 查看所需資料是否存在。若是,則直接存取不必再到 main memory —— 減少到 main memory 存取的次數,解決 main memory 存取不夠快的問題。
* 延伸閱讀: [Optimizing the data cache performance ](https://www.cs.umd.edu/class/fall2001/cmsc411/proj01/cache/matrix.html)
* set associative:set associative 的方式,也就是把 cache 分成多個 set,CPU必須檢查指定set內的每個block是否有可用的cache。最極端的情況下就是Fully Associative,也就是CPU要檢查cache內所有的block。
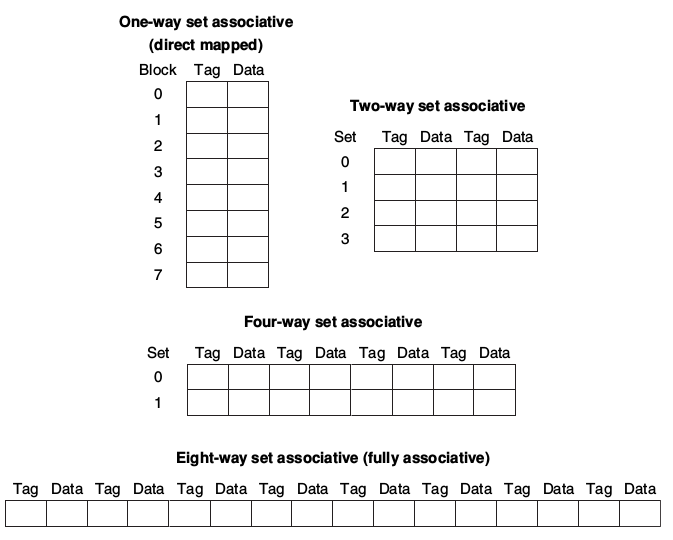
* 實作多個four-way set的方式
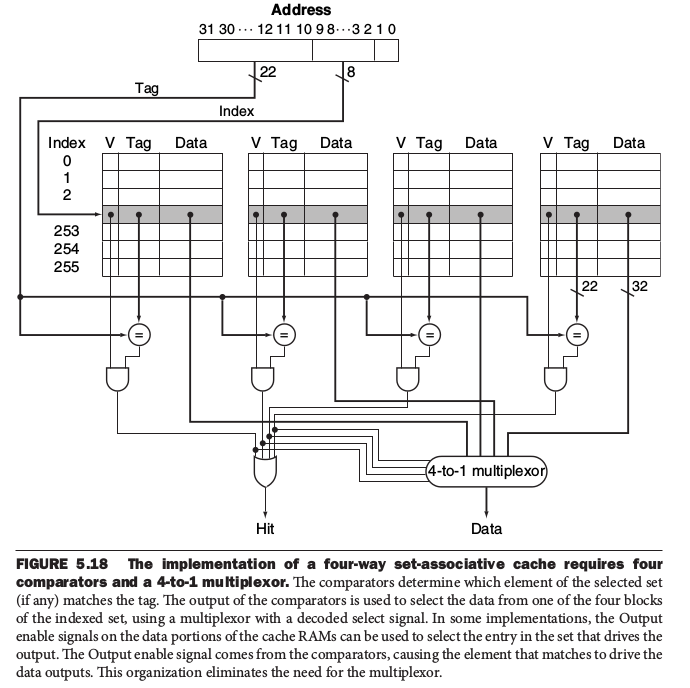
更多內容如下:
* 資料來源:[](http://enginechang.logdown.com/tags/cache)[http://enginechang.logdown.com/tags/cache](http://enginechang.logdown.com/tags/cache)
* [](http://www.cs.iit.edu/~virgil/cs470/Book/chapter9.pdf)[http://www.cs.iit.edu/~virgil/cs470/Book/chapter9.pdf](http://www.cs.iit.edu/~virgil/cs470/Book/chapter9.pdf)
* [](http://www.mouseos.com/arch/cache.html)[http://www.mouseos.com/arch/cache.html](http://www.mouseos.com/arch/cache.html)
**Cache Miss的計算:以 phonebook 為例**
先透過指令查詢硬體規格如下:
`$ sudo dmidecode -t cache | more`
* cache 總大小是 32K Byte
* 一個 cache 的 block 為 64 Byte
* 一個 entry 的大小為( 136 byte) + memory control block ( 8 byte) = 144 byte
* 8-way set associative
需要有多少block?
(考慮main.c findName() & append 這2個function 因為 linked-list 跟搜尋存取花最多時間)
- 350000 筆資料 * 每筆 144 byte = 50400000 byte
- 50400000 byte / 64byte ( block size ) * 2次 function = 1575000 block
- 讀一個block是一次 reference
執行 phonebook 程式確認 perf 中 cache 相關訊息
`$ make cache-test
`
size of entry : 136 bytes
execution time of append() : 0.047197 sec
execution time of findName() : 0.005958 sec
Performance counter stats for './phonebook_orig' (100 runs):
1,955,691 cache-misses # 92.003% of all cache refs
2,125,670 cache-references
261,892,576 instructions # 1.38 insns per cycle
189,481,205 cycles
- 可以看到計算出來的 cache-reference 1,575,000 與實際 2,125,679 量級相同
cache 有幾個 set?
- cache 32K Byte / block 64 Byte = 512 block
- 512 / 8-way set = 64 個
一個 cache line 可以存多少筆 entry
- 144 byte / 64 byte = 2.25 所以需要 3 個 block
已知是系統為 8-way set 所以可以存 2 個
cache miss
- 1,575,000 ( 總 block ) / 3(一個 entry 需要3 block) = 525,000 組 entry
- 525,000 / 64( index 數) = 8,203 ( tag 數,填到相同 index 的個數 )
- 由上知一個 cache line 最多可以放 2 組 entry,所以有兩次機會
- 8,203 / 2 = 4,101 ( 可能被對到次數 )
- 4,101 * 64 ( index 數) * 3 ( entry 佔的 block 數) = 787392 ( cache hit 次數 )
- 1,575,000 - 787,392 = 787,608 ( cache-miss)
- 787,608 / 1,575,000 = 50%(miss rate) ??????
>
>驗證助教的共筆,發現根據同樣方式計算. cache-miss rate 結果也是50%左右, 而非程式中的 92%, 需要再確認 cache 計算方式
* [cache 原理和實驗](https://hackmd.io/MwMwRgHGDsIIYFoAm04DYEBZMEYcIhwCYBTBNABgFYlgSRYBOUoA)
* [关于CPU Cache -- 程序猿需要知道的那些事](http://cenalulu.github.io/linux/all-about-cpu-cache/)
* [Programming Small](https://hackmd.io/KYYwzAjAHATAJgVgLQEMQDMxICwIcJATgHZhikowE4YA2AI2xnqgSA==?view)
## 工具學習
### Perf
```
$ ./ "執行檔案名稱" & sudo perf top -p $!
```
### Makefile
* [Makefile 語法和示範](https://hackmd.io/s/SySTMXPvl#)
### gunplot
* [gnuplot 語法解說和示範](https://hackmd.io/s/Skwp-alOg#)
### Github
* [How to Write a Git Commit Message](https://chris.beams.io/posts/git-commit/)
## 參考資料
 Sign in with Wallet
Connect another wallet
Sign in with Wallet
Connect another wallet