2016q3 Homework2 (phonebook-concurrent)
===
contributed by <ktvexe>
- [ ] concurrency 教材的認知
- [ ] 程式正確性驗證
- [ ] 效能分析實驗 (必須要有圖表)
- [ ] 以及充份說明你如何改善效能
## Code Refactoring
[Martin Fowler](https://en.wikipedia.org/wiki/Martin_Fowler) 在書中定義 Refactor 如下:
> 在不改變軟體外部行為的前提下,改變其內部結構,使其更容易理解且易於修改
Refactoring之誤解-
* 為軟體增加功能、改善安全性或是提升效能皆不能算上重構,其中改善效能算是最佳化,不是重構。重構的主要目的就是為了提升可讀性,以及為了日後有了需求的變化時,可以更容易因應修改或是擴充。
## Lock-Free Programming
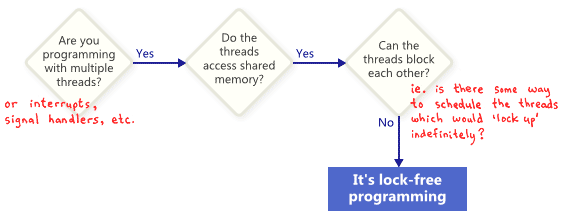
在An Introduction to Lock-Free Programming
一文中提到:
programming without mutexes只是lock-free的一小部份,由下圖可以清楚了解重點在“locking up”
## Concurrency
Concurrency系列一文中提到:
Concurrency是所謂的並行性,並不是Parallelism,正確的處理不同thread之間交互執行衍伸而來的問題,就是concurrency探討的方向。
在冼鏡光的[並行計算投影片](http://blog.dcview.com/article.php?a=BTgBYw1qUWIAaQ%3D%3D)中就舉了很好懂且生活化的例子,以下摘錄片段:
譬如說,一邊走路一邊講電話就同時做兩件事(走路和講電話),一邊寫報告一邊上網聊天也是如此。然而這兩個同時做兩件事的例子卻有著很微妙的差異,前者我們真的是在每一瞬間都是同時進行兩件事(走路和講電話);後者卻不然,大多人都是寫一段報告、就跳過去聊天、再寫報告、再聊天、等等,幾乎不可能在每一瞬間都同時在寫報告和聊天。
兩個例子中前者(兩件事齊頭並進)的處理方式叫做平行(parallel),後者在兩件事中交錯執行、但每一瞬間每件事都有點進展;並行(concurrent,此地採用國內的譯名)指的是交錯執行和平行兩者,所以並行比平行在意義上較廣。
### user-level thread system
說到thread就會想到恐龍書中講到的LWP實作,那現在來討論以coroutine的方式實作thread。
比較一下coroutine與thread的差別:
* thread的切換後暫停是靠context switch實現的,當然process也是,不過process context switch的成本又比thread更高,因為thread共用process的大量資源(相同address space),所以需要儲存的資料較少;而coroutine是沒有context switch的,所以理論上切換成本會最低。
* thread_create是有成本的,應該說再POSIX THREAD的實作下,這個成本應該是比coroutine還要來的大,這可以設計實驗(待續)
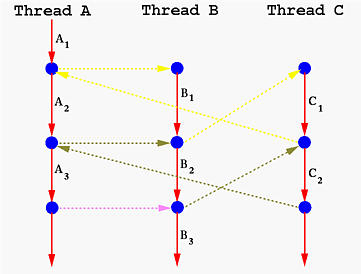
上面這張圖寫著thread拿來講coroutine實在讓人不舒服,但卻有表達出其意。
Knuth's coroutines:
Knuth是偉大的電腦科學家,在Coroutines in C一文中提到,他提出的coroutine是一個拿掉了stack觀念的作法,且routine間不再有caller與callee的關係,是透過jump與儲存PC的方式實現;但作者提到這只能在assembl的層級實現,再Unix like的系統上實現並不實際。
Stack-based coroutines:
正因如此,以C語言的情況,必定有一者為caller,另一者為callee,直接舉例:在此我們希望能夠收到0~9的回傳值,很明顯下方的程式無法辦到這點。
```clike=
int function(void) {
int i;
for (i = 0; i < 10; i++)
return i; /* won't work, but wouldn't it be nice */
}
```
所以在Coroutines in C中使用到goto與label這種接近assembly寫法的方式實現,這段程式碼很明顯沒有善用C語言的特性,使用了switch又用goto,而且應該會在i==10時出現問題。
```clike=
int function(void) {
static int i, state = 0;
switch (state) {
case 0: goto LABEL0;
case 1: goto LABEL1;
}
LABEL0: /* start of function */
for (i = 0; i < 10; i++) {
state = 1; /* so we will come back to LABEL1 */
return i;
LABEL1:; /* resume control straight after the return */
}
}
```
>本來想說會出現問題停掉,結果發現這段程式根本不會停,將asm倒出來看看。[name=劉亮谷]
```asm=
cmpl $1, %eax
je .L10
jmp .L2
.L9:
nop
.L2:
movl $0, i.2286(%rip)
jmp .L6
.L8:
movl $1, state.2287(%rip)
movl i.2286(%rip), %eax
jmp .L1
.L10:
nop
.L5:
movl i.2286(%rip), %eax
addl $1, %eax
movl %eax, i.2286(%rip)
.L6:
movl i.2286(%rip), %eax
cmpl $9, %eax
jle .L8
.L1:
popq %rbp
.cfi_def_cfa 7, 8
ret
.cfi_endproc
```
Duff's device:
```clike=
switch (count % 8) {
case 0: do { *to = *from++;
case 7: *to = *from++;
case 6: *to = *from++;
case 5: *to = *from++;
case 4: *to = *from++;
case 3: *to = *from++;
case 2: *to = *from++;
case 1: *to = *from++;
} while ((count -= 8) > 0);
}
```
## SuperMalloc
## mmap
在linux下使用mmap實在是相當方便,看到linux manual,除了解決memory management 的問題外,還因為是VMA,所以使用fd讀寫時已經確保過image segamentation正確,這如果是在FreeRTOS上就會是相當大的工程。
`void *mmap(void *addr, size_t length, int prot, int flags,int fd, off_t offset);`
`int munmap(void *addr, size_t length);`
所以在append時,下方第12行不需要再做malloc的動作,因為已經使用過mmap獲取空間與紀錄尾端位址。
```clike=
append_a *new_append_a(char *ptr, char *eptr, int tid, int ntd,
entry *start)
{
append_a *app = (append_a *) malloc(sizeof(append_a));
app->ptr = ptr;
app->eptr = eptr;
app->tid = tid;
app->nthread = ntd;
app->entryStart = start;
app->pHead = (app->pLast = app->entryStart);
return app;
}
```
說到append就想到在找mmap末端時,`main`中使用`fsize()`取得檔案大小:
`off_t fs = fsize(ALIGN_FILE);`
這個fs取名取的過於簡略,影響閱讀,先換成fileOffset。
同樣的問題發生在append_a上,將其修改
```clike=
typedef struct _append_a {
char *ptr;
char *ptrEnd;
int threadId;
int threadNum;
entry *entryStart;
entry *pHead;
entry *pLast;
} append_a;
```
## Asynchronous
## Execution
**threadNUM= 4**
```
orig:
execution time of append() : 0.049369 sec
execution time of findName() : 0.006308 sec
opt:
size of entry : 24 bytes
execution time of append() : 0.004550 sec
execution time of findName() : 0.003804 sec
Performance counter stats for './phonebook_opt' (100 runs):
918,201 cache-misses # 53.284 % of all cache refs
2,158,402 cache-references
291,523,621 instructions # 1.31 insns per cycle
271,427,123 cycles
0.252327449 seconds time elapsed ( +- 2.08% )
```

**threadNUM=2**
```
size of entry : 136 bytes
execution time of append() : 0.049411 sec
execution time of findName() : 0.005607 sec
size of entry : 24 bytes
execution time of append() : 0.004385 sec
execution time of findName() : 0.001574 sec
Performance counter stats for './phonebook_opt' (100 runs):
481,146 cache-misses # 54.327 % of all cache refs
803,873 cache-references
272,596,218 instructions # 1.47 insns per cycle
182,661,768 cycles
0.249541210 seconds time elapsed ( +- 1.79% )
```

**threadNUM=1**
```
size of entry : 136 bytes
execution time of append() : 0.050384 sec
execution time of findName() : 0.005666 sec
size of entry : 24 bytes
execution time of append() : 0.006198 sec
execution time of findName() : 0.003526 sec
```

執行後先來確認正確性,原先想寫個輸出append結果的function,結果發現header中已經有了`show_entry()`,就直接拿來加寫檔功能。
輸出後先下`sort`在用`colordiff`來進行比較,結果如下:
```shell
$ sort new.txt >sort_new.txt
$ colordiff sort_new.txt dictionary/words.txt
0a1,4
> aaaa
> aaaaa
> aaaaaa
> aaaaaaa
```
看到結果會發現append少了前頭的4個elements,這是在thread=4的情況下。
那將thread=2來diff看看。
```shell=
$ sort new.txt >sort.txt
$ colordiff sort.txt dictionary/words.txt
0a1,2
> aaaa
> aaaaa
```
就只有前頭兩個elements缺少,看到這應該就可以知道是哪裡出錯。
一開始再trace code時,就覺得這邊有點不直覺,直接append上`pHead->pNext`,想說應該是某個地方有處理過head,看到diff結果就直接對此處進行改寫,直接append pHead。
```clike=
if (i == 0) {
pHead = app[i]->pHead->pNext;
dprintf("Connect %d head string %s %p\n", i,
app[i]->pHead->pNext->lastName, app[i]->ptr);
} else {
etmp->pNext = app[i]->pHead->pNext;
dprintf("Connect %d head string %s %p\n", i,
app[i]->pHead->pNext->lastName, app[i]->ptr);
```
在trace`debug.h`時發現有趣的東西
```clike=
#define eprintf(...) \
do { \
fprintf(stderr, "ERROR: "); fprintf(stderr, __VA_ARGS__); \
} while (0)
#else
```
這個 `do{}while(0)`我一開始不知道他的用途,就直接忽視,剛剛把他丟google後看到stackoverflow上有討論,覺得實在是太厲害的作法了,見識到真實世界的程式:
當在macro中有多個statement時,如下:
```clike=
#define FOO(x) foo(x); bar(x)
if (condition)
FOO(x);
else // syntax error here
...;
```
注意上方bar()後方分號,如果改寫成下方形式,FOO後方就不能有分號,這都跟平常的C語言格式有所衝突:
```clike=
#define FOO(x) { foo(x); bar(x); }
if (condition)
FOO(x)
else
...
```
所以才使用do{}while(0)改寫成:
```clike=
#define FOO(x) do { foo(x); bar(x); } while (0)
if (condition)
FOO(x);
else
....
```
`pthread_setconcurrency(THREAD_NUM + 1);`
然後來討論thread的使用:
這邊的`join`會使得所有的thread在等待最慢的一個thread,附上manu
The pthread_join() function waits for the thread specified by thread to terminate. If that thread has already terminated, then pthread_join() returns immediately. The thread specified by thread must be joinable.
```clike=
clock_gettime(CLOCK_REALTIME, &mid);
for (int i = 0; i < THREAD_NUM; i++)
pthread_create( &tid[i], NULL, (void *) &append, (void *) app[i]);
for (int i = 0; i < THREAD_NUM; i++)
pthread_join(tid[i], NULL);
```
所以改成thread pool:使用threadpool-mbrossard
結果:

```shell
Performance counter stats for './phonebook_opt' (100 runs):
793,725 cache-misses # 45.454 % of all cache refs
1,806,443 cache-references
290,825,345 instructions # 1.33 insns per cycle
220,308,926 cycles
0.244764659 seconds time elapsed ( +- 2.04% )
```
很明顯效能沒有改進,思考原因~
在找原因時覺得append中的i,j可讀性也很差,
改寫`new append`與`append`
```shell=
Performance counter stats for './phonebook_opt' (100 runs):
437,951 cache-misses # 66.591 % of all cache refs
628,081 cache-references
304,163,942 instructions # 1.58 insns per cycle
187,373,621 cycles
0.249370244 seconds time elapsed ( +- 2.35% )
```
將`append`拆成row major與col major,對`append`而言,row major比較快,可是col major的cache miss 卻比較少。

```
Performance counter stats for './phonebook_opt_row' (100 runs):
420,299 cache-misses # 62.773 % of all cache refs
707,135 cache-references
305,033,514 instructions # 1.58 insns per cycle
208,815,659 cycles
0.247210751 seconds time elapsed ( +- 2.32% )
Performance counter stats for './phonebook_opt_col' (100 runs):
907,305 cache-misses # 49.503 % of all cache refs
1,813,183 cache-references
291,582,947 instructions # 1.29 insns per cycle
221,915,978 cycles
0.248214764 seconds time elapsed ( +- 1.20% )
```
## Reference
* [Locks, Mutexes, and Semaphores: Types of Synchronization Objects](https://www.justsoftwaresolutions.co.uk/threading/locks-mutexes-semaphores.html)
* [An Introduction to Lock-Free Programming](http://preshing.com/20120612/an-introduction-to-lock-free-programming/)
* [MMAP(2) Linux Programmer's Manual ](http://man7.org/linux/man-pages/man2/mmap.2.html)
* [do { … } while (0) — what is it good for? [duplicate]](http://stackoverflow.com/questions/257418/do-while-0-what-is-it-good-for)
 Sign in with Wallet
Connect another wallet
Sign in with Wallet
Connect another wallet