# Programming Small
###### tags: `sysprog`
:::info
主講人: [jserv](http://wiki.csie.ncku.edu.tw/User/jserv) / 課程討論區: [2017 年系統軟體課程](https://www.facebook.com/groups/system.software2017/)
:mega: 返回「[嵌入式作業系統設計與實作](http://wiki.csie.ncku.edu.tw/sysprog/schedule)」課程進度表
:::
## 在小處下功夫,不放棄整體改善的機會
* [快速計算和表達圓周率](http://chamberplus.myweb.hinet.net/ems_2.htm)
* [解說](http://godspeedlee.myweb.hinet.net/trick.html)
* [字串反轉](http://godspeedlee.myweb.hinet.net/c_str/c_str.htm)
* 為什麼 C 語言沒有內建 swap 機制?
* 很難作出通用且有效率的 swap 方式
* [Swapping in C, C++, and Java](http://www.cs.utsa.edu/~wagner/CS2213/swap/swap.html)
## 最佳化來自對系統的認知
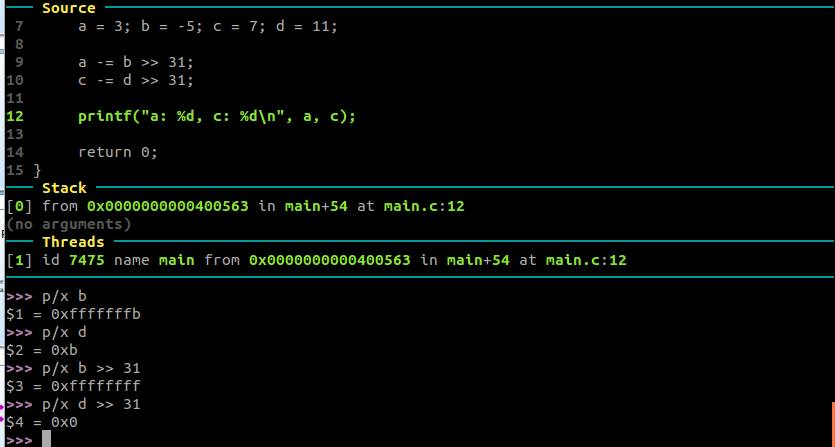
假設我們有兩個「有號整數」:
```clike
#include<stdint.h>
int32_t a, b;
```
原本涉及到分支的陳述:
```clike
if (b < 0) a++;
```
可更換為沒有分支的版本:
```clike
a -= b >> 31;
```
為什麼呢?一旦 b 右移 31 個 bit,在右移 `>>` 時在前面補上 sign bit ,所以移完會是 0xffff 也就是-1,故結果會是 `a -= -1`,即 `a++`,於是,原本為負數的值就變成 1 ,而原本正數的值就變成 0,又因為原本的行為是有條件的 a++,如此就是數值操作,沒有任何分支指令。
* [superscalar](https://en.wikipedia.org/wiki/Superscalar_processor)
## 案例分析: Phone Book
目的:分析電話簿搜尋程式,探討 cache miss 對於整體效能有顯著影響
**題目說明**
思考以下程式碼可能存在的問題,並著手改善效能。
Hint: cache miss
```C=
#define MAX_LAST_NAME_SIZE 16
typedef struct __PHONE_BOOK_ENTRY {
char LastName[MAX_LAST_NAME_SIZE];
char FirstName[16];
char email[16];
char phone[10];
char cell[10];
char addr1[16];
char addr2[16];
char city[16];
char state[2];
char zip[5];
struct __PHONE_BOOK_ENTRY *pNext;
} PhoneBook;
PhoneBook *FindName(char Last[], PhoneBook *pHead) {
while (pHead != NULL) {
if (stricmp(Last, pHead->LastName) == 0)
return pHead;
pHead = pHead->pNext;
}
return NULL;
}
```
* L1 Cache : 32KB = 32*1024,PhoneBook size = 136 bytes,32*1024 / (136*8) = 30.12 (只能存 30 筆左右)
* 是否可最佳化成 32*1024 / (32*8) = 128 筆? 或使用 collision 較少的 hash function?
**未優化版本**
程式碼: [phonebook](https://github.com/embedded2015/phonebook)
**測試檔:**
GitHub上有提供兩種字典檔當輸入 data set,以下測試使用**第二種**。
1. 男生 + 女生英文名字的攻擊(attack)字典檔。約 16,750 個。
2. 英文單字表,約 350,000 個 (sorted)
`$ perf stat -r 10 -e cache-misses,cache-references,L1-dcache-load-misses,L1-dcache-store-misses,L1-dcache-prefetch-misses,L1-icache-load-misses ./main_origin`
```shell
size of entry : 136 bytes
uninvolved is found!
zyxel is found!
whiteshank is found!
odontomous is found!
pungoteague is found!
reweighted is found!
xiphisternal is found!
yakattalo is found!
execution time of append() : 0.053549
execution time of findName() : 0.050462
Performance counter stats for ’./main_origin’ (10 runs):
3,519,048 cache-misses # 96.963 % of all cache refs ( +-1.61% ) [65.55%]
3,629,269 cache-references ( +-1.29% ) [67.73%]
4,185,434 L1-dcache-load-misses ( +-1.10% ) [69.53%]
1,005,501 L1-dcache-store-misses ( +-0.77% ) [70.04%]
3,088,038 L1-dcache-prefetch-misses ( +-1.61% ) [66.24%]
139,497 L1-icache-load-misses ( +-6.17% ) [63.29%]
0.107159363 seconds time elapsed ( +-0.92% )
```
`$ perf record -F 12500 -e cache-misses ./main_origin && perf report`
```shell
62.36% main_origin libc-2.19.so [.] __strcasecmp_l_avx
16.31% main_origin [kernel.kallsyms] [k] clear_page_c_e
12.87% main_origin main_origin [.] findName
4.54% main_origin [kernel.kallsyms] [k] mem_cgroup_try_charge
0.60% main_origin libc-2.19.so [.] __strcasecmp_avx
0.57% main_origin [kernel.kallsyms] [k] copy_user_enhanced_fast_string
```
**優化版本**
程式碼:[embedded-summer2015/phonebook](https://github.com/charles620016/embedded-summer2015/tree/master/phonebook) (Github)
我的筆電 level 1 cache 有 32 kbit,struct 的大小有 136 bytes,32 * 1024 / (136*8) =30.12,若把整個 __PHONE_BOOK_ENTRY 的 struct 都丟進 findName() 尋找,即使未考慮電腦中其他正在運行的程式,我的 level 1 cache 最多也只能放 30 個entry,一共有 35 萬個單字,必定會發生頻繁的 cache miss。
查看電腦 cache 大小 `$ lscpu | grep cache`
```shell
L1d cache: 32K
L1i cache: 32K
L2 cache: 256K
L3 cache: 3072K
```
**第一種優化方式:使用體積較小的 struct**
根據題目要求,我們只需要知道「有沒有找到 last name」,對於 email、phone number、address、zip 等等資訊是可以在搜尋過程中忽略不看。另外我又希望能不改變原本 phonebook entry 的結構,所以我另
外設計一個 struct 只儲存 last name,並用一個指向 phonebook entry 的指標叫 *detail 來儲存詳細資訊,新的 struct 大小只有 32 bytes,這樣搜尋的過程中,cache 就可以塞進 (32 * 1024) / (32*8) = 128 個單字,增加 cache hit 的機率。
在實作 appendOptimal() 的過程中,*detail 並沒有沒指向一塊空間,我想專心讓 appendOptimal() 產生含有 lastName 的節點就好。為什麼呢?因為若在 append 過程中 malloc() 空間給 *detail,會增加很多 cache miss,嚴重影響到效能表現,經過實測,總體效能甚至比原始版本還差一點。目前想法是將 *detail 的 assign (當有需要時)交給另外一個 function 處理,畢竟我們一開始只有 last name 的資訊。
```clike=
typedef struct __LAST_NAME_ENTRY{
char lastName[MAX_LAST_NAME_SIZE];
entry *detail;
struct __LAST_NAME_ENTRY *pNext;
} lastNameEntry;
```
`$ perf stat -r 10 -e cache-misses,cache-references,L1-dcache-load-misses,L1-dcache-store-misses,L1-dcache-prefetch-misses,L1-icache-load-misses ./main_optimal`
```shell
size of entry : 32 bytes
uninvolved is found!
zyxel is found!
whiteshank is found!
odontomous is found!
pungoteague is found!
reweighted is found!
xiphisternal is found!
yakattalo is found!
execution time of appendOptimal() : 0.044819
execution time of findNameOptimal() : 0.023803
```
```shell
Performance counter stats for ’./main_optimal’ (10 runs):
486,127 cache-misses # 60.472 % of all cache refs ( +- 0.74% ) [65.67%]
803,882 cache-references ( +- 0.37% ) [65.65%]
2,531,398 L1-dcache-load-misses ( +- 1.51% ) [66.70%]
329,753 L1-dcache-store-misses ( +- 1.70% ) [68.36%]
1,642,925 L1-dcache-prefetch-misses ( +- 2.18% ) [69.27%]
100,133 L1-icache-load-misses ( +- 6.45% ) [67.15%]
0.071458929 seconds time elapsed ( +- 0.84% )
```
`$ perf record -F 12500 -e cache-misses ./main_optimal && perf report`
```shell
36.16% main_optimal [kernel.kallsyms] [k] clear_page_c_e
29.01% main_optimal libc-2.19.so [.] __strcasecmp_l_avx
10.71% main_optimal [kernel.kallsyms] [k] mem_cgroup_try_charge
7.20% main_optimal main_optimal [.] findNameOptimal
4.04% main_optimal [kernel.kallsyms] [k] copy_user_enhanced_fast_string
2.07% main_optimal libc-2.19.so [.] __strcasecmp_avx
1.17% main_optimal [kernel.kallsyms] [k] __rmqueue
```
**第二種優化方式:使用 hash function**
第一種方式已經見到不錯的效能成長了!findName() 的 CPU time 從 `0.050462` 變成`0.023803`,進步一倍以上。另外 cache miss 的次數從 `3,519,048`降到 `486,127`!
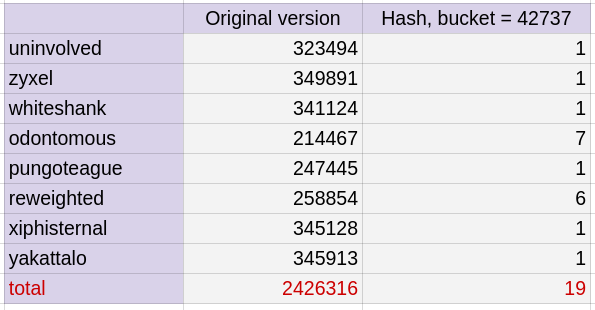
不過 35 萬個單字量畢竟還是太大,如果利用字串當作key,對 hash table 作搜尋顯然比每次從頭開始查找快多了。所以接下來的問題就是,如何選擇 hash function?如何減少碰撞發生呢?我選了兩種 hash function。不過以下先用 hash2() 和上面的結果作比較。另外 table size 我使用 42737,挑選的原因是因為有約35萬個英文單字,為了減少碰撞機會,挑了一了蠻大的「質數」。
`$ perf stat -r 10 -e cache-misses,cache-references,L1-dcache-load-misses,L1-dcache-store-misses,L1-dcache-prefetch-misses,L1-icache-load-misses ./main_hash`
```shell
hash table size (prime number) : 42737
size of entry : 32 bytes
uninvolved is found!
zyxel is found!
whiteshank is found!
odontomous is found!
pungoteague is found!
reweighted is found!
xiphisternal is found!
yakattalo is found!
execution time of appendHash() : 0.059560
execution time of findNameHash() :0.000173
Performance counter stats for ’./main_hash’ (10 runs):
367,138 cache-misses #60.950 % of all cache refs ( +- 1.78% ) [61.51%]
602,362 cache-references ( +- 1.62% ) [66.17%]
887,342 L1-dcache-load-misses ( +- 1.20% ) [71.61%]
694,774 L1-dcache-store-misses ( +- 0.92% ) [73.62%]
77,931 L1-dcache-prefetch-misses ( +- 2.12% ) [68.81%]
110,773 L1-icache-load-misses ( +- 8.71% ) [62.00%]
0.061427658 seconds time elapsed ( +- 1.46% )
```
`$ perf record -F 12500 -e cache-misses ./main_hash && perf report`
```shell
48.01% main_hash [kernel.kallsyms] [k] clear_page_c_e
13.66% main_hash libc-2.19.so [.] _IO_getline_info
12.53% main_hash [kernel.kallsyms] [k] mem_cgroup_try_charge
6.35% main_hash [kernel.kallsyms] [k] copy_user_enhanced_fast_string
1.66% main_hash libc-2.19.so [.] __memcpy_sse2
1.50% main_hash [kernel.kallsyms] [k] __rmqueue
1.36% main_hash libc-2.19.so [.] memchr
1.33% main_hash [kernel.kallsyms] [k] alloc_pages_vma
1.20% main_hash main_hash [.] appendHash
0.97% main_hash [kernel.kallsyms] [k] __alloc_pages_nodemask
```
**執行時間分析**
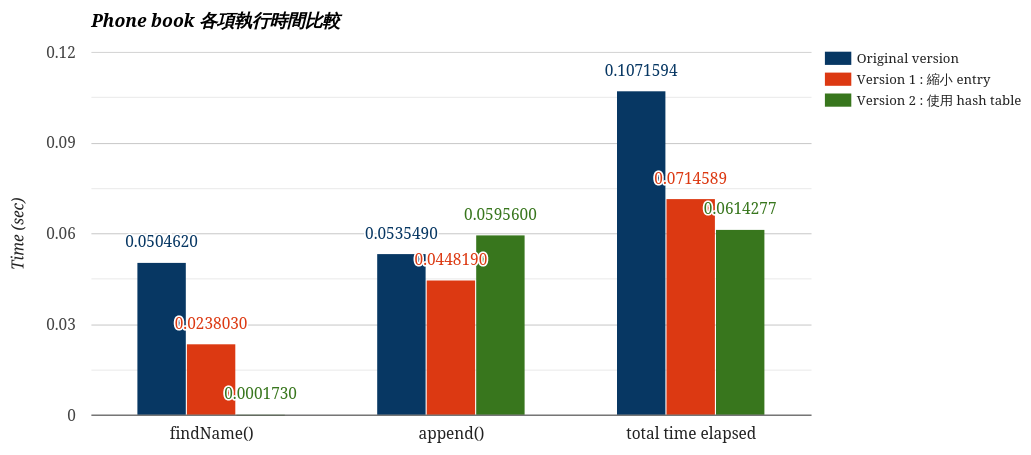
* findName():本次測試需要查找 **8** 個 last name,兩種優化版本顯然都比原始的還要好,hash 版本不用每次從 35 萬個單字的頭開始找起省掉許多時間,而且再配上縮小過後的 entry,所以 L1 cache 可以塞進更多的 last name,兩種優化方式一加乘,查找時間比原始快了近 300 倍!
* append():先來比較 原始版本 和 第一個版本,在 append() 的算法上這兩者幾乎一模一樣唯一的差別就是 malloc() 的記憶體空間不一樣大。
```clike=
// entry *append(char lastName[], entry *e)
e->pNext = (entry *) malloc(sizeof(entry)); // 136 bytes
// lastNameEntry *appendOptimal(char lastName[], lastNameEntry *lne)
lne->pNext = (lastNameEntry *) malloc(sizeof(lastNameEntry)); // 32 bytes
```
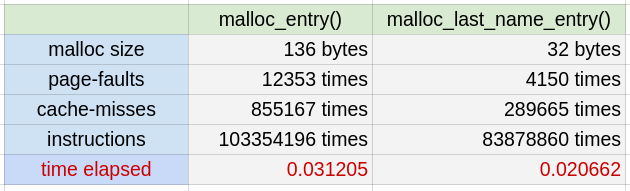
* 寫個獨立程式來產生 350,000 個 entry,測試這兩者的 page-faults,cache-misses,結果如下。兩者時間相差約 0.0105 sec,和上面 0.00873 sec 差距不大。要動態分配一個大的記憶體空間,它可能產生的效能損失是可觀的。所以如果已知記憶體需求,儘量一開始就分配大塊一點的空間,就如同開學考那題 malloc 2D array 一樣。
* 最後,同樣都是分配 32 bytes 大小的 entry,hash 版本的 append() 時間,比起第一種版本還多了 0.01474 秒,這是可預期的, 因為為了將 last name 放到對應 bucket,還需要多一步 hash 運算。
**cache miss 情形**
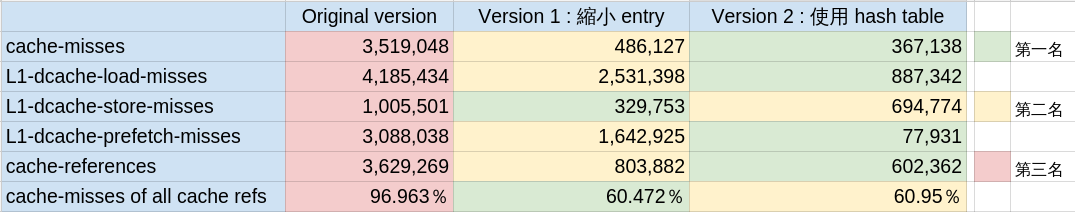
perf 能偵測的 cache miss 種類非常多,基本上分為 load-miss、store-miss、prefetch-miss 三種,而再根據 cache 種類又分 Level 1 cache 和 Last Level cache,instruction cache 和 data cache,[TLB](https://en.wikipedia.org/wiki/Translation_lookaside_buffer) cache。
我們最關心的是`L1-dcache-load-misses`,也就是要尋找的 data 不在 Level 1 cache,要往更下層的 memory (我的電腦有 L2、L3)。經過縮小 entry後,version 1 的`L1-dcache-load-misses`減少了 0.4 倍,而 hash 版本則因為查找的數量從 242.6 萬次降到不到 20 次,如下表。進而讓 cache miss 再更減少了近 0.8 倍!不過當然這樣的成果要歸功於一開始辛苦建立 Hash table。
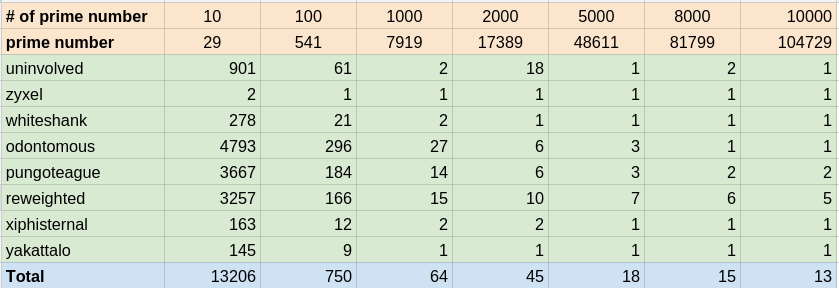
**不同 Table size 對效能的影響**
Hash function 裡常會對字串作很多次的加法或乘法,以這邊 hash2() 來說除了加法還有乘32,如果我取的不是質數,剛好是某些數字的倍數,譬如 2 或 3 等等,mod 之後就會很容易往某個幾個 bucket 集中,若很不巧我找的字剛好在這幾的 bucket 裡,平均來講效能就不好了,list會很長,所以 table size 我會選用質數。
另外一件事情是, Table size 使用 42737,選用這麼大的數字的考量在 data set 有 35 萬個,size 越大的話,每個 bucket 的 linked list 才不會太長,findName() 起來才會快。
就前面結果我們已經知道 hash 版本速度很快,cache miss 也很低。剩下能主導效能就是查找次數了,以下列出幾個 size 的結果。而當 Table size 大於 7919 時,其查找的次數差異已經非常小了。
**不同的 hash function 對效能的影響**
hash2() 是有名的 [djb2](http://www.cse.yorku.ca/~oz/hash.html),兩者差別是 `hashVal << 5` ,也就是 hashVal * 32的意思。ASCII 字元的數值最大為 127 的整數,不管是人名還是英文單字當作輸入,平均鍵值長度大約 6~10,所以 hashVal 最多也只有 1270 種可能,**不是一個均勻分佈,而在效能表現上可能就有很大的差異**。
```clike=
hashIndex hash1(char *key, hashTable *ht)
{
unsigned int hashVal = 0;
while(*key != ’\0’) {
hashVal+= *key++;
}
return hashVal % ht->tableSize;
}
hashIndex hash2(char *key, hashTable *ht)
{
unsigned int hashVal = 0;
while(*key != ’\0’){
hashVal = (hashVal << 5) + *key++;
}
return hashVal % ht->tableSize;
}
```
`$ ./main_hash ` with hash1()
```shell=
hash table size (prime number) : 42737
uninvolved is found! n = 60
zyxel is found! n = 1
whiteshank is found! n = 12
odontomous is found! n = 143
pungoteague is found! n = 192
reweighted is found! n = 133
xiphisternal is found! n = 3
yakattalo is found! n = 8
```
==> 共 552 次
`$ ./main_hash `with hash2()
```txt=
hash table size (prime number) : 42737
size of entry : 32 bytes
uninvolved is found! n = 1
zyxel is found! n = 1
whiteshank is found! n = 1
odontomous is found! n = 7
pungoteague is found! n = 1
reweighted is found! n = 6
xiphisternal is found! n = 1
yakattalo is found! n = 1
```
==> 共 19 次
Jakub Jelinek 針對不同的 hash function 所作的[分析](http://sourceware.org/ml/binutils/2006-06/msg00424.html):
```
The number of collisions in the 537403 symbols is:
name 2sym collision # 3sym collision # more than 3sym collision #
sysv 1749 5
libiberty 42
dcache 37
djb2 29
sdbm 39
djb3 31
rot 337 39 61
sax 34
fnv 40
oat 30
```
* 應用於 [GNU Hash ELF Sections](https://blogs.oracle.com/ali/entry/gnu_hash_elf_sections),加速動態函式庫的載入時間
* 延伸閱讀: [Optimizing Linker Load Times](https://lwn.net/Articles/192624/)
* 完整的[測試程式 phonebook](http://wiki.csie.ncku.edu.tw/embedded/2016q1h1)
## Cache 背景知識
### 為什麼需要 cache?
電腦發展早期,主記憶體 (main memory) 的速度緩慢且昂貴,CPU 的時脈也不高,但從 1980 年代開始,main memory 和 CPU 的差距急速拉大,主記憶體存取速度雖然時有提升,卻仍不及 CPU 的進展,因此需要 cache 來彌補因為兩者間速度落差帶來的效能衝擊。

* 原理:cache利用**Temporal Locality**和**Spatial Locality**設計記憶體架構的兩大原則
* 延伸閱讀: [Optimizing the data cache performance ](https://www.cs.umd.edu/class/fall2001/cmsc411/proj01/cache/matrix.html)
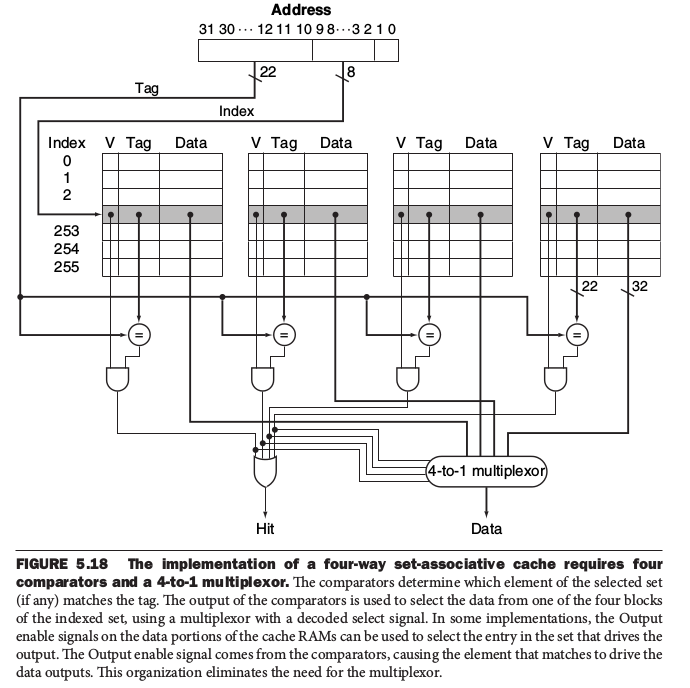
* set associative:set associative的方式,也就是把cache分成多個set,CPU必須檢查指定set內的每個block是否有可用的cache。最極端的情況下就是Fully Associative,也就是CPU要檢查cache內所有的block。
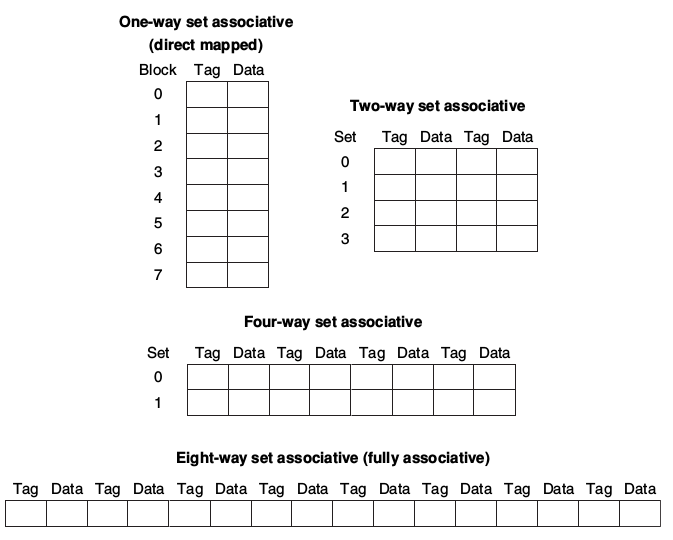
* 實作多個four-way set的方式
更多內容如下:
* 資料來源:[](http://enginechang.logdown.com/tags/cache)[http://enginechang.logdown.com/tags/cache](http://enginechang.logdown.com/tags/cache)
* [](http://www.cs.iit.edu/~virgil/cs470/Book/chapter9.pdf)[http://www.cs.iit.edu/~virgil/cs470/Book/chapter9.pdf](http://www.cs.iit.edu/~virgil/cs470/Book/chapter9.pdf)
* [](http://www.mouseos.com/arch/cache.html)[http://www.mouseos.com/arch/cache.html](http://www.mouseos.com/arch/cache.html)
* 修改 Makefile,在 CFLAGS 加上 `-DNDEBUG`,降低 assert() 帶來的影響,重新編譯、執行,再用 perf 分析效能
## Hash Function
```C=
unsigned int hash(hash_table *hashtable , char *str)
{
unsigned int hash_value = 0;
while(*str)
hash_value = (hash_value << 5) - hash_value + (*str++);
return (hash_value % SIZE);
}
```
2^n^ - 1 = X << n - X
**BKDR hash function**
* 特色:計算過程中有seed參與,seed為31 131 1313....
* 出處: 「The C Programming Language"Brian W. Kernighan, Dennis M. Ritchie的 Table Lookup章節
```clike=
unsigned int BKDRHash(char *str)
{
unsigned int seed = 131;
// 31 131 1313 13131 131313 etc..
unsigned int hash = 0;
while (*str) {
hash = hash * seed + (*str++);
}
return hash;
}
```
* 為甚麼要乘上一個係數(seed)?
* 若只單純使用各字母的ASCII相加得到hash值,碰撞率很高
* 例如: a(97) + d(100) = b(98) + c(99)
* 所以可以再乘上一個係數,讓hash值差距更大
* 為什麼係數(seed)要取 31 131 1313 13131....?
* 把係數分為三種探討: 偶數(2的次方)、偶數(非2的次方)、奇數
* 偶數(2的次方): 取seed=32
* 兩字串:abhijklmn abchijklmn(後者多一個c) 分別帶入上面程式碼,結果為:
- abhijklmn = 3637984782
- abchijklmn = 3637984782
* 兩字串的hash值一模一樣,且把其中一個字串加長為abcdehijklmn,hash值仍沒有改變,為何?
* 計算時若 overflow 變會拋棄最高位,在 `hijklmn` 的前面加上多長的字串,其值仍為 `3637984782`
* 偶數 (非二的次方)
* 可推論其在使用上結果應與上例相同,當結果 overflow 時,就會捨棄最高位,兩字串的 hash 值會相同
* 奇數: 取 seed=31
* 31 = 2^5^-1,即使字串長到會 overflow,但後面的 -1 仍會影響到整體的 hash 值