# 2016 homework 1 Phonebook
## 開發環境
我是用ubuntu15.04 LTS 電腦架構如下:
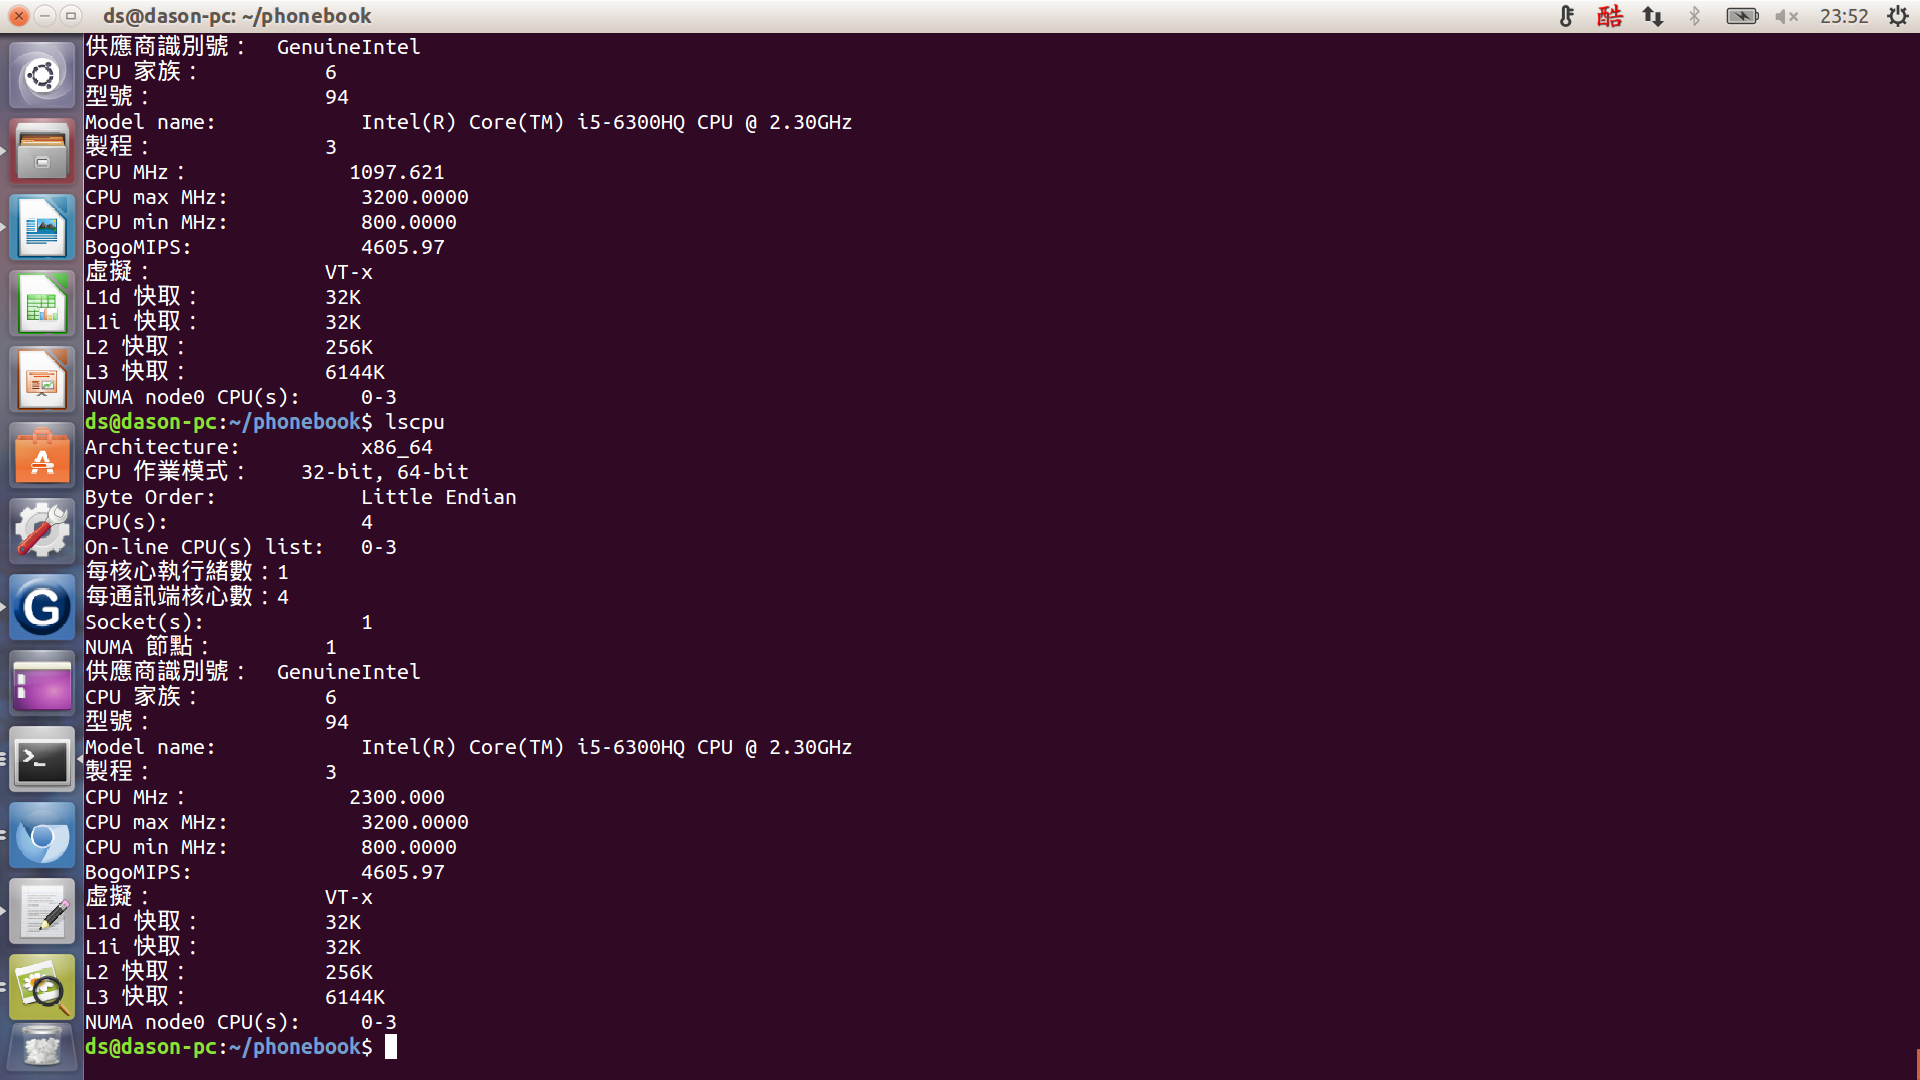
L1 cache 32K
L2 cache 256K
## Git & GitHub
* 首先在網頁上fork老師的phonebook,然後用:
* `$ git clone your git url_ ` _//譬如:git clone [](https://github.com/workfunction/phonebook.git)[https://github.com/workfunction/phonebook.git](https://github.com/workfunction/phonebook.git)
* 先clone下來你自己的repository到你的電腦裏面,之後開始修改你要修改的檔案
* 接下來要對每個修改過的檔案用:
* `$ git add file you edit ` //譬如: git add phonebook_opt.c 或是用:git add . 提交全部的檔案進索引
* 這一步就是在把檔案註冊至索引中。
* 接著提交修改版本到git中(這裡都是在本地電腦裏面clone下來的repository做修改)用:
* `$ git commit -m "your change log title" ` //譬如: git commit -m "1st opt"
* 這樣一來你就在電腦裡做好一個修訂版本囉!
* 注意一點如果打了上面的跳出:
```
* On branch master
* Your branch is up-to-date with ’origin/master’.
* Changes not staged for commit:
* modified: main.c
* modified: phonebook_opt.c
* modified: phonebook_opt.h
* no changes added to commit
```
* 代表他列的那些檔案被修改過可是你忘記add囉,所以就在把他列的檔案add進去吧!
* 最後就是上傳回去GitHub啦,用下面指令:
* $ git push origin master
* 這樣就可以把你電腦裏面的修訂版本放到GitHub裏面了喔!
* push前記得先做astyle再add喔!!`astyle --style=kr --indent=spaces=4 --indent-switches --suffix=none *.[ch]`
* 老師說要避免使用 git commit -m,而直接用 `git commit -a`,然後把 git commit messages 寫好~
## Makefile
```cmake=
target:
~~~~rule
target2:
~~~~rule line 1; \
~~~~~~~~rule line 2
```
#### Targets and Prerequisites
```cmake=
target: prereq1 prereq2
commands
```
1\. `?=` 是一個簡化的語法:若變數未定義,則替它指定新的值。否則,採用原有的值
2.` +=` 語法CFLAGS = -Wall -g CFLAGS += -O2 此時 CFLAGS 的值就變成 -Wall -g -O2 了
3.若該項目並非檔案,則為 fake 項目。如此一來將不會建立 target 檔案。但為了避免 make 有時會無去判斷 target 是否為檔案或 fake 項目,建議利用 .PHONY 來指定該項目為 fake 項目。例:
```
* .PHONY: clean
* clean:
* rm *.o
```
在上例中,若不使用 .PHONY 來指定 clean 為 fake 項目的話,若目錄中同時存在了一個名為 clean 的檔案,則 clean 這個項目將被視為**要建立 clean 這個檔案**,但 clean 這個項目卻又沒有任何的 dependencies,也因此,clean 項目將永遠被視為 up-to-date,**永遠不會被執行**。
因為利用了 .PHONY 來指定 clean 為 fake 項目,所以 make 不會去檢查目錄中是否存在了一個名為 clean 的檔案。如此也可以提昇 make 的執行效率。
4.特別字元:
@:不要**顯示**執行的指令。
-:表示即使該行指令出錯,也不會中斷執行。
5.內部變數:
`$?`:代表已被更新的 dependencies 的值,就是 dependencies 中,比 targets 還新的值。
`$@`:代表 targets 的值
`$<`:代表第一個 dependencies 的值。
`$*` :代表 targets 所指定的檔案,但不包含副檔名。
`$^` :代表規則中所有相關的檔名,The names of all the prerequisites
```
* CC ?= gcc
* CFLAGS_common ?= -Wall -std=gnu99 -g
* CFLAGS_orig = -O0
* CFLAGS_opt = -O0
* EXEC = phonebook_orig phonebook_opt phonebook_hash
* all: $(EXEC)
* SRCS_common = main.c
* phonebook_orig: $(SRCS_common) phonebook_orig.c phonebook_orig.h
* $(CC) $(CFLAGS_common) $(CFLAGS_orig) \
* -DIMPL="\"$@.h\"" -o $@ \
* $(SRCS_common) $@.c
* phonebook_opt: $(SRCS_common) phonebook_opt.c phonebook_opt.h
* $(CC) $(CFLAGS_common) $(CFLAGS_opt) \
* -DIMPL="\"$@.h\"" -o $@ \
* -DOPT=1\
* $(SRCS_common) $@.c
````
* -D 後面設定macro. 以phonebook 的makefile為例, (-D 是gcc 的option).
* -DIMPL="\"$@.h\"" 會設定IMPL 為"\"phonebook_orig.h\""
* 這裡定義的macro 等同於在source code 中的 [#define](https://embedded2016.hackpad.com/ep/search/?q=%23define&via=DS2HMWxjXky) xx
* 可用 gcc -E 觀察輸出
關於assert 參考(http://linux.die.net/man/3/assert)
* 不需要移除,只要變更編譯參數即可,請見 `man assert(http://linux.die.net/man/3/assert)`
* 在Makefile中新增: CFLAGS_common ?= -Wall -std=gnu99 -DNDEBUG
清空cache
其中有1 , 2 , 3三個值能修改
* `echo 3 > /proc/sys/vm/drop_caches`
-釋放pagecache、dentries與inodes,也就是釋放所有的cache
* `echo 2 > /proc/sys/vm/drop_caches`
-釋放dentries與inodes
* `echo 1 > /proc/sys/vm/drop_caches`
* -釋放pagecache
接下來這裡有點奇怪 make run時有先清空cache,不過當make plot時卻沒有`echo 3 | sudo tee /proc/sys/vm/drop_caches` 這樣在執行時cache miss 不是就不準了嗎?@@
```
* run: $(EXEC)
* echo 3 | sudo tee /proc/sys/vm/drop_caches
* **watch** -d -t "./phonebook_orig && echo 3 | sudo tee /proc/sys/vm/drop_caches"
```
* //watch 這個指令預設是2秒,會去輸出後面給定的指令
```
* cache-test: $(EXEC)
* perf stat --repeat 100 \
* -e cache-misses,cache-references,instructions,cycles \
* ./phonebook_orig
* perf stat --repeat 100 \
* -e cache-misses,cache-references,instructions,cycles \
* ./phonebook_opt
* perf stat --repeat 100 \
* -e cache-misses,cache-references,instructions,cycles \
* ./phonebook_hash
* Performance counter stats for ’./phonebook_orig’ (100 runs):
* 5,729,901 cache-misses # 91.576 % of all cache refs
* 6,229,665 cache-references
* 322,355,316 instructions # 1.57 insns per cycle
* 204,877,372 cycles
* 0.069412000 seconds time elapsed ( +- 0.21% )
* Performance counter stats for ’./phonebook_opt’ (100 runs):
* 1,286,653 cache-misses # 64.048 % of all cache refs
* 2,062,259 cache-references
* 281,251,581 instructions # 2.35 insns per cycle
* 118,253,700 cycles
* 0.042995290 seconds time elapsed ( +- 5.16% )
* Performance counter stats for ’./phonebook_hash’ (100 runs):
* 1,533,017 cache-misses # 42.857 % of all cache refs
* 3,566,290 cache-references
* 278,984,877 instructions # 1.54 insns per cycle
* 180,660,117 cycles
* 0.061307312 seconds time elapsed ( +- 0.86% )
```
這次每個執行前都先清空cache 加入`echo 3 | sudo tee /proc/sys/vm/drop_caches`
```
* Performance counter stats for ’./phonebook_orig’ (100 runs):
* 5,619,307 cache-misses # 90.254 % of all cache refs
* 6,146,948 cache-references
* 322,041,533 instructions # 1.57 insns per cycle
* 202,699,556 cycles
* 0.069857174 seconds time elapsed ( +- 0.70% )
* Performance counter stats for ’./phonebook_opt’ (100 runs):
* 1,205,436 cache-misses # 59.680 % of all cache refs
* 1,986,346 cache-references
* 281,165,328 instructions # 2.35 insns per cycle
* 118,036,954 cycles
* 0.041230124 seconds time elapsed ( +- 0.95% )
* Performance counter stats for ’./phonebook_hash’ (100 runs):
* 1,502,643 cache-misses # 42.097 % of all cache refs
* 3,596,799 cache-references
* 277,942,427 instructions # 1.53 insns per cycle
* 180,447,629 cycles
* 0.061681775 seconds time elapsed ( +- 0.95% )
```
果然先清空cache後每個部份cache-miss都有下降大約好幾萬次~
<table style="color: rgb(0, 0, 0); font-family: Helvetica; letter-spacing: normal; line-height: normal; font-size: 13px;">
<tbody>
<tr>
<td class="added" style="border: 1px solid rgb(153, 153, 153); min-width: 50px; height: 22px; line-height: 16px; padding-right: 4px; padding-left: 4px;"></td>
<td class="added" style="border: 1px solid rgb(153, 153, 153); min-width: 50px; height: 22px; line-height: 16px; padding-right: 4px; padding-left: 4px;">沒清cache</td>
<td class="added" style="border: 1px solid rgb(153, 153, 153); min-width: 50px; height: 22px; line-height: 16px; padding-right: 4px; padding-left: 4px;">有清cache</td>
</tr>
<tr>
<td class="added" style="border: 1px solid rgb(153, 153, 153); min-width: 50px; height: 22px; line-height: 16px; padding-right: 4px; padding-left: 4px;">phonebook_orig</td>
<td class="added" style="border: 1px solid rgb(153, 153, 153); min-width: 50px; height: 22px; line-height: 16px; padding-right: 4px; padding-left: 4px;">5,729,901</td>
<td class="added" style="border: 1px solid rgb(153, 153, 153); min-width: 50px; height: 22px; line-height: 16px; padding-right: 4px; padding-left: 4px;">5,619,307</td>
</tr>
<tr>
<td class="added" style="border: 1px solid rgb(153, 153, 153); min-width: 50px; height: 22px; line-height: 16px; padding-right: 4px; padding-left: 4px;">phonebook_opt</td>
<td class="added" style="border: 1px solid rgb(153, 153, 153); min-width: 50px; height: 22px; line-height: 16px; padding-right: 4px; padding-left: 4px;">1,286,653</td>
<td class="added" style="border: 1px solid rgb(153, 153, 153); min-width: 50px; height: 22px; line-height: 16px; padding-right: 4px; padding-left: 4px;">1,205,436</td>
</tr>
<tr>
<td class="added" style="border: 1px solid rgb(153, 153, 153); min-width: 50px; height: 22px; line-height: 16px; padding-right: 4px; padding-left: 4px;">phonebook_hash</td>
<td class="added" style="border: 1px solid rgb(153, 153, 153); min-width: 50px; height: 22px; line-height: 16px; padding-right: 4px; padding-left: 4px;">1,533,017</td>
<td class="added" style="border: 1px solid rgb(153, 153, 153); min-width: 50px; height: 22px; line-height: 16px; padding-right: 4px; padding-left: 4px;">1,502,643</td>
</tr>
</tbody>
</table>
## 學習perf
[NCKU wiki](http://wiki.csie.ncku.edu.tw/embedded/perf-tutorial)
kernel.perf_event_paranoid 是用來決定你在沒有 root 權限下 (Normal User) 使用 perf 時,你可以取得哪些 event data。預設值是 1 ,你可以輸入
* `$ cat /proc/sys/kernel/perf_event_paranoid`
來查看權限值。一共有四種權限值:
* `2 `: 不允許任何量測。但部份用來查看或分析已存在的紀錄的指令仍可使用,如 perf ls、perf report、perf timechart、 perf trace。
* `1` : 不允許 CPU events data。但可以使用 perf stat、perf record 並取得 Kernel profiling data。
* `0` : 不允許 raw tracepoint access。但可以使用 perf stat、perf record 並取得 CPU events data。
* `-1`: 權限全開。
最後如果要檢測 cache miss event ,需要先取消 kernel pointer 的禁用。
* `$ sudo sh -c " echo 0 > /proc/sys/kernel/kptr_restrict"`
## Perf 基本使用
**<u>Perf 能觸發的事件分為三類:</u>**
* **hardware** : 由 PMU 產生的事件,比如 cache-misses、cpu-cycles、instructions、branch-misses …等等,通常是當需要瞭解程序對硬體特性的使用情況時會使用。
* **software** : 是核心程式產生的事件,比如 context-switches、page-faults、cpu-clock、cpu-migrations …等等。
* **tracepoint** : 是核心中的靜態 tracepoint 所觸發的事件,這些 tracepoint 用來判斷在程式執行時期,核心的行為細節,比如 slab 記憶體配置器的配置次數等。
**<u>perf 指令:</u>**
* `$ perf top `可以觀察是什麼程序吃掉系統效能,導致系統異常變慢。符號旁顯示**[.]**表示其位於 User mode,**[k]**則為 kernel mode。
* $ perf top -e cache-misses -c 5000 //-e表示所要查看的 event, -c 表示取樣頻率 預設每秒4000次
* `perf stat` 主要是已經有個要優化的目標,對這個目標進行特定或一系列的 event 檢查,進而了解該程序的效能概況。
* `$ perf stat --repeat 5 -e cache-misses,cache-references,instructions,cycles `
* `./perf_stat_cache_miss /--repeat <n>`或是-r <n> 可以重複執行 n 次該程序,並顯示每個 event 的變化區間。 cache-misses,cache-references和 instructions,cycles類似這種成對的 event,若同時出現 perf 會很貼心幫你計算比例
* usage: `perf stat [<options>] [<command>]`
* -e, --event <event> event selector. use ’perf list’ to list available events
* -i, --no-inherit child tasks do not inherit counters
* -p, --pid <n> stat events on existing process id
* -t, --tid <n> stat events on existing thread id
* -a, --all-cpus system-wide collection from all CPUs
* -c, --scale scale/normalize counters
* -v, --verbose be more verbose (show counter open errors, etc)
* -r, --repeat <n> repeat command and print average + stddev (max: 100)
* -n, --null null run - dont start any counters
* -B, --big-num print large numbers with thousands’ separators
**<u>範例測試:</u>**
```
static char array[10000][10000];
int main (void){
int i, j;
for (i = 0; i < 10000; i++)
for(j = 0; j < 10000; j++)
array[j][i]++;
return 0;
}
```
```
* Performance counter stats for ’./cache_miss_test’ (5 runs):
* 5,155,920 cache-misses # 2.112 % of all cache refs
* 243,761,851 cache-references
* 2,105,970,720 instructions # 2.02 insns per cycle
* 1,050,026,358 cycles
* 0.334916064 seconds time elapsed ( +- 1.17% )
```
如果我們利用cache存取的空間區域性(spatial locality),將array[j][i] 改成 array[i][j] 則效果如下:
```
* Performance counter stats for ’./cache_miss_test2’ (5 runs):
* 1,947,714 cache-misses # 37.618 % of all cache refs
* 5,249,712 cache-references
* 2,105,898,778 instructions # 2.60 insns per cycle
* 811,120,056 cycles
* 0.258861416 seconds time elapsed ( +- 0.83% )
```
cache-references從243,761,851 降到5,249,712 差了快50倍,時間也減少了0.08秒
**<u>先練習範例pi</u>**
* 查看pi這個程式那個部份消耗作多的cpu週期,執行./pi & sudo perf top -p $!,結果顯示compute_pi_baseline函式佔了程式99.78%
* 
**<u>看原本Orig的code:</u>**
**$./phonebook_orig & perf top -p $! **$!代表最後一個執行的程式
這樣可以讓程式執行並且讓perf可以取的程式的pid去追蹤熱點,不過這邊要輸入三次才會跑出來下面的結果,不知道為什麼?以下可以看到熱點都是在stracasecmp, findName,還有malloc函式

## phonebook 優化辦法
原本程式:
1.先把word.txt name 讀到每一個memory entry, 每個entry 用一個struct來建立,裡面有last name、first name、email..etc. 每個entry是用一個link list串起來
2.append()就是將last Name放入每個entry,每次新增一個entry就放在上一個entry後面
3.fineName()就是去搜尋
可能的效能改進方向:
* 改寫 struct __PHONE_BOOK_ENTRY 的成員,搬動到新的結構中
* 使用 hash function 來加速查詢
* 既然 first name, last name, address 都是合法的英文 (可假設成立),使用[字串壓縮的演算法](http://stackoverflow.com/questions/1138345/best-compression-algorithm-for-short-text-strings),降低資料表示的成本
* 使用 binary search tree 改寫演算法
* memory pool, work thread
## 優化方法一(縮小entry)
**未優化前:**
原本的struct entry 大小136 bytes, trace code可以發現都只有在找lastName,其他欄位沒用到。
```
* typedef struct __PHONE_BOOK_ENTRY {
* char lastName[MAX_LAST_NAME_SIZE];
* char firstName[16];
* char email[16];
* char phone[10];
* char cell[10];
* char addr1[16];
* char addr2[16];
* char city[16];
* char state[2];
* char zip[5];
* struct __PHONE_BOOK_ENTRY *pNext;
* } entry;
```
```
* size of entry : 136 bytes
* execution time of append() : 0.039642 sec
* execution time of findName() : 0.005316 sec
* Performance counter stats for ’./phonebook_orig’ (100 runs):
* 4,706,050 cache-misses # 94.734 % of all cache refs
* 4,979,890 cache-references
* 262,661,724 instructions # 1.49 insns per cycle
* 176,517,399 cycles
* 0.060470353 seconds time elapsed ( +- 0.32% )
```
**優化後:**
這邊採用的方法是讓struct entry size變小,讓更多的entry可以進到cache裡面增加cache-hit機率,原本的size為136 bytes,縮小後變為24 bytes,方法是將struct entry 內的其他欄位註解掉。
```
* typedef struct __PHONE_BOOK_ENTRY {
* char lastName[MAX_LAST_NAME_SIZE];
* /* char firstName[16];
* char email[16];
* char phone[10];
* char cell[10];
* char addr1[16];
* char addr2[16];
* char city[16];
* char state[2];
* char zip[5];*/
* struct __PHONE_BOOK_ENTRY *pNext;
* } entry;
```
```
* size of entry : 24 bytes
* execution time of append() : 0.031647 sec
* execution time of findName() : 0.002120 sec
* Performance counter stats for ’./phonebook_opt’ (100 runs):
* 1,045,759 cache-misses # 64.812 % of all cache refs
* 1,606,542 cache-references
* 240,996,877 instructions # 2.20 insns per cycle
* 110,814,772 cycles
* 0.038158386 seconds time elapsed ( +- 0.31% )
```

Cache miss 由原本的94.734 % 下降了64.812 % 效果不錯~!!
## 優化方法二(用hash table)
這邊參考了許多同學筆記,決定用djb2的hash funtion, 我先一開始就宣告一個指標陣列,讓它們先指向null,然後每個字串在經過hash funtion 轉成key值之後, 再malloc一個entry給它,這邊我bucket大小先選**3733**
djb2 hash funtion:
```
unsigned int hash(char *str) {
unsigned int hash=0;
while(*str){
hash=((hash<<5)+hash)+(*str++);
}
return (hash % SIZE);
}
```
```
orig opt hash
append() 0.042059 0.030150 0.038795
findName() 0.005248 0.001807 0.000001
```
bucket:**3733**
* 

可以看到分佈還算滿均勻的~
bucket:**5381**


跟3733的分佈差不多也是滿均勻的~~
## 優化方法三(memory pool+hash table)
因為一直動態配置記憶體會消耗很多時間,所以老師有建議可以用memory pool 方式 ,我這邊是一開始就把memory pool 讓它具有40萬個enrty 的空間 ,這樣malloc 時間應該可以大幅下降
```
* Performance counter stats for ’./phonebook_orig’ (100 runs):
* 5,605,583 cache-misses # 90.168 % of all cache refs
* 6,146,299 cache-references
* 321,993,358 instructions # 1.55 insns per cycle
* 204,993,902 cycles
* 0.071643834 seconds time elapsed ( +- 0.57% )
* Performance counter stats for ’./phonebook_opt’ (100 runs):
* 1,315,058 cache-misses # 65.543 % of all cache refs
* 1,988,104 cache-references
* 281,276,423 instructions # 2.33 insns per cycle
* 121,999,410 cycles
* 0.042034001 seconds time elapsed ( +- 0.82% )
* Performance counter stats for ’./phonebook_hash’ (100 runs):
* 1,565,930 cache-misses # 41.414 % of all cache refs
* 3,708,770 cache-references
* 278,921,792 instructions # 1.49 insns per cycle
* 186,693,421 cycles
* 0.063751001 seconds time elapsed ( +- 0.54% )
* Performance counter stats for ’./memory_pool’ (100 runs):
* 1,236,034 cache-misses # 44.846 % of all cache refs
* 2,710,477 cache-references
* 307,346,935 instructions # 2.35 insns per cycle
* 127,654,988 cycles
* 0.044987982 seconds time elapsed ( +- 0.82% )
```

**Performance:**
```
orig opt hash hash+memor_ypool
append() 0.041559 0.030556 0.038795 0.027478
findName() 0.005302 0.001871 0.000001 0.000001
speed up
append() 1.36x 1.07x 1.51x
findName() 2.83x 5302x 5302x
```
**cache miss:**
<table style="color: rgb(0, 0, 0); font-family: Helvetica; letter-spacing: normal; line-height: normal; font-size: 13px;">
<tbody>
<tr>
<td class="added" style="border: 1px solid rgb(153, 153, 153); min-width: 50px; height: 22px; line-height: 16px; padding-right: 4px; padding-left: 4px;"></td>
<td class="added" style="border: 1px solid rgb(153, 153, 153); min-width: 50px; height: 22px; line-height: 16px; padding-right: 4px; padding-left: 4px;">phonebook_orig</td>
<td class="added" style="border: 1px solid rgb(153, 153, 153); min-width: 50px; height: 22px; line-height: 16px; padding-right: 4px; padding-left: 4px;">phonebook_opt</td>
<td class="added" style="border: 1px solid rgb(153, 153, 153); min-width: 50px; height: 22px; line-height: 16px; padding-right: 4px; padding-left: 4px;">phonebook_hash</td>
<td class="added" style="border: 1px solid rgb(153, 153, 153); min-width: 50px; height: 22px; line-height: 16px; padding-right: 4px; padding-left: 4px;">memory_pool</td>
</tr>
<tr>
<td class="added" style="border: 1px solid rgb(153, 153, 153); min-width: 50px; height: 22px; line-height: 16px; padding-right: 4px; padding-left: 4px;">cache-misses</td>
<td class="added" style="border: 1px solid rgb(153, 153, 153); min-width: 50px; height: 22px; line-height: 16px; padding-right: 4px; padding-left: 4px;">5,605,583</td>
<td class="added" style="border: 1px solid rgb(153, 153, 153); min-width: 50px; height: 22px; line-height: 16px; padding-right: 4px; padding-left: 4px;">1,315,058</td>
<td class="added" style="border: 1px solid rgb(153, 153, 153); min-width: 50px; height: 22px; line-height: 16px; padding-right: 4px; padding-left: 4px;">1,565,930</td>
<td class="added" style="border: 1px solid rgb(153, 153, 153); min-width: 50px; height: 22px; line-height: 16px; padding-right: 4px; padding-left: 4px;">1,236,034</td>
</tr>
<tr>
<td class="added" style="border: 1px solid rgb(153, 153, 153); min-width: 50px; height: 22px; line-height: 16px; padding-right: 4px; padding-left: 4px;">cache-reference</td>
<td class="added" style="border: 1px solid rgb(153, 153, 153); min-width: 50px; height: 22px; line-height: 16px; padding-right: 4px; padding-left: 4px;">6,146,299</td>
<td class="added" style="border: 1px solid rgb(153, 153, 153); min-width: 50px; height: 22px; line-height: 16px; padding-right: 4px; padding-left: 4px;">1,988,104</td>
<td class="added" style="border: 1px solid rgb(153, 153, 153); min-width: 50px; height: 22px; line-height: 16px; padding-right: 4px; padding-left: 4px;">3,708,770</td>
<td class="added" style="border: 1px solid rgb(153, 153, 153); min-width: 50px; height: 22px; line-height: 16px; padding-right: 4px; padding-left: 4px;">2,710,477</td>
</tr>
<tr>
<td class="added" style="border: 1px solid rgb(153, 153, 153); min-width: 50px; height: 22px; line-height: 16px; padding-right: 4px; padding-left: 4px;">of all cache refs</td>
<td class="added" style="border: 1px solid rgb(153, 153, 153); min-width: 50px; height: 22px; line-height: 16px; padding-right: 4px; padding-left: 4px;">90.168 %</td>
<td class="added" style="border: 1px solid rgb(153, 153, 153); min-width: 50px; height: 22px; line-height: 16px; padding-right: 4px; padding-left: 4px;">65.543 %</td>
<td class="added" style="border: 1px solid rgb(153, 153, 153); min-width: 50px; height: 22px; line-height: 16px; padding-right: 4px; padding-left: 4px;">41.414 %</td>
<td class="added" style="border: 1px solid rgb(153, 153, 153); min-width: 50px; height: 22px; line-height: 16px; padding-right: 4px; padding-left: 4px;">44.846 %</td>
</tr>
</tbody>
</table>
## Gnuplot 學習
參考JASON H同學的詳細解說如下:
```
* reset
* set ylabel ’time(sec)’ `設定Y軸名稱`
* set style fill solid `設定圖形屬性 fill solid是直方圖`
* set title ’perfomance comparison’ `設定設定圖片標題`
* set term png enhanced font ’Verdana,10’ `設定圖片的字體`
* set output ’runtime.png’ `設定輸出檔名`
* plot [:][:0.060]'output.txt' using 2:xtic(1) with histogram title 'original' , \
* '' using ($0-0.1):($2+0.002):2 with labels title ' ' , \
* '' using 3:xtic(1) with histogram title ’'optimized' , \
* '' using ($0+0.1):($3+0.002):3 with labels title ' ' , \
* '' using 4:xtic(1) with histogram title 'hashed' , \
* '' using ($0+0.3):($4+0.0015):4 with labels title ' '
```
基本語法:`using 2:xtic(1) with histogram title ’original’, ` `’’ using ($0-0.1):($2+0.002):2 with labels title ’ ’,`
* 單引號表示與前面一個檔案相同
* 第一行`using 2`的意思是以output.txt的第二行當作資料, `xtic(1)` 是用第一行當作X軸的標題(就是append()跟findname())
* 第二行是來設定直方圖上面的顯示數字位置(x軸位置):(y軸位置)
* $0=column(0) 虛擬的行,可以當作檔案中紀錄「列號」的一行
* (x-座標):(y-座標):(這裡的數字表示要用那一行的資料) with labels 把數字標在直方圖上,上面有對座標平移避免讓數字不會疊在長條圖上,後方的 title ’ ’可以用 notitle取代
## 參考資料
1. [畫圖工具Graphviz](http://www.graphviz.org/)
2. [詹志鴻同學](https://hackpad.com/Embedded-System-2-11ezKKob2aT)(提到gnuplot使用,multithread實做)
3. [有沒有發現 `strcasecmp` 用到 Intel AVX SIMD 來加速呢?](https://sourceware.org/ml/libc-alpha/2015-06/msg00799.html)
4. [林郁寧同學](https://embedded2015.hackpad.com/-Homework2-7UYo4wcPhd7)(實做4種hash function,透過abstraction的方式把function包裝成API)
5. [楊永平同學](https://mimihalo.hackpad.com/HW2--D5sU0CfNmJH)(字串壓縮有解說,也有分析hash funtion圖表不錯)
6. [GCC Optimize-Options](https://gcc.gnu.org/onlinedocs/gcc/Optimize-Options.html)
7. [大量 String 資料結構 : Trie](http://www.csie.ntnu.edu.tw/~u91029/String.html#5)
8. [GALI 同學](https://embedded2015.hackpad.com/-Homework-2-BcviLIydq9w) / [github](https://github.com/GaliTW/phonebook) (有實做 AVL ,BST,RB 樹)
9. [Charles同學](https://charles620016.hackpad.com/ep/pad/static/Japi4qFyAzt)(實做fuzzy search)
10. [陳品睿同學](https://embedded2016.hackpad.com/2016q1-Homework1-utBhpkDFVMh)(實做memory pool)
11. [ RINC同學](https://embedded2016.hackpad.com/2016q1-Homework-1-9eSkToGwJvZ)(有用圖表表示hash collision)
12. [安正同學](https://embedded2016.hackpad.com/2016q1-Homework-1-eNBItF9WQqY)(改變struct大小為二維陣列)