---
tags: os, c
---
2018q1 Homework1 (phonebook)
===
contributed by <`team6612`> (Daniel Chen)
### Reviewed by `BodomMoon`
- 閣下在cache和memory方面追根究底的精神我很欣賞,可是相對的實驗方向中提到的三個方向似乎下來全文只實作了減少cache-miss的部份。
- 可將 memory poll 的部份再跟單純縮減 entry size 的部份分開來另外表示(ex:phonebook_mem)可以更加清楚的表達不同實驗中的不同效果。
- 此外在實作 memory poll 之後cache-miss的數量雖然降低了,但相對起整體 cache 操作的比例卻是升高的,可否針對這個部份做一點分析或說明呢。
:::info
### Table of Content
[TOC]
:::
環境
---
### 作業系統
```
./+o+- daniel@daniel-thinkpad-ubuntu
yyyyy- -yyyyyy+ OS: Ubuntu 17.10 artful
://+//////-yyyyyyo Kernel: x86_64 Linux 4.13.0-32-generic
.++ .:/++++++/-.+sss/` CPU: Intel Core i5-5200U @ 4x 2.7GHz [47.0°C]
.:++o: /++++++++/:--:/- GPU: GeForce 940M
o:+o+:++.`..```.-/oo+++++/ RAM: 5249MiB / 7677MiB
.:+o:+o/. `+sssoo+/
.++/+:+oo+o:` /sssooo. Virtualization: VT-x
/+++//+:`oo+o /::--:. L1d cache: 32K
\+/+o+++`o++o ++////. L1i cache: 32K
.++.o+++oo+:` /dddhhh. L2 cache: 256K
.+.o+oo:. `oddhhhh+ L3 cache: 3072K
\+.++o+o``-````.:ohdhhhhh+
`:o+++ `ohhhhhhhhyo++os:
.o:`.syhhhhhhh/.oo++o`
/osyyyyyyo++ooo+++/
````` +oo+++o\:
`oo++.
```
Cache 詳細資訊
```
$ sudo dmidecode -t cache
# dmidecode 3.1
Getting SMBIOS data from sysfs.
SMBIOS 2.7 present.
Handle 0x0003, DMI type 7, 19 bytes
Cache Information
Socket Designation: L1 Cache
Configuration: Enabled, Not Socketed, Level 1
Operational Mode: Write Back
Location: Internal
Installed Size: 32 kB
Maximum Size: 32 kB
Supported SRAM Types:
Synchronous
Installed SRAM Type: Synchronous
Speed: Unknown
Error Correction Type: Parity
System Type: Data
Associativity: 8-way Set-associative
Handle 0x0005, DMI type 7, 19 bytes
Cache Information
Socket Designation: L1 Cache
Configuration: Enabled, Not Socketed, Level 1
Operational Mode: Write Back
Location: Internal
Installed Size: 32 kB
Maximum Size: 32 kB
Supported SRAM Types:
Synchronous
Installed SRAM Type: Synchronous
Speed: Unknown
Error Correction Type: Parity
System Type: Instruction
Associativity: 8-way Set-associative
Handle 0x0006, DMI type 7, 19 bytes
Cache Information
Socket Designation: L2 Cache
Configuration: Enabled, Not Socketed, Level 2
Operational Mode: Write Back
Location: Internal
Installed Size: 256 kB
Maximum Size: 256 kB
Supported SRAM Types:
Synchronous
Installed SRAM Type: Synchronous
Speed: Unknown
Error Correction Type: Single-bit ECC
System Type: Unified
Associativity: 8-way Set-associative
Handle 0x0007, DMI type 7, 19 bytes
Cache Information
Socket Designation: L3 Cache
Configuration: Enabled, Not Socketed, Level 3
Operational Mode: Write Back
Location: Internal
Installed Size: 3072 kB
Maximum Size: 3072 kB
Supported SRAM Types:
Synchronous
Installed SRAM Type: Synchronous
Speed: Unknown
Error Correction Type: Multi-bit ECC
System Type: Unified
Associativity: 12-way Set-associative
```
### 環境安裝
本次作業需用到 perf 進行效能分析及 gnuplot 對分析結果可視化,相關安裝及環境設定如下:
```bash
$ sudo apt update
$ sudo apt install build-essential # including g++ gcc make etc.
$ sudo apt install linux-tools-common linux-tools-general # for installing perf
$ sudo apt install astyle cppcheck colordiff gnuplot # analysis tools and code formatter
# Check your kernel release
$ uname -r
4.13.0-32-generic
# Install linux tools for your kernel release
$ sudo apt install linux-tools-4.13.0-32-generic linux-cloud-tools-4.13.0-32-generic
or
$ sudo apt install linux-tools-`uname -r` linux-cloud-tools-`uname -r`
```
#### 設定 user 對 event_data 的存取權限
如果未設定的話以 user 權限執行 `perf top` 會出現以下錯誤:
```
┌─Error:───────────────────────────────────────────────────────────┐
│You may not have permission to collect system-wide stats. │
│ │
│Consider tweaking /proc/sys/kernel/perf_event_paranoid, │
│which controls use of the performance events system by │
│unprivileged users (without CAP_SYS_ADMIN). │
│ │
│The current value is 3: │
│ │
│ -1: Allow use of (almost) all events by all users │
│>= 0: Disallow raw tracepoint access by users without CAP_IOC_LOCK│
│>= 1: Disallow CPU event access by users without CAP_SYS_ADMIN │
│>= 2: Disallow kernel profiling by users without CAP_SYS_ADMIN │
│ │
│To make this setting permanent, edit /etc/sysctl.conf too, e.g.: │
│ │
│ kernel.perf_event_paranoid = -1 │
│ │
│ │
│ │
│Press any key... │
└──────────────────────────────────────────────────────────────────┘
```
若需讓 user 直接存取 event data 的話,將 `/proc/sys/kernel/perf_event_paranoid` 設定爲 `0`:
```bash
$ sudo sh -c "echo 0 > /proc/sys/kernel/perf_event_paranoid"
```
若需檢測 cache miss 則需要再將 kernel pointer 的存取權限打開:
```bash
$ sudo sh -c "echo 0 > /proc/sys/kernel/kptr_restrict"
```
#### 設定 astyle
本課程之 coding style 規範設定
```bash
$ astyle --style=kr --indent=spaces=4 --indent-switches --suffix=none *.[ch]
```
文獻回顧
---
### [perf 原理和實務](https://hackmd.io/s/B11109rdg)
perf 是 linux 內建的效能分析軟體, pref 可以追蹤硬體層級及軟體層級的事件,硬體層級如 cache miss、 cpu cycle,軟體層級如 page fault、 contex switch,還有另一種事件是Kernel Tracepoint,是寫死在 linux kernel 內觸發的量測事件,如 syscalls 可記錄各種 system call 的呼叫次數,各種事件的相關整理及關係如下圖:
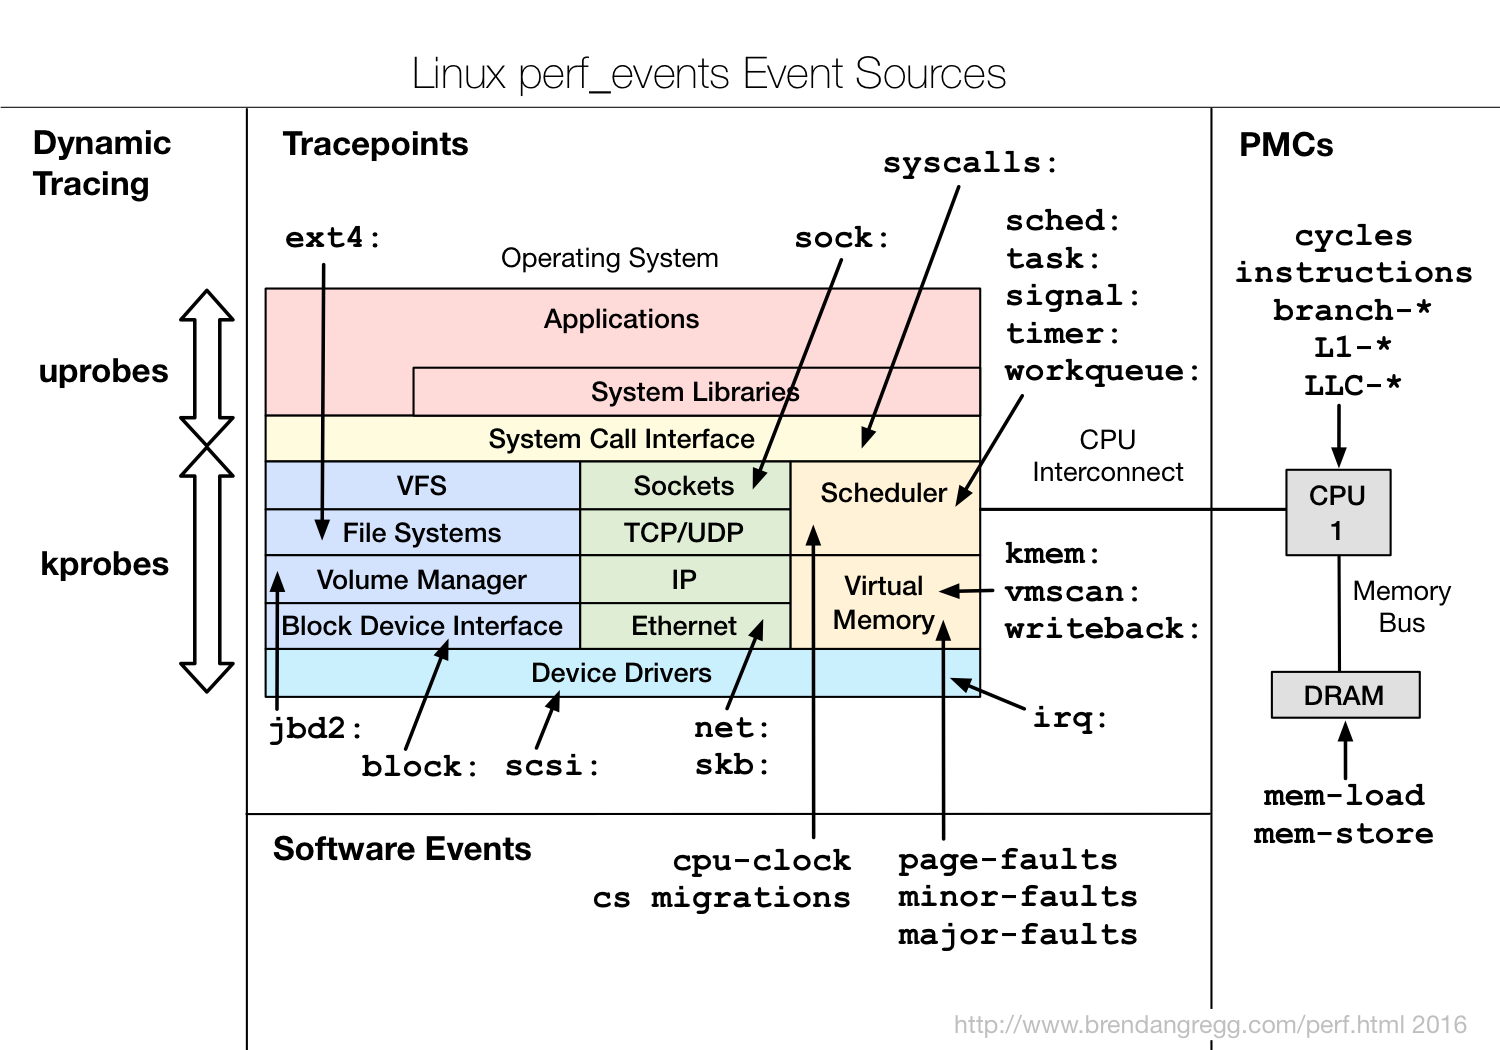
(Credit: [Linux perf Examples](http://www.brendangregg.com/perf.html),關於各種事件的詳細說明可參閱該站 [5. Events](http://www.brendangregg.com/perf.html#Events))
常用指令如:
```bash
$ perf top # 即時分析各程序的 perf event 觸發狀況
$ perf stat # 對特定程序輸出指定 perf event 的統計結果
$ perf record # 可對函式級別的 event 進行統計,但不會直接輸出到終端機中,而是輸出到 perf.data
$ perf report # 讀取並顯示由 perf record 所記錄的 perf.data 檔案
```
### [Cache](https://en.wikipedia.org/wiki/CPU_cache)
[cache 原理和實驗](https://hackmd.io/s/S14L26-_l#)
本次作業關心的重點在程式在執行時的 cache miss ,因此我們來回顧一下 CPU cache 的設計及運作模式,以及 cache miss 如何發生。
程式執行時會將指令和相關的資料載入記憶體, CPU 會從記憶體中讀取指令和資料來執行,並將執行的結果存回記憶體,雖然記憶體的存取速度已經較硬碟快上許多,但仍和 CPU 的存取速度有落差,一來一往間會犧牲掉很多 CPU 的效能,我們可以把記憶體做得更快讓他能夠跟上 CPU 的存取速度,但這並不符合成本效益,於是就有 cache 的設計。
CPU cache 爲數組容量較小但速度比記憶體快上幾倍的儲存空間,供 CPU 將較常存取的資料暫存,避免頻繁與記憶體進行較慢的資料交換來提升效能,而 CPU cache 會使用較快但成本較高的 SRAM,一般的記憶體則是使用 SDRAM。([What is the difference between DRAM, SRAM, and SDRAM? Which one is the best RAM technology?](https://www.quora.com/What-is-the-difference-between-DRAM-SRAM-and-SDRAM-Which-one-is-the-best-RAM-technology))
現代的 CPU cache 爲層狀結構,分爲 L1、 L2、及 L3 cache (有些架構可能沒有 L3 cache,另外有少數的架構有做到 [L4 cache](https://superuser.com/questions/1073937/what-does-l4-cache-hold-on-some-cpus)),容量隨着層數遞增,速度隨着層數遞減,而 L1 cache 又分爲 L1d (data)、 L1i (instruction) 分別儲存資料及指令。
:::info
思考:為何 L1 cache 分為 L1d 和 L1i 呢?這樣的設計可帶來什麼好處?
:notes: jserv
:::
> 因爲某些指令操作可能不涉及資料存取,加上 cache 是 sequential 存取,若將資料與指令分開儲存,可加速不涉及資料存取的操作。 [name=Daniel Chen]
當 CPU 在 L1 cache 中找不到特定資料時會到 L2 cache 中尋找,若還是找不到會往 L3 cache 找,最後才會到記憶體中找尋該資料,此過程稱爲 cache miss,因爲記憶體的存取會造成 latency,過於頻繁的 cache miss 會嚴重影響程式效能。
瞭解 cache 的運作模式後我們來研究看看如何從 cache 下手改進程式效能。
### [What is “cache-friendly” code?](https://stackoverflow.com/questions/16699247/what-is-cache-friendly-code)
這是一篇 stackoverflow 上的發問,內容有關於如何在 c++ 中撰寫一個 cache-friendly 的程式碼,底下有許多的討論,其中 Marc Claesen 大大的回答中從 [the principle of locality](http://en.wikipedia.org/wiki/Locality_of_reference) 出發,並介紹幾個可以着手的點。
+ c++ container 的選用
+ 資料結構及演算法設計
+ 隱含的資料儲存結構利用(row major / column major 的議題)
+ 避免不可預期的分支
+ virtual function 的問題
### [Cache 原理與實際影響](https://hackmd.io/s/HkW3Dr1Rb#)
jserv 老師在此講中更深入的介紹 cache line 的運作原理與 locality 等議題,以及探討如和利用 prefetch、 locality hint 等技術改善 cache 效率。
其中得到一個很不錯的觀念是,在現代電腦的世界裏,我們可能不止要關心單一事件的效率,同時得考慮該事件的發生頻率,微小的 latency 當頻率很高時就會是一個很可觀的效能瓶頸,反過來說若一個事件發生頻率高,我們若能夠改善該單一事件的效率,整體來說就會有很顯著的效能改善。
### 共筆回顧
目前所看過去學長姐們的作品大多着重在以下幾點改善
+ 減少 cache miss
+ 減少 size of entry
+ 使用 hash function
+ 使用 BST
+ 使用 memory bool
優先回顧了由 [ryanpatiency](https://hackmd.io/s/B1SSiTM_G#) 同學所整理的幾個優秀的作品
實驗過程及成果
---
### 實驗方向
+ 減少 cache miss
+ 使用 hash function
+ 使用 BST
### 優化前效能
**單次執行**
```bash
$ perf stat -e cache-misses,cache-references,cycles,instructions ./phonebook_orig
```
```
size of entry : 136 bytes
execution time of append() : 0.070619 sec
execution time of findName() : 0.008140 sec
Performance counter stats for './phonebook_orig':
3,530,039 cache-misses # 83.408 % of all cache refs
4,232,257 cache-references
236,836,308 cycles
282,746,456 instructions # 1.19 insn per cycle
0.103359430 seconds time elapsed
```
**執行100次**
```
Performance counter stats for './phonebook_orig' (100 runs):
3,405,962 cache-misses # 89.432 % of all cache refs ( +- 0.06% )
3,808,428 cache-references ( +- 0.18% )
276,828,575 instructions # 1.35 insn per cycle ( +- 0.02% )
204,706,214 cycles ( +- 0.23% )
0.079474756 seconds time elapsed ( +- 0.32% )
```
### 實驗成果
#### 實驗1 - 降低 entry size
在降低 entry size 的優化中主要考量的點應爲 spatial locality,因爲 findName() 的操作中每個 entry 只存取一次,盡可能讓首次寫進 cache 的 entry 越多越能降低 cache miss。
參考大部分同學的做法,將 entry detail 另外存放:
`phonebook_opt.h`
```h
typedef struct __PHONE_BOOK_ENTRY {
char lastName[MAX_LAST_NAME_SIZE];
struct __PHONE_BOOK_DETAIL *pDetail;
struct __PHONE_BOOK_ENTRY *pNext;
} entry;
typedef struct __PHONE_BOOK_DETAIL {
char lastName[MAX_LAST_NAME_SIZE];
char firstName[16];
char email[16];
char phone[10];
char cell[10];
char addr1[16];
char addr2[16];
char city[16];
char state[2];
char zip[5];
} detail;
```
`phonebook_opt.c`
```c
entry *append(char lastName[], entry *e)
{
/* TODO: implement */
/* allocate memory for the new entry and put lastName */
e->pNext = (entry *) malloc(sizeof(entry));
e = e->pNext;
strcpy(e->lastName, lastName);
/* Because we won't put any detail data for now, comment it to save memory */
// e->pDetail = (detail *) malloc(sizeof(detail));
e->pNext = NULL;
return e;
}
```
注意到 pDetail 的實作因爲目前沒有要寫入任何詳細資訊,因此不配置記憶體空間給。
**實驗結果**
```
Performance counter stats for './phonebook_opt' (100 runs):
1,207,973 cache-misses # 68.929 % of all cache refs ( +- 0.15% )
1,752,501 cache-references ( +- 0.32% )
255,098,629 instructions # 1.76 insn per cycle ( +- 0.02% )
144,854,000 cycles ( +- 0.40% )
0.056908168 seconds time elapsed ( +- 0.45% )
```

可以看到 cache-reference 和 cache-miss rate 都有很顯著的下降,整體執行時間加快了約 30%
因爲目前沒有要寫入任何 detail 資料,嘗試將 pDetail 也拿掉比較看看
**實驗結果**
```
Performance counter stats for './phonebook_opt' (100 runs):
851,438 cache-misses # 72.021 % of all cache refs ( +- 0.21% )
1,182,206 cache-references ( +- 0.60% )
251,274,431 instructions # 1.81 insn per cycle ( +- 0.02% )
138,847,921 cycles ( +- 0.63% )
0.054831663 seconds time elapsed ( +- 0.65% )
```

速度稍微快一點,cache-reference 稍微少了一些,但 cache-miss rate 上升了大約 10% 左右。
> 問題: cache reference 的意義? 爲什麼 cache reference 會下降? [name=Daniel Chen]
我們稍微來做一點計算,原始未進行優化的 struct 大小應爲
```
(MAX_LAST_NAME_SIZE + 16 * 5 + 10 * 2 + 2 + 5)*1 + 8 = 131 (bytes)
```
但用 gdb 實驗發現實際的大小要比預期得來得大
```
(gdb) p sizeof(entry)
$2 = 136
```
調查了一下應該是 [Data struct alignment](https://stackoverflow.com/questions/119123/why-isnt-sizeof-for-a-struct-equal-to-the-sum-of-sizeof-of-each-member) 的問題,因爲我在 64 bits 的系統上執行, align 過後的資料長度恰爲 8 bytes 的倍數。
回到 cache 存取分析,我的 L1 cache 大小是 32 KB, 8-way set associative, cache line size 爲 64 bytes, 136 bytes 需跨越 3 個 cache line, cache hit 只可能發生一次,導致了將近 90% 的 cahce miss。
再來看看優化後的 struct, 大小計算如下
```
16 + 8 + 8 = 32 (bytes)
```
恰爲 8 bytes 的倍數,從 gdb 看也是 32 bytes
```
(gdb) p sizeof(entry)
$1 = 32
```
一個 cache line 可以存 2 個 entry,若相鄰的 entry 存在連續的記憶體空間中,則每兩次 access 就有可能發生一次 cache hit,結果來看 cache miss 約爲 66%,很接近 1/2。
> 問題: 以 malloc 配置 struct 是否真的會讓相鄰的 struct 存在於連續的記憶體空間中? [name=Daniel Chen]
再進一步看刪掉 pDetail 的結構, entry size 爲 24 bytes,一組 cache line 可存放 2.6 個 entry,平均約 3 次 access 會發生 2 次 cache hit, cache miss 應該約爲 33%,但實際的 cache miss 卻比 32 bytes 的 entry 高出 8%,這樣的計算方法可能有某些問題沒有考慮進去。
爲了取得更多的資訊,我決定額外做一組實驗,設計一大小爲 16 bytes 的 entry,以相同的方法 access,看 cache miss rate 是否能到達預期的 25%。
我將 MAX_LAST_NAME_SIZE 改爲 8,並將 word.txt 中長度大於 8 的字串都截斷 (如: abcdefghijkl 改爲 abcdefgh,此舉可能造成許多重複的內容,但目標字串不會重複所以不影響),實驗結果如下
```
Performance counter stats for './phonebook_opt' (100 runs):
1,389,173 cache-misses # 76.184 % of all cache refs ( +- 0.13% )
1,823,446 cache-references ( +- 0.35% )
418,142,559 instructions # 2.23 insn per cycle ( +- 0.02% )
187,540,686 cycles ( +- 0.29% )
0.073030731 seconds time elapsed ( +- 0.35% )
```

效能竟然大幅下降了,顯然我的想法有很大的瑕疵。另一個發現是 IPC 表現較之前的版本好,效能卻下降,此問題也值得探討。
整理目前的問題如下,以下將分別探討這些議題:
1. cache reference 的意義
2. malloc struct 是否會配置在連續的記憶體
3. 縮減 entry size 卻造成 cache miss rate 提升,及再次縮減造成的效能下降
4. IPC 表現較好效能卻不升反降(此說法可能不精確,造成效能降低的原因有可能是其他影響更大的 bottleneck)
**Cache reference**
此疑問最初來自 [perf 原理和實務](https://hackmd.io/s/B11109rdg#perf-stat)中的範例程式碼,爲何將 col major 改爲 row major 會造成 cache refs 下降而 cache miss rate 上升(更準確地說是 cache refs & cache miss 都下降,但 cache refs 下降得更多,始得 cache miss rate看起來是升高的),而非原本心中預期的 cache refs 不變且 cache miss count 下降,在此次作業中也有發現做過優化後 cache refs 的次數下降了,但不知道原因爲何。
目前尚未找到合理的解釋,但推測可能有以下問題沒考慮到:
+ cache refs 不是全部都來自資料存取,也有可能是指令的存取
+ cache miss 時會造成額外的記憶體存取開銷
**malloc 連續記憶體配置**
我以 entry size = 32 bytes 的版本做測試,以 gdb 列印出 `pHead -> pNext` 臨近的 64 bytes 觀察:
```
(gdb) x/64xw pHead->pNext
0x5555557588e0: 0x61616161 0x00000000 0x00000000 0x00000000
0x5555557588f0: 0x00000000 0x00000000 0x55758910 0x00005555
0x555555758900: 0x00000000 0x00000000 0x00000031 0x00000000
0x555555758910: 0x61616161 0x00000061 0x00000000 0x00000000
0x555555758920: 0x00000000 0x00000000 0x55758940 0x00005555
0x555555758930: 0x00000000 0x00000000 0x00000031 0x00000000
0x555555758940: 0x61616161 0x00006161 0x00000000 0x00000000
0x555555758950: 0x00000000 0x00000000 0x55758970 0x00005555
0x555555758960: 0x00000000 0x00000000 0x00000031 0x00000000
0x555555758970: 0x61616161 0x00616161 0x00000000 0x00000000
0x555555758980: 0x00000000 0x00000000 0x557589a0 0x00005555
0x555555758990: 0x00000000 0x00000000 0x00000031 0x00000000
0x5555557589a0: 0x61616161 0x61616161 0x00000000 0x00000000
0x5555557589b0: 0x00000000 0x00000000 0x557589d0 0x00005555
0x5555557589c0: 0x00000000 0x00000000 0x00000031 0x00000000
0x5555557589d0: 0x61616161 0x61616161 0x00000068 0x00000000
```
`0x61616161` 爲 `aaaa` 可判斷出這確實是第一筆 entry 的位置(pHead 算第 0 筆),與這組 entry 連結的 `pNext` 位於 `0x00005555 55758910`,中間差距 48 bytes,被 offset 了 16 bytes,繼續往下找的話也可以發現相似的 offset。
實驗 24 bytes 的版本:
```
(gdb) x/64x pHead->pNext
0x5555557588d0: 0x61616161 0x00000000 0x00000000 0x00000000
0x5555557588e0: 0x557588f0 0x00005555 0x00000021 0x00000000
0x5555557588f0: 0x61616161 0x00000061 0x00000000 0x00000000
0x555555758900: 0x55758910 0x00005555 0x00000021 0x00000000
0x555555758910: 0x61616161 0x00006161 0x00000000 0x00000000
0x555555758920: 0x55758930 0x00005555 0x00000021 0x00000000
0x555555758930: 0x61616161 0x00616161 0x00000000 0x00000000
0x555555758940: 0x55758950 0x00005555 0x00000021 0x00000000
0x555555758950: 0x61616161 0x61616161 0x00000000 0x00000000
0x555555758960: 0x55758970 0x00005555 0x00000021 0x00000000
0x555555758970: 0x61616161 0x61616161 0x00000068 0x00000000
0x555555758980: 0x55758990 0x00005555 0x00000021 0x00000000
0x555555758990: 0x61616161 0x75616161 0x00686775 0x00000000
0x5555557589a0: 0x557589b0 0x00005555 0x00000021 0x00000000
0x5555557589b0: 0x61616161 0x68676161 0x00000000 0x00000000
0x5555557589c0: 0x557589d0 0x00005555 0x00000021 0x00000000
```
offset 變成 8 bytes,兩個 entry 距離為 32 bytes。
找不到共通點,此問題可留待後續研究,但可以確定的事是,連續 malloc 並不保證記憶體空間連續,此問題可用 memory pool 解決,一開始就先配置一組連續的記憶體,如此也能使有用的資料寫進 cache 的機會增加。另一解決方法爲使用 array 來 maintain 一組 hash table,但 hash 就不保證在存取時會按照順序存取了。
:::info
後來發現 malloc 是以 "Chunk" 為單位進行分配, chunk 的長度是可變的,但因 alignment 的問題一定是 8 bytes 的倍數,當程式進行記憶體配置要求的時候, malloc 會在可用的 chunk 中拼湊出一塊連續、空間足夠的 chunk,而每個 chunck 前面會有該 chunk 的大小資訊,特別的地方是因為 chunck 的大小一定是 8 bytes 的倍數,這個大小資訊的 3 個 LSB 會一直是 0 因此這三個 bits 被拿來用作 flag,分別代表
+ Allocated Arena
+ MMap'd chunk
+ Previous chunk is in use
觀察上面的例子,在 32 bytes 的 case 中, size 資訊為 `0x31` 清除最後 3 個 bits 後是 `0x30 = 48 (dec)` 恰為兩個 entry 間的距離。而 24 bytes 的 case 中 size 為 `0x21` 一樣可以看出 chunck 大小為 `0x20 = 32 (dec)` ,並且可驗證 prev_in_use bit 為 1,表示前一個 chunck 使用中。
[[ref](https://sourceware.org/glibc/wiki/MallocInternals)]
:::
**縮減 entry size 帶來的效益**
原本預期 entry size 越小應可降低 cache miss 發生的機會,但結果並不盡然。
> 此問題初步認為應和 (1) 的 cache refs 行為有關系,因為尚不瞭解 (1) 的詳細原理,此問題暫時擱置。 [name=team6612]
#### 實驗2 - 使用 Memory pool
使用 Mem pool 的好處是可配置一塊連續的記憶體空間給 linked list,讓寫進 cache 內的 entry 增加,降低 cache miss,此外也可以節省多次 malloc 所產生出來額外的 chuck info 造成記憶體空間的浪費,但必須注意 pool 的空間管理,避免存取到非 pool 範圍的記憶體,以及使用完後需將空間釋放,否則將造成 memory leak。
Memeory pool 實作如下
`phonebook_opt.h`
```c
typedef struct _mpool {
char *head;
char *next;
char *tail;
} mpool;
mpool *pool_create(size_t s);
void *pool_alloc(mpool *p, size_t size);
void pool_free(mpool *p);
```
`phonebook_opt.c`
```c
mpool *pool_create(size_t size)
{
mpool *p = (mpool *) malloc(sizeof(mpool));
p->head = p->next = (char *) malloc(size);
p->tail = p->head + size;
return p;
}
void *pool_alloc(mpool *p, size_t size)
{
if (p->tail - p->next < size)
return NULL;
void *m = (void *) p->next;
p->next += size;
return m;
}
void pool_free(mpool *p)
{
free(p->head);
free(p);
}
```
修改 `main.c`
```c
...
#ifdef OPT
mpool *pool = pool_create(sizeof(entry) * 400000);
#endif
...
#ifdef OPT
pHead = (entry *) pool_alloc(pool, sizeof(entry));
#else
pHead = (entry *) malloc(sizeof(entry));
#endif
...
#ifdef OPT
e = append(line, e, pool);
#else
e = append(line, e);
#endif
...
#ifdef OPT
/* free mem pool */
pool_free(pool);
#else
/* free linked list of entry */
do {
e = pHead;
pHead = pHead->pNext;
free(e);
} while (pHead);
#endif
```
**實驗結果**
```
Performance counter stats for './phonebook_opt' (100 runs):
637,029 cache-misses # 74.870 % of all cache refs ( +- 0.10% )
850,844 cache-references ( +- 0.39% )
181,992,282 instructions # 1.81 insn per cycle ( +- 0.03% )
100,383,644 cycles ( +- 0.22% )
0.039542202 seconds time elapsed ( +- 0.32% )
```

可觀察到整體執行時間下降, cache-misses 總數也下降了,其中 `append()` 的執行時間較 `findName()` 明顯,應是因爲省去了反覆呼叫 malloc 所造成的一些額外的 overhead。
以 valgrind 檢查一下是否有 memory leak (編譯時記得加上 `-g`)
```bash
$ valgrind --leak-check=full ./phonebook_opt
...
==7363== HEAP SUMMARY:
==7363== in use at exit: 0 bytes in 0 blocks
==7363== total heap usage: 7 allocs, 7 frees, 9,610,344 bytes allocated
==7363==
==7363== All heap blocks were freed -- no leaks are possible
```
以 gdb 觀察記憶體配置狀況
```
(gdb) x/64x pHead->pNext
0x7ffff70cd028: 0x61616161 0x00000000 0x00000000 0x00000000
0x7ffff70cd038: 0xf70cd040 0x00007fff 0x61616161 0x00000061
0x7ffff70cd048: 0x00000000 0x00000000 0xf70cd058 0x00007fff
0x7ffff70cd058: 0x61616161 0x00006161 0x00000000 0x00000000
0x7ffff70cd068: 0xf70cd070 0x00007fff 0x61616161 0x00616161
0x7ffff70cd078: 0x00000000 0x00000000 0xf70cd088 0x00007fff
0x7ffff70cd088: 0x61616161 0x61616161 0x00000000 0x00000000
0x7ffff70cd098: 0xf70cd0a0 0x00007fff 0x61616161 0x61616161
0x7ffff70cd0a8: 0x00000068 0x00000000 0xf70cd0b8 0x00007fff
0x7ffff70cd0b8: 0x61616161 0x75616161 0x00686775 0x00000000
0x7ffff70cd0c8: 0xf70cd0d0 0x00007fff 0x61616161 0x68676161
0x7ffff70cd0d8: 0x00000000 0x00000000 0xf70cd0e8 0x00007fff
0x7ffff70cd0e8: 0x61616161 0x68686161 0x00686868 0x00000000
0x7ffff70cd0f8: 0xf70cd100 0x00007fff 0x61616161 0x67756161
0x7ffff70cd108: 0x00000068 0x00000000 0xf70cd118 0x00007fff
0x7ffff70cd118: 0x61616161 0x00686761 0x00000000 0x00000000
```
可發現 entry 間已經沒有多餘的資訊了。
**問題討論**
+ 改善幅度
+ 當初使用 memory pool 意圖讓 entry 都存在臨近的記憶體空間以增加 locality ,實測有提升,但並沒有想象相中的大幅改善,因原本的程式中連續 malloc 的方式就已經接近連續了,只是 entry 之間多了 chunk info 而已。
+ Memory pool 大小問題
+ 本次實驗因爲預先知道會有多少比資料,事先配置了一塊足夠大的記憶體,因此沒有發生存取超過 memory pool 的情況,但實際上是有可能發生的,若發生超過的狀況可能可以利用動態新增 memory pool 的方式來解決;也有可能發生配置過大,程式根本用不到那麼多的狀況。
結論及延伸議題
---
### 討論
+ 效能改進策略
+ 降低 entry size
+ 在降低 entry size 的實驗中我們很明顯的感受到了降低 entry size 所帶來的效能改進,但因爲對 cache refs 的行爲不瞭解,無法解釋將 entry size 縮小反而效能變差的狀況
+ 使用 memory pool
+ memory pool 改善了 append 的速度,並增進了記憶體空間的使用效率,但效能上未獲得像降低 entry size 那樣顯著
+ 實作 hash table
+ 就其他同學的經驗來說 hash table 對查詢的改善最明顯,未來有機會也可實驗看看
+ 本例選用的 dataset (也就是輸入電話簿的姓名) 是否存在問題?
- 有代表性嗎?跟真實英文姓氏差異大嗎?
- 真實英文姓氏的長度可能無法預測,若超過預設的大小會發生 overflow,可改用 `strncpy` 避免陣列溢出
- 真實的資料也不一定是排序過的,雖然在本次實作中有無排序似乎不重要,但其他同學實作 BST 的話就有差別了
- 資料難道「數大就是美」嗎?
- 資料重貭不重量,量大很有可能含有重複的資料,或錯誤的資料,當資料量越大時這種單筆的資料錯誤就更難找出,因此再資料蒐集階段就必須要謹慎的審視正確性
- 如果我們要建立符合真實電話簿情境的輸入,該怎麼作?
- 真實的情境很有可能是透過網頁服務的方式進行建置,資料是一筆一筆進來的,因此資料的排序會是一個額外的考量
- 若資料透過網路傳輸可能會有丟失問題 (但網路協定已可以幫我們處理資料丟失的問題)
- 另外本次實作將 Detail 資料整個去掉了,真實的狀況還要考慮將這些詳細資料存入的狀況
- 在搜尋的部分需加入容錯能力,不必查找完全符合的字串也能找到想要的資料,也就是加分題的 fuzzy search 功能
- 真實狀況可能需要再多考慮 temporal locality,因爲有可能會有相同資料重複查找的狀況
- 若資料量再更大要再考慮到記憶體空間是否足夠
- 此外亦可構思較好的檔案結構來加速資料的讀寫
其他議題
---
### Makefile 撰寫
 Sign in with Wallet
Connect another wallet
Sign in with Wallet
Connect another wallet