# How can we maximise profit as an Airbnb host?
#### We are using Airbnb Singapore Dataset on 29 December 2022 and the source is located in http://insideairbnb.com/get-the-data/
## Contributors :
- Isaac Chun Jun Heng U2221389B
- J'sen Ong Jia Xuan U2220457J
- Tang Teck Meng U2221809C
## Juypter Notebooks :
* **Exploration Data Analysis**
* [EDA_First25.ipynb](https://github.com/isaacchunn/SC1015_MiniPrj_Airbnb/blob/main/EDA_First25.ipynb)
* [EDA_Middle23.ipynb](https://github.com/isaacchunn/SC1015_MiniPrj_Airbnb/blob/main/EDA_Middle23.ipynb)
* [EDA_Last25.ipnyb](https://github.com/isaacchunn/SC1015_MiniPrj_Airbnb/blob/main/EDA_Last25.ipynb)
* **Uni/Bi/Multi-Variate Analysis**
* [Airbnb_EDA_Visualization.ipnyb](https://github.com/isaacchunn/SC1015_MiniPrj_Airbnb/blob/main/Airbnb_EDA_Visualization.ipynb)
* [Airbnb_EDA_Visualization.ipnyb (To view interactive map)](https://nbviewer.org/github/isaacchunn/SC1015_MiniPrj_Airbnb/blob/main/Airbnb_EDA_Visualization.ipynb)
* **Machine Learning**
* [Airbnb_Regression.ipnyb](https://github.com/isaacchunn/SC1015_MiniPrj_Airbnb/blob/main/Airbnb_Regression.ipynb)
* [Airbnb_Machine_Learning.ipynb](https://github.com/isaacchunn/SC1015_MiniPrj_Airbnb/blob/main/Airbnb_Machine_Learning.ipynb)
# Content Section
1) ### [Introduction](#Introduction)
* [What is Airbnb?](#Introduction)
* [Problem Statement and Hypothesis](#Problem-Statement)
* [Libraries Used](#Libraries-used)
* [General Utility functions](#General-Utility-functions)
2) ### [Data Cleaning and Visualization](#Dataset_importing_and_DataCleaning)
* [Uni-Variate EDA](##Uni-Variate-EDA)
* [Bi-Variate EDA](##Bi-Variate-EDA)
3. [Exploratory Data Analysis](#Exploratory-Data-Analysis)
4. [Machine Learning](#Machine-Learning)
5. [Extra ML models](#Extra-ML-Models)
6. [Conclusion](#Conclusion)
7. [Video Presentation](#Video-Presentation)
8. [Task Delegation](#Task-Delegation)
9. [Beyond Our Course](#Beyond-our-Course)
10. [References](#References)
# Introduction
<br></br>

<br></br>
**Airbnb, Inc.** is an American San Francisco-based company operating an online marketplace for short-term homestays and experiences. The company acts as a broker and charges a commission from each booking. The company was founded in 2008 by Brian Chesky, Nathan Blecharczyk, and Joe Gebbia.
## Problem Statement
1. **Problem Statement**: Identify the factors that could help maximise profit on Airbnb
2. **Motivation:** Help Airbnb hosts get a better idea on how to maximize profits for their Airbnb listings
3. **Hypothesis:**
* The type of property and amenities will have a positive correlation with listing price
* The location of property will also affect listing price
* Variables related to the listing's review will affect listing price
## Libraries used:
1. **NumPy:** Library for Numeric Computations
2. **Pandas:** Data Acquisition and preparation
3. **Matplotlib:** Low-level library for Data Visualization
4. **Seaborn:** High-level library for Data Visualization
5. **Wordcloud:** Create word cloud
6. **Folium:** Visualization of data on map
7. **Geopandas:** Handle geojson data to generate chloropleth maps
8. **Sklearn:** Machine Learning
# Dataset Importing and Data Cleaning
Our dataset is very large with 73 columns, hence, we have to first apply the pandas info method to get an overview of the columns that we are dealing with. By analysing the description of the columns, we can exclude the columns that are obviously not relevant to our problem.
* ### Initial Visual Data Cleaning
> We looked through the columns of our dataset and pick up the obviously redundant columns to drop such as the host identification number. This is shown in detail in the notebooks [EDA_First25](https://github.com/isaacchunn/SC1015_MiniPrj_Airbnb/blob/main/EDA_First25.ipynb), [EDA_Middle23](https://github.com/isaacchunn/SC1015_MiniPrj_Airbnb/blob/main/EDA_Middle23.ipynb) and [EDA_Last25](https://github.com/isaacchunn/SC1015_MiniPrj_Airbnb/blob/main/EDA_Last25.ipynb).
The general utility functions we have made will assist in removing outliers in our data.
We will also be dropping NULL values when NULL values do not mean anything in the column or that the number of NULL values are too small for the column. An example would be dropping null rows for host_location as an Airbnb listing should have a string that contains the location name that corresponds with it.
# Exploratory Data Analysis
We will look into univariate and bivariate EDAs concerning the interesting or important variables that we have identified.
We will be looking at the variables that are left after dropping the columns from our visual analysis. This is divided into [EDA_First25](https://github.com/isaacchunn/SC1015_MiniPrj_Airbnb/blob/main/EDA_First25.ipynb), [EDA_Middle23](https://github.com/isaacchunn/SC1015_MiniPrj_Airbnb/blob/main/EDA_Middle23.ipynb) and [EDA_Last25](https://github.com/isaacchunn/SC1015_MiniPrj_Airbnb/blob/main/EDA_Last25.ipynb). We conducted EDA on the remaining columns to confirm which columns are interesting or useful for our prediction.
### Initial EDA findings
We analysed the columns of our dataset to find out if the columns provide any meaningful insight for our project and also find out which columns would be useful for more in-depth analysis.
#### <ins>EDA_First25</ins>
> host_location, ho</ins>st_location, host_is_superhost, host_verifications, host_response_rate have a very skewed data with 90% of the rows having the same output for each column respectively. Hence, we will drop these columns.
#### <ins>EDA_Middle23</ins>
> The variable beds which describes the number of beds available is unbalanced as a huge majority of listings only has 1 bed available. Therefore, we will drop the beds column.
#### <ins>EDA_Last25</ins>
>The variables that are review related are skewed on the high end and is imbalanced, hence they shall be dropped. We believe that license should be dropped as it is not necessary to have an Airbnb listing. A majority of host chose not to enable instant booking, which results in high False outputs for the column instant_bookable.
## Uni-Variate EDA
For the remaining EDA, kindly refer to [Airbnb_Visualization](https://github.com/isaacchunn/SC1015_MiniPrj_Airbnb/blob/main/Airbnb_EDA_Visualization.ipynb) for detailed code and explanation. The purpose of this part is to find interesting/useful insight of each column.
Below is an example of our findings during our uni-variate EDA of amenities:
**This wordcloud describes the amenities present in the Airbnb listing**
>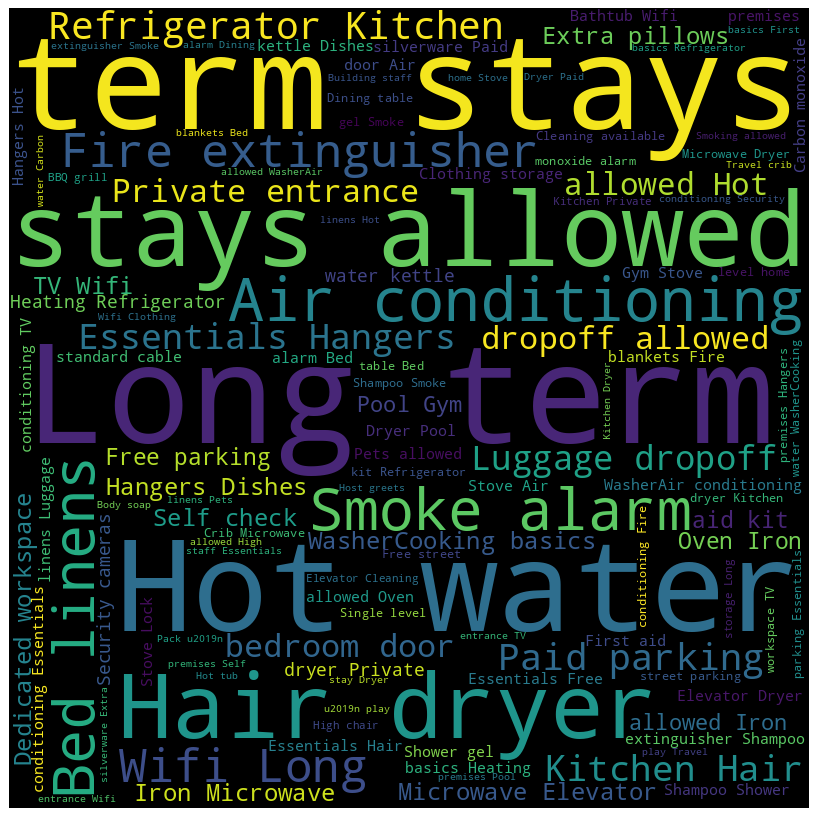
Many properties have amenities that allow long term stays, have air conditioning, as well as hot water, hair dryers and smoke alarm. This means that most properties that are on listing have these basic amenities.
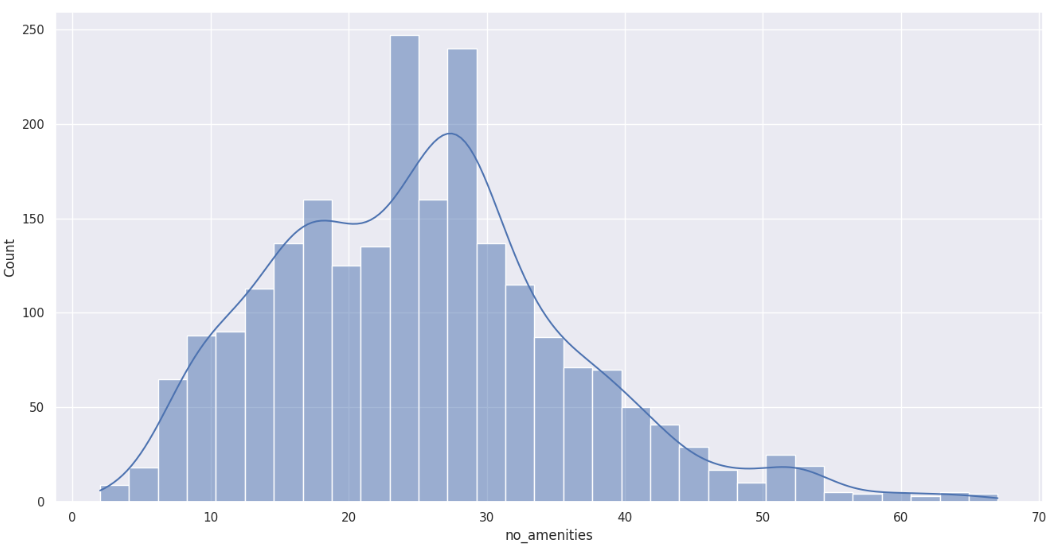
**This histogram plot counts the number of amenities present in the Airbnb listing**
>
>
Looking at the number of amenities in a given Airbnb listing, we can see that this column has potential to being one of the predictors, with it being following a decent distribution, we will compare it to price later in our bivariate exploration.
## Bi-Variate EDA
We will be using price as a response for simplicity. Let's talk a look at an example using number of amenities. The remaining parts will be in our notebook.
> 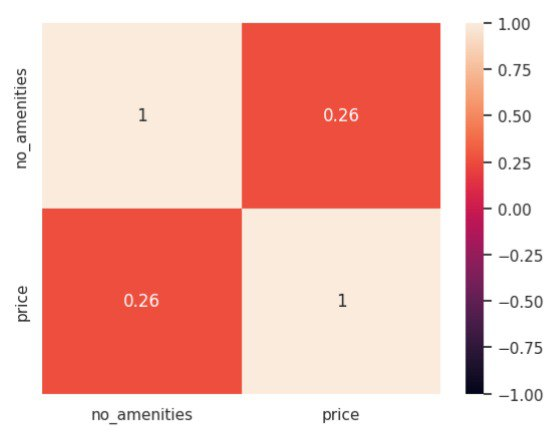
**We found that the correlation heat map of amenities vs price show that there is a weak correlation between number of amenities and price.**
# Machine Learning
The notebooks for this part is [Regression.ipynb](https://github.com/isaacchunn/SC1015_MiniPrj_Airbnb/blob/main/Airbnb_Regression.ipynb) and [Machine_Learning.ipynb](https://github.com/isaacchunn/SC1015_MiniPrj_Airbnb/blob/main/Airbnb_Machine_Learning.ipynb) which will include the code and more detailed information.
We split the dataset into train and test sets of 80:20 ratio for our machine learning model.
### Models that we used:
1. Linear Regression
2. Ridge Regression
3. Lasso Regression
4. Gradient Booster
5. XGBoost
6. KMeans
7. Random Forest
### One-hot Encoding (OHE)
We have decided to apply One-Hot Encoding to our categorical data to aid us in training such data using our machine learning models.
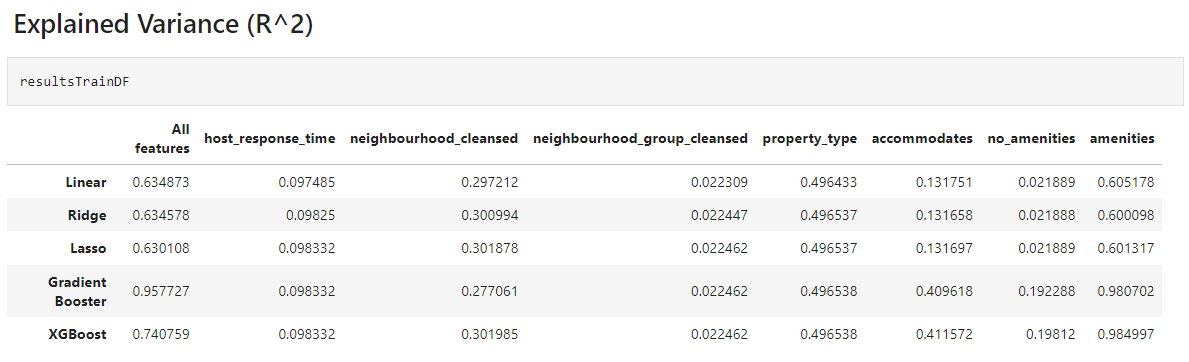
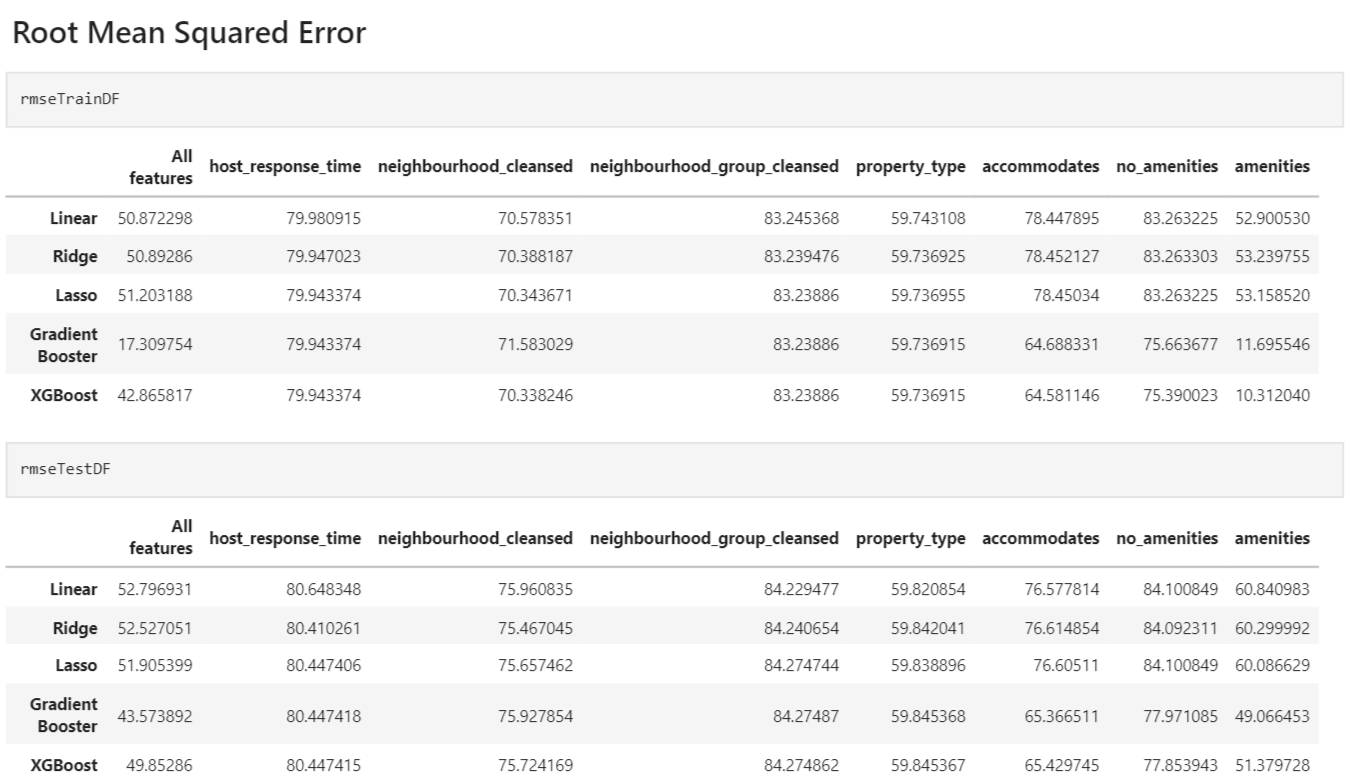
## Analysing the different models
---
---
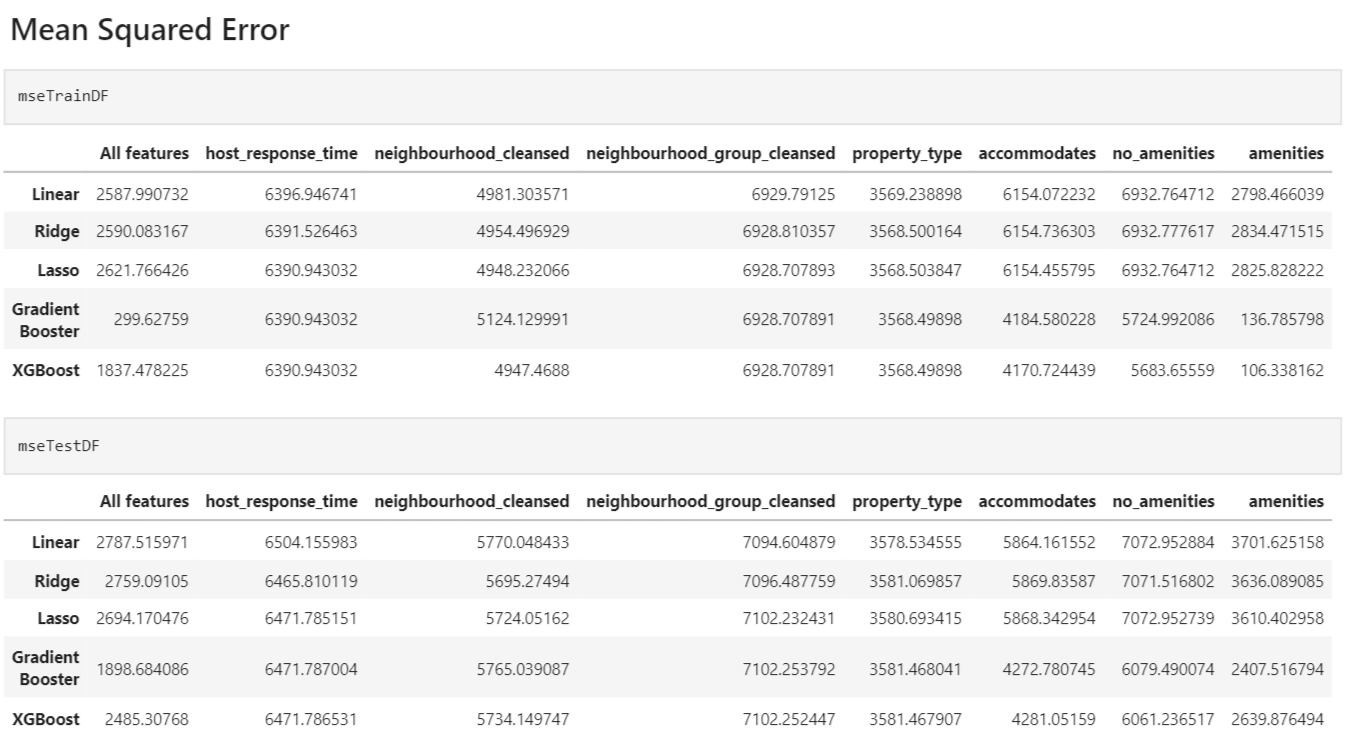
### <u>Insights</u> :
1. For our linear models, they performed very similarly for each respective columns. We notice that a few of our columns might not have linear relationship with price. However, we have noticed that **Lasso Regression** did the best as the explained variance was the highest amongst the 3 models and that it had the lowest mean squared error of the 3 models.
2. Overall, **Gradient Booster** worked the best with an explained variance of 0.73 and a mean squared error of ~1900. This suggest that most of our data do indeed have non linear relationship with price.
3. The most prominent column would be **amenities**, where it has a huge correlation with price. The second would be **property_type**, which means that these 2 columns have some impact on our price.
# Extra ML Models
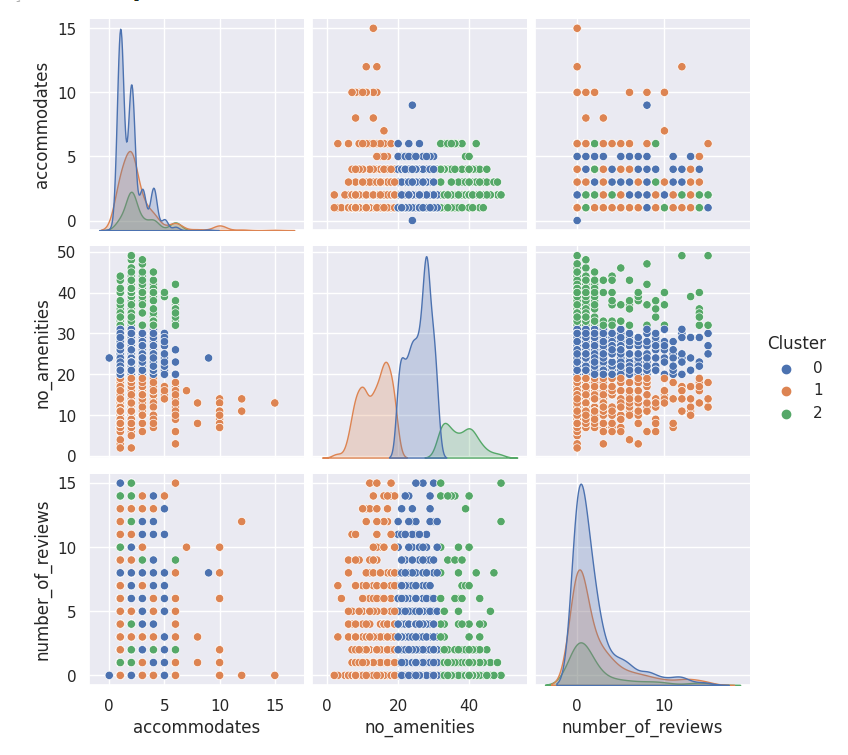
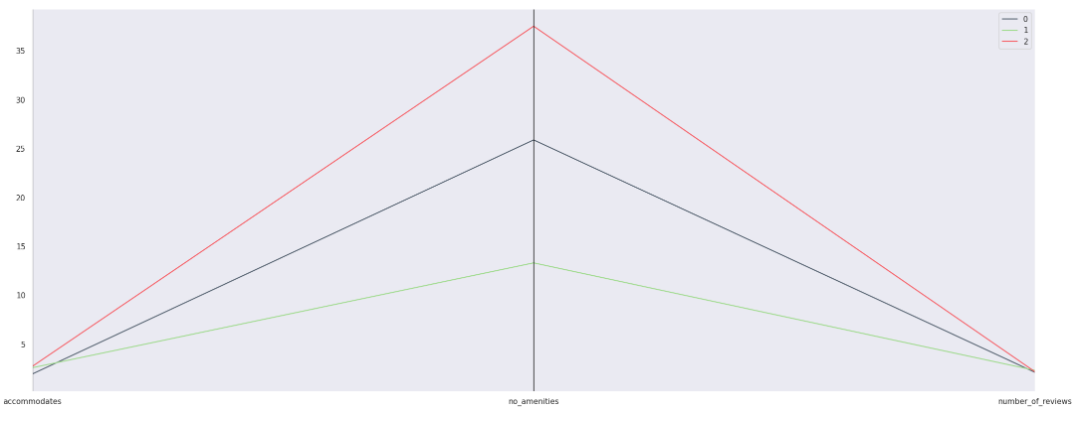
## Multi-variate K Means
<br></br>
<br></br>
We can infer from this that although no_amenities does not have a linear correlation when conducting our regression, this shows that no_amenities does affect our price predictions when they are in their clusters.
## Random Forest
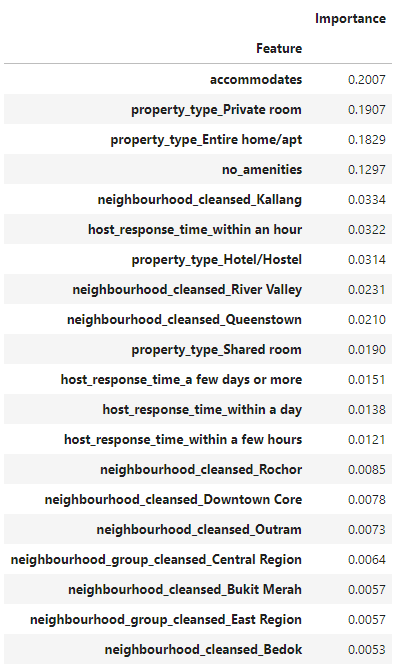
The top few important features in our classification was property_type, accommodates and no_amenities. This means that our initial findings during our KMeans for no_amenities might be beneficial in identifying trends was accurate. This also shows that our data is very categorically inclined.
### Classification Report
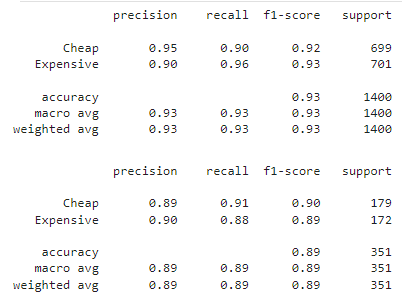
# Conclusion
1. The dataset was very categorically inclined and did not have significant linear relationships
2. Random Forest and Gradient Booster are the most suitable for our data set
3. Gradient Booster was better as it was able to identify non-linear relationships
4. property_type and amenities of a listing are significant features that affect price
**In order for hosts to maximise their profits and create higher-price listings, they should prioritise listings that have:**
- The property type "Entire apt/house"
- Higher numbers of amenities nearby their listing
- A good number of accommodates
- The location of the listing
The above features generally tend to have higher price and allows potential airbnb hosts to maximise their profits
# Video Presentation
[](https://www.youtube.com/watch?v=qkc-gP21zI0&ab_channel=Shaiie)
# Task Delegation
### J'sen Ong Jia Xuan
* EDA : [EDA_First25.ipynb](https://github.com/isaacchunn/SC1015_MiniPrj_Airbnb/blob/main/EDA_First25.ipynb)
* ML : Ridge Regression, XGBoost
* Presentation
* Data Visualization
### Isaac Chun Jun Heng
* EDA : [EDA_Middle23.ipynb](https://github.com/isaacchunn/SC1015_MiniPrj_Airbnb/blob/main/EDA_Middle23.ipynb)
* ML : Gradient Booster, KMeans, Random Forest
* Presentation
* Data Visualization
* GitHub Repository
### Tang Teck Meng
* EDA : [EDA_Last25.ipnyb](https://github.com/isaacchunn/SC1015_MiniPrj_Airbnb/blob/main/EDA_Last25.ipynb)
* ML : Linear Regression, Lasso Regression
* Presentation
* Data Visualization
# Beyond our Course
### Visualizations :
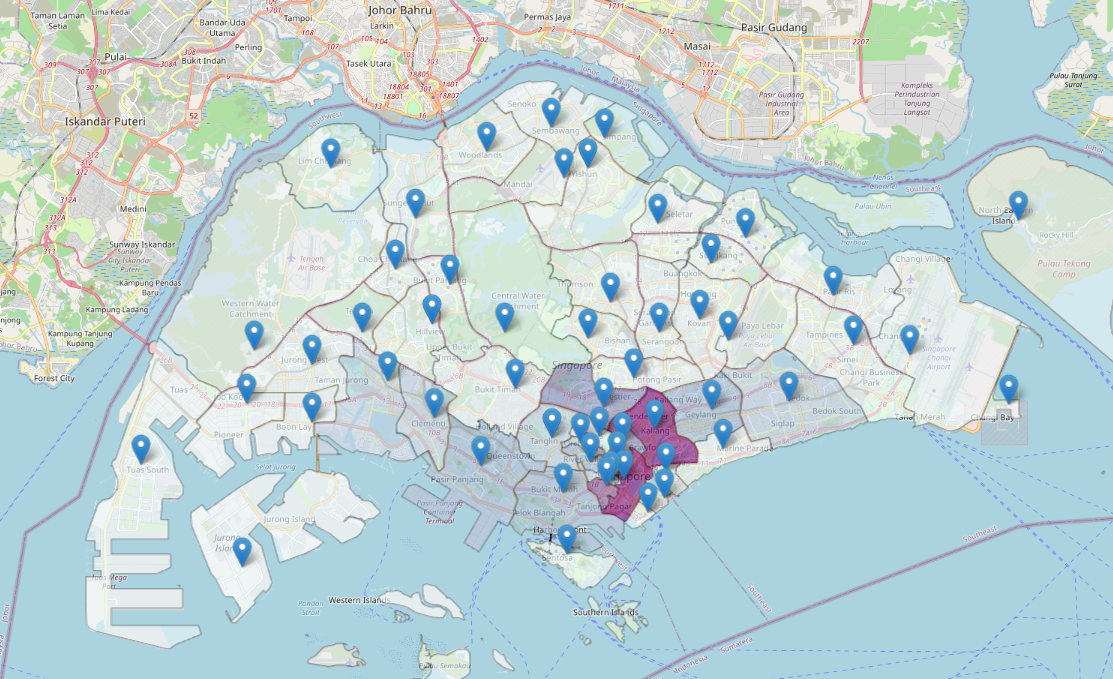
- **Folium Map**
>
- **WordCloud**
>
### Machine Learning :
* K-Means
* Lasso Regression
* Ridge Regression
* Gradient Booster
* XGBoost
# References
* https://scikit-learn.org/stable/modules/generated/sklearn.linear_model.Ridge.html
* https://scikit-learn.org/stable/modules/generated/sklearn.ensemble.GradientBoostingClassifier.html
* https://xgboost.readthedocs.io/en/stable/python/python_intro.html
* https://medium.com/@jjosephmorrison/one-hot-encoding-to-set-up-categorical-features-for-linear-regression-6bac35661bb6
* https://realpython.com/k-means-clustering-python/
* https://machinelearningmastery.com/how-to-transform-data-to-fit-the-normal-distribution/
 Sign in with Wallet


