# Environmental Metagenomics Workshop at DIBSI
> [Back to the Workshop Main Page](http://2017-dibsi-metagenomics.readthedocs.io/en/latest/toc.html)
## Table of Contents
* [Day 1](#day-1)
* [Day 2](#day-2)
* [Day 3](#day-3)
* [Day 4](#day-4)
* [Day 5](#day-5)
## Day 1
### [Launching a Jetstream Instance](http://2017-dibsi-metagenomics.readthedocs.io/en/latest/jetstream/boot.html)
* [Setting up Secure Shell (SSH)](https://angus.readthedocs.io/en/2017/jetstream/login.html#)
### [Command Line Tutorial](http://2017-dibsi-metagenomics.readthedocs.io/en/latest/command-line.html)
* Additional Online Resources
* [ANGUS 2017 Workshop Material](https://angus.readthedocs.io/en/2017/toc.html)
* [Beginners Bash Scripting](https://help.ubuntu.com/community/Beginners/BashScripting)
* [Learn Markdown](http://www.markdowntutorial.com/)
### [Running BLAST from the command line](http://2017-dibsi-metagenomics.readthedocs.io/en/latest/running-command-line-blast.html)
> Reading for tomorrow: [Banfield Paper](http://mbio.asm.org/content/7/1/e01669-15.full)
## Day 2
### [Short read quality and trimming](http://2017-dibsi-metagenomics.readthedocs.io/en/latest/quality.html)
### Interleaving reads
- Software: khmer or PEAR (Paried End Read Merger)
- http://khmer.readthedocs.io/en/v2.0/user/scripts.html#scripts-read-handling
#### FASTQ Files
[Wikipedia to converting phred score](https://en.wikipedia.org/wiki/Phred_quality_score)
* 1st Line
* Identifier / Header line with information about how the read was generated (sequencing machine details or database file address)
* 2nd Line
* Sequence Base calls
* 3rd Line
* Always a +
* 4th Line
* Phred Quality Score endoding
* S - Sanger Phred+33, raw reads typically (0, 40)
* X - Solexa Solexa+64, raw reads typically (-5, 40)
* I - Illumina 1.3+ Phred+64, raw reads typically (0, 40)
* J - Illumina 1.5+ Phred+64, raw reads typically (3, 40)
with 0=unused, 1=unused, 2=Read Segment Quality Control Indicator (bold)
* L - Illumina 1.8+ Phred+33, raw reads typically (0, 41)
* info from [Wikipedia FASTQ page](https://en.wikipedia.org/wiki/FASTQ_format#Encoding)
* ASCII = American Standard Code for Information Interchange. Or: map the numbers 0-127 to the upper and lower case letters in the English alphabet, the numbers, and some basic symbols.
#### Why we remove data
Sometimes there are low quality reads or adapters in our data. We want to remove those before assembly.
#### Jupyter Notebook is a virtual environment
We sometimes want to look at our data as we are running it. Using Virtual Environments turns our browser into an interactive work environment so we can see outputs as we run programs. Otherwise, we would have to download our output and open in our local environments.
## Trimmomatic
__The Trimmomatic user manual can be referenced at__ [USADELLAB.org](http://www.usadellab.org/cms/?page=trimmomatic)
**ILLUMINACLIP:** <fastaWithAdaptersEtc>:<seed mismatches>:<palindrome clip threshold>:<simple clip threshold>
* **fastaWithAdaptersEtc:** specifies the path to a fasta file containing all the adapters, PCR sequences etc. The naming of the various sequences within this file determines how they are used. See below.
* **seedMismatches:** specifies the maximum mismatch count which will still allow a full match to be performed
* **palindromeClipThreshold:** specifies how accurate the match between the two 'adapter ligated' reads must be for PE palindrome read alignment.
* **simpleClipThreshold:** specifies how accurate the match between any adapter etc. sequence must be against a read.
### Genome Assembly - Titus Brown
Q. What good are metagenomes? Genes in genomes don't do anything until transcribed and translated
A. understanding capacity, e.g. lack of nitrificaton genes suggests this is not happening in this community (within limits of detection/analysis)
Some back of the envelope thinking about why metagenomes:
Bacterial/archaeal genome size ~5MB
Number of genes ~5k genes
average size of genes ~1kb
TarA = TargetA:
**Q: How can we identify TarA within an environmental sample?**
**A: Design PCR primers specific to TarA**
Total DNA Extraction -> PCR of TarA -> PCR sequencing library -> quantify abundance of tarA in the environmental sample.
This does not provide insight into what else is within the community.
Could apply this approach targeting the 16S rRNA gene, then you could get an idea of the abundance of bacterial OTUs within the environmental sample.
* **Q: What is another approach to getting information regarding the tarA gene?**
* **A: Look at the gene expression data (extract RNA, convert to cDNA, do PCR)**
* **Q: What if the expression of tarA is regulated temporally?**
* **Alternative strategy** is to perform shotgun sequencing of the total DNA extraction.
* Generally, there are high abundance sequences and low abundance sequences.
* How much sequence data do we need to generate 50 Mb of genomic DNA?
* We have the problem that sequencing is random
* Poisson random sampling
* fraction of marbles seen vs. number of samples taken
* For any process where you are random sampling from a given population, you will always generate an asymptotic curve.
* What shape does this curve have and how to I get to 99%?
* Why does the curve saturate?
* Eventually you will start pulling out samples that consist of all marbles you have already seen (finite number of different marbles in the pool)
* To sample 50 Mbp, the number is _**100X**_
* Want to reach into the box 100 times for every base you want to sample.
* Sample for shotgun metagenomics is a read, not an individual base
* If we want to say how many reads do I need to get 100X coverage of 50 MBp:
* (50 Mb) / 100 read length * 100 = 50e6 reads

* Estimating Abundance [Rodriguez et al. ISMEJ 2014](http://www.nature.com/ismej/journal/v8/n11/full/ismej201476a.html)
A major complication of metagenome assembly is strain level variation.
Soil - 20-50 Gb metagenomes... requires a lot of sequencing depth to get the appropriate coverage.
**Q: How does shotgun sequencing work?**
1. Take mixture of everything in your DNA extraction, fragment all the DNA.
* typically between 300-600 bp
* They should all be of similar size (Fairly closely size selected)
* if not, introduce a systematic bias (Smaller fragments will preferentially amplify over larger library molecules)
2. For each blunt ended fragment, attach sequencing primers on either end
3. Feed into Illumina machine, which sequences one or both ends of fragment
* Numer of "reads" out of an Illumina machine is number of fragements sampled (this matters when considering Single End or Paired End reads)
* Paired end sequencing, get twice as much data, but you will pay twice as much
* Q: What makes Paired End Sequences overlap?
* A: the size of the insert fragment and the length of the reads.
* _**Note**_: These fragments are randomly chosen; on average tend to sample evenly from every mlecule in your sample.

**Q**: I generated 50e6 reads -> 5Gb of sequence data, to find one gene within a sea of genes, and the population was low complexity... so was it worth it to spend all this money on sequencing the entire metagenome to 100X coverage just to find info on tarA?
**A**: PCR amplicon sequencing is a better strategy that is more practical to finding out information on tarA
PCR based amplicon sequencing will me much less expensive than shotgun sequencing of the entire DNA extraction.
#### Assembly of metagenome assemblies
**Q:** what does MG-RAST do to your metagenome reads?
* There are few proteins that have a single signature domain. most proteins have multiple domains that indicate their function.
* The problem is we want longer continuous strings of sequence data from the short reads so we can infer meaning from the sequence data.
#### *de novo* Assembly

* Modern day reference genomes are all constructed using what is called *de novo* assembly.
* An assembly allows you to predict genes, finding genes is called annotation, you can count abundances as well.
* There are multiple assembly strategies
* **Overlap Layout Consensus**: regions of reads are pieced together to create a longer sequence.
* **De Bruijn Graph Assembly**: which reads have significant overlaps to generate contiguous sequences?
* trying to find chunks of sequence where many different reads map together and agree with each other.
* No one really knows how computers work.
* one thing you find when you run assemblers is that you can change one parameter and get a different answer.
* evaluate the output and see if you trust it.
* requires controls and validation.
* validate with molecular biology?
* hard to get to a conclusion in a solely computational manner.
* Q: What are the major criteria in evaluating a genome assembly?
* How complete is the assembly?
* How accurate is the assembly?
* How precise is the assembly?
* Broadest possible question?
* How well does what came out of the box match what went into the box.
* Genome assemblers are kind of like a black box. Do you really know if the assembler used all of the reads?
* What if you only sampled half of the genome in the first place?
* Let me see if the reads map back to the assembly that was generated from the assembler.
* Map all reads that were fed into the assembler back to the assembly that was generated by the assembler.
* What if some reads map to nothing...
* 
* what could have gone wrong?
* Assume the assembly is 100% correct, but there is a read that doesn't map to the assembly.
* The read could be highly erroneous. Assembler identified tha tthe read is erroneous and did not include it in the assembly.
* Really stringent quality control = throwing out a lot of good data.
* Really relaxed quality control = higher change of getting erroneous reads incorporated into assemblies, of erroneous reads that get recognized and removed by the assembler.
#### Strain level variation in a metagenome

* This can be problematic for genome assembly because there are reads that correspond to regions that are similar but many reads that are slightly different and interspersed within the same genomic region.
* A defining characteristic of microbial communities is that they are not pure cultures, they are comprised by many different microbial organisms.
> You can assume that your assembly is 99% for the most part, your downfall will be assuming that it contains everything in your sample.
#### Vocab
DNA -> fragments 300 - 600 bp -> sequence ends of fragments, each end of the fragments gives a read (150-250 pm) (in paired end sequencing)
#### Some questions that can be asked regarding metagenomes
1. What functional genes are there?
2. Which organisms have those genes within the community?
3. What genes are doing function X?
4. Community composition across space/time.
5. Control vs. sample difference in function.
6. What organism is doing fuction X?
7. What is novel within the metagenome?
- Function of dark sequences
__Workflow__
Shotgun metagenomics --> assembly --> gene annotation --> spreadsheet
spreadsheet:
|gene name|sample|abundance|organism|
|-|-|-|-|
|nirK| |1000|Species A|
|nirK| |20|Species B|
If you cold get a table that has all of the information above, would be able to potentially answer the list of questions above.
This would be a good starting point to answering the biological questions of interest.
* **Q:** Which columns of the spreadsheet depend the most on the quality of the metagenome assembly?
* **A:** Gene name and Organism
#### Back to shotgun metagenomes and assemblies
shotgun metagenome --reads---> assembly --contigs---> Evaluate contigs that belong to different species (i.e. **Genome Binning**)
__Will be making inferences from the assemblies__, but now have to ask, __How good is the assembly__?
### Metrics for evaluating metagenome assemblies
1. Percent of reads that map to the assembly.
* For environmental metagenomes, 20-60% of the reads will map back to the assembly.
* The high abundance organisms are going to be those that show up the most within your metagenome assembly
* abundance weighted, diversity within the sample
2. Total amount of sequence that was assembled.
* how many contigs were generated?
3. Ask for non-abundance weighted inclusion
* metric 1 is weighted by abundance of organisms
* unique sequence, abundance weighted sequence
* Sourmash (k-mer inclusion)
* looks at how much of the richness in your sample was recovered.
> There is low variability in the % of reads that map to the assembly among assemblers.
> It is worth trying one or two assemblers...
> There is no one true way of doing metagenomics analysis
> We have strategies to attempt to answer complex biological questions.
The sensitivity of our assembly and our analysis is a contentious issue.
If your problem depends on needing access to cheaper sequencing, have no fears because sequencing approaches continue to improve daily.


## Day 3
### Assembling your data with Megahit
With Harriet Alexander
#### Downloading/compiling software
1. We use a program called `git` to download a program called megahit from GitHub.
2. Then we use a command `make` to compile that software.
#### Using GitHub / sharing code
**Q.** Why use GitHub for publically posting code instead of archiving with Zenodo (and assigning an Orchid ID).
**A.** Github is Version tracking- recording changes rather than an archived snapshot that could be connected with
**Q.** Is archiving better than simply providing code as a suplemental?
**A.** Eh... From the perspective of someone trying to reproduce your research, "Anything is better than nothing"
#### File formats for storing sequence data
- Paired-end vs. interleaved:
- We can store mate pairs in two different files, frequently labeled with R1 and R2, or we can "zip" them together into an interleaved file.
- Why care? Each assembler has certain requirements about what format to input your data.
#### Comparing assembly pipelines
1. [**Critical Assessment of Metagenome Interpretation (CAMI) challenge 2016**](http://www.biorxiv.org/content/biorxiv/early/2017/01/09/099127.full.pdf)
*Comparison using mock communities from isolate*
2. [**Vollmer et al 2017**](http://journals.plos.org/plosone/article?id=10.1371/journal.pone.0169662) “Comparing and Evaluating Metagenome Assembly Tools from a Microbiologist’s Perspective - Not Only Size Matters!”
*Comparison using experimental (real) metagenomic data*
3. [**Awad et al 2017**](http://www.biorxiv.org/content/early/2017/06/25/155358) “Evaluating Metagenome Assembly on a Simple Define Community with Many Strain Variants”
### MEGAHIT
**Q**: What do the output headers mean?
**A**: https://github.com/voutcn/megahit/issues/54
#### How good is your assembly?
[Here are few slides](https://docs.google.com/presentation/d/1VLuVzgYnF-igQX3TzoNOLeeJp52t4PSMIJllE9RLM4A/edit?usp=sharing) with some thoughts from yestereday and today!
##### N50
```
----8---- -----10-----
---6--- -------15-------
-----11-----
Add together length of all contigs = 50
Divide by 2: 50/2 = 25
Sort the contigs from shortest to longest:
6,8,10,11,15
Start adding the lengths until the value is 25 or higher
6 + 8 = 14 + 10 = 24 + 11 = 35
11 is our N50, more than 1/2 of the nt in the entire assembly are included by including contigs at or below length 11.
```
Lot's of 16S databases to choose from:

#### Mapping Tutorial
Burrows-Wheeler Aligner
http://bio-bwa.sourceforge.net/
It is the standard mapping algorithm for most bioinformatics tools. There are two types of aligners:
* bwa aln - reads shorter than 70 bp
* bwa mem - reads greater than 70 bp
It requires a reference to align to, which is usually an indexed reference genome in fasta format, (or a de novo assembled metagenome in the case of environmental metagenomics.)
The reference fasta is indexed by running
* bwa index
Bwa index takes our reference fasta and creates a "dictionary", or a searchable compressed format which is similar to the yellow pages analogy. Having an index will speed up the time it takes the aligner to find a match.
Another aligner: http://bowtie-bio.sourceforge.net/index.shtml
#### Samtools
http://samtools.sourceforge.net/
Samtools is the program we use after creating an alignment in order to determine a few different pieces of information about **how** our sequences aligned. For example, did the forward and reverse reads align? Did the forward read align in the same direction which it was read in? Is it the primary, or best, alignment, or a secondary alignment.
This information can be read directly from the second column of the sam (human readable) file. These are called "bit flags", and you can find out about what flags mean by this nice website here: https://broadinstitute.github.io/picard/explain-flags.html
Samtools options:
* samtools view - provides human readable output from the binary-compressed bam files and can be used to convert from sam to bam and bam to sam.
* samtools merge - merges bam files (used in variant analysis) - in metagenomics you may have run several lanes of data that belong to the same sample, which you may end up merging
* samtools faidx - in order to use the IGV viewer or samtools tview to look at your aligned bam files in relation to your reference, you need to index the reference using this option.
* samtools index - in order to use the IGV viewer or samtools tview to look at your aligned bam files, you also need to index all of your bam files (after sorting and deduplicating)
* samtools sort - sorts a bam file
* samtools rmdup - deduplicates (removes PCR optical duplicates)
* samtools mpileup - converts sam file into pileup format
* samtools tview - visualizes your alignments on the command line
* samtools import - old version of the commmand bamtk import
*Usage: bamtk import <in.ref_list> <in.sam> <out.bam>*
Example of tview 
#### IGV Viewer
http://software.broadinstitute.org/software/igv/
A way to look at how your reads mapped to your reference in real time. It can be downloaded to your desktop or run inside a web browser using java.
Example of IGV Viewer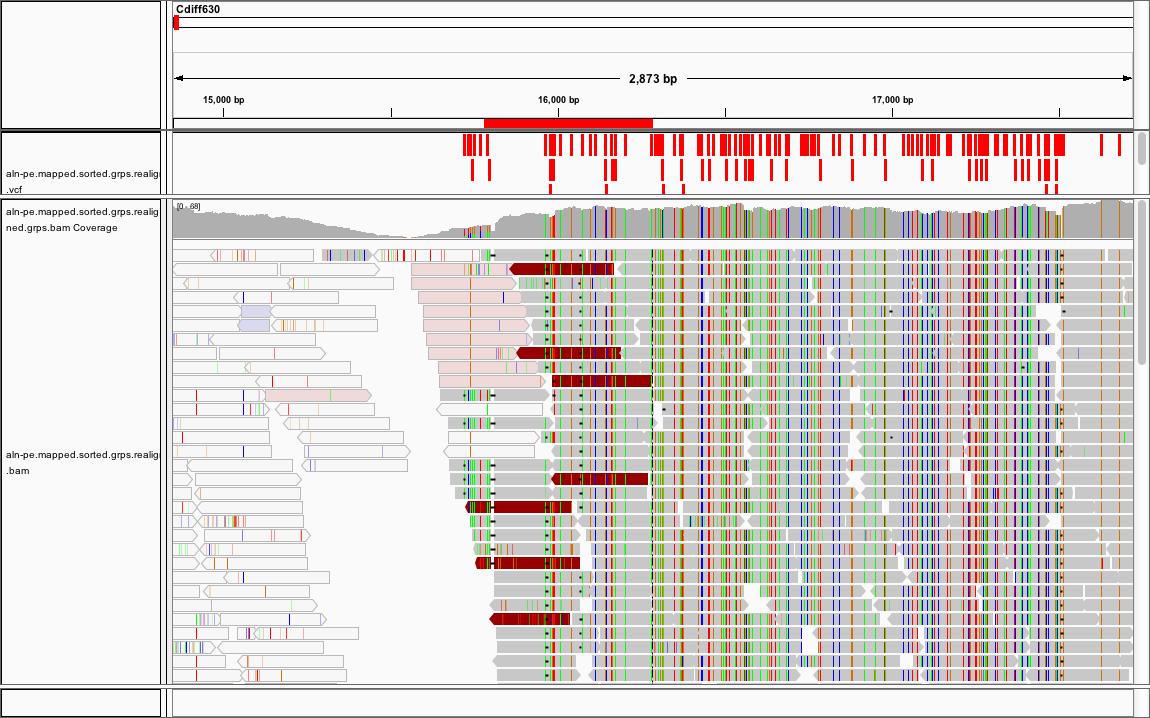
If you want to try the IGV Viewer with the data we just generated, you will need to download the files to your desktop and start IGV viewer. **WARNING:** Indexed bam files are very large.
### Sourmash
**Compute**
Kmers --> unique kmers --> murmur hash --> file --> signature
**unique kmers** implies that each kmer is unique and only occurs once within the input dataset (fastq file or assembly)
**--scaled 10,000** flag tells sourmash to only use 1 kmer for every 10,000 kmers generated.
**-k** flag tells sourmash the size of the kmer
#### What is inside the signature files?
```head -100 ecoli-genome.sig```
> Sequencing errors can contribute to differences between running sourmash search when looking for the percentage of reads within the genome assembly and the percentage of the assembly within the reads.
#### SBT_Gather output
* overlap - what fraction of genome hit is present in the queried dataset
* p_query - what percent of the query is comprised by the match
* p_match - what percent of the match is unique to the query
## Binning Metagenomes
[Concept slides](https://docs.google.com/presentation/d/1FJOSGp5QSmdnsgkSdJHsUiklSH-2X23RiYQMxIVW7Dc/edit?usp=sharing)
#### Why do we want to bin metagenomes?
1. Associating genes with organisms
2. Getting microbial diversity in sample
3. Interest in single organism that is difficult to cultivate.
#### Co-abundance
> The idea of abundance across multiple samples, or the coverage covariance between samples
## Day 4
#### Annotation with Prokka
Materials are here: [http://2017-dibsi-metagenomics.readthedocs.io/en/latest/prokka_tutorial.html](http://2017-dibsi-metagenomics.readthedocs.io/en/latest/prokka_tutorial.html)
It is recommended that Prokka is used to annotate non-eukaryotic sequences.
Why use Prokka over BLAST? Prokka is faster because it has a strategic search algorithm. Installation includes Prokka software along with loading databases.
Prokka will take in fasta files and output annotations.
Prokka focuses on functional annotation more than taxonomic annotation.
#### A note on taxonomic classification
Why is metagenomic data not as good for taxonomic identification vs amplicon libraries? Metagenomic data is shorter reads. Amplicon sequences are very well settled. The ribosomal RNAs used in amplicon sequenced are very conserved and well studied for taxonomy.
A metagenome has abundance variances. A complete sequence might not be acquired based on what was covered in a sequencing run. Additionally, a lack of data can't distinguish between specific organisms with out composite information.
#### Kraken
This will give taxonomic classification.
#### Quantification with Salmon
Salmon is designed for abundance estimation with transcriptome data sets. However, we will be using it for estimating gene coverage of relevant genes based on coverage.
Some plotting will be done in Jupyter notebook with pandas, which is the Python equivlent of an R dataframe
#### Correction to For loop command
```
for file in *counts
do
name=${file%%.*}
sed -e "s/count/$name/g" $file > tmp
mv tmp $file
done
paste *counts |cut -f 1,2,4 > Combined-counts.tab
```
#### Anvi'o tutorial
1.) Install google chrome
2.) Open your jetstream instance on chrome
3.) More Anvi'o training [Anvi'o events](http://merenlab.org/2016/08/18/events/)
4.) [Anvi'o tutorial on their website](http://merenlab.org/2016/06/22/anvio-tutorial-v2/)
Open the instance and install Anaconda -- another virtual environment that facilitates the installation of Anvi'o
* Say yes to approve
* Install in default location
* Anaconda hosts a lot of default packages, e.g. numpy
* It adds the path to your ~/.bashrc file which runs upon login. We need to rerun it to make sure it recognizes the path to Anaconda.
* ```source ~/.bashrc``` That way we don't have to open up a new window to get the .bashrc file to rerun and recognize the new path.
* It is installed correctly when ```conda``` typed at the command line brings up the options.
After running ```anvi-self-test -suite mini```, a black screen with colorful text appears. 'Q' to quit (?)
#### Anvi'o reformat
* Anvi'o needs fasta files in the correct format --> headers that are short and simple
* --min-len is set to 2000
better estimation of tetranucleotide frequency
```
grep ">" subset_assembly.fa | wc
9276 37104 369502
grep ">" anvio-contigs.fa | wc
1795 1795 28720
```
#### Remapping
We already mapped, why are we doing this?
* tossed out contigs
* renamed our contigs
It will take less time.
#### After summarizing Anvi'o samples
Make sure to save your samples before changing it in Anvi'o
```
cp -R MERGED-SAMPLES/ MERGED-SAMPLES-ORIGINAL/
cp -R SAMPLES-SUMMARY/ SAMPLES-SUMMARY-ORIGINAL/
```
#### Tips and Tricks
[Scikit learn](http://scikit-learn.org/stable/) is another place to learn about python tools for machine learning.
More tips: how much space am I using?
```
du
df -h
```
## Day 5


