# Smart Plant Monitor
**LNU-ID: vl222nf**
This is an IoT project with a soil monitor connected to a web dashboard, using several different environmental sensors to allow for estimates of water consumption of either a potted plant or an outdoor plant. It is connected to the Internet using WiFi, but could just as well have been connected using LoRa. This tutorial will describe how the project was carried out and how it can be replicated.
The estimated time to complete this project, will all equipment and code available is 6 hours if you have some experience and 10 hours if you have none.
This project was done as part of the course "[1DT305 - Introduction to Applied IoT](https://lnu.se/en/course/introduction-to-applied-internet-of-things/distance-international-summer/)" at [Linnæus University](https://lnu.se/en/).
You can find this project on [GitHub](https://github.com/villed3/1dt305-project/).
## Objective
Being able to track the water status of your plants would be very useful, would it not? It would be even more useful if you could see the typical rate of water consumption, and somehow determine in advance how much water your plants will consume based on weather forecasts. The next step would be to have an automatic or remotely controlled watering system.
I chose this project because it had been on my mind for a while because of my tendency to leave my apartment for longer periods as a student on distance. I generally tend to forget to water them even while being home, so even more reason.
Analyzing the measured data over longer periods of time in combination with weather data (temperature, humidity, air pressure and rain intensity) could give a very accurate insight about your vegetation. It would not be limited to just house plants and gardening, it could also be applied for agriculture, forestry and general park management.
Of course there are already plenty of projects like this already in production, but this project shows how easily an individual could implement something like this for personal use.
## Material
The components used in this project are listed below. Their usage and where to buy them is also listed.
| Picture | Component | Description | Can be bought from |
| -------------------------------------------------------------- | -------------------------------------------------------- | ------------------------------------------------------------------------------------------------------------------------------------------------------------------------------------------------------------------------------------------------------------------------------------------------------ | ----------------------------------------------------------------------------------------------------------------------------------------------------------- |
| 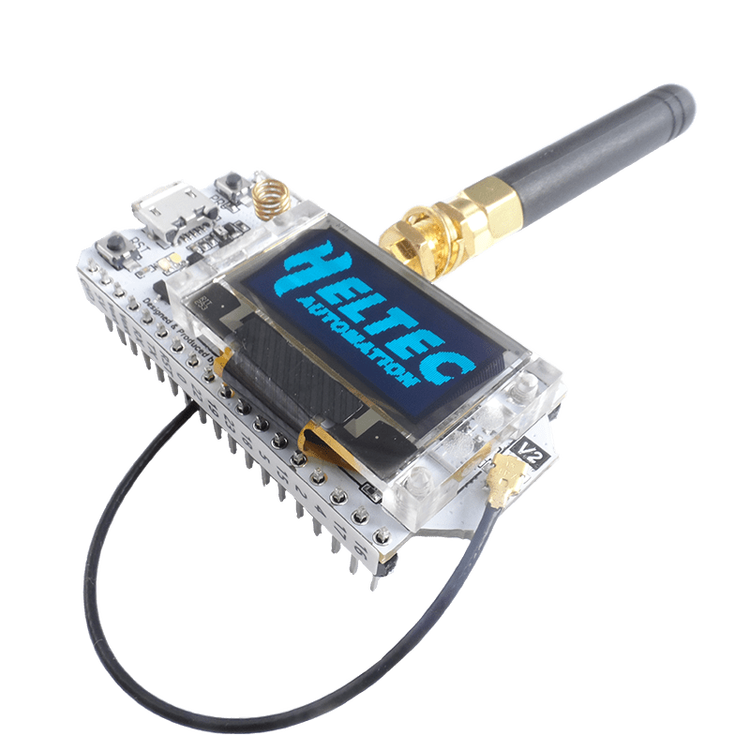 | Heltec WiFi LoRa 32 (V2) (w. pins and antenna) | Microcontroller (MCU) with an [ESP32](https://en.wikipedia.org/wiki/ESP32) microprocessor. Has a built-in 128x64 OLED display, a battery connector and a LoRa chip (with external antenna). Wireless capabilites include LoRa, WiFi, and Bluetooth (supports low energy). Requires soldering of pins. | [Amazon SE](https://www.amazon.se/gp/product/B08243JHMW/)<br/>€33.99 |
| 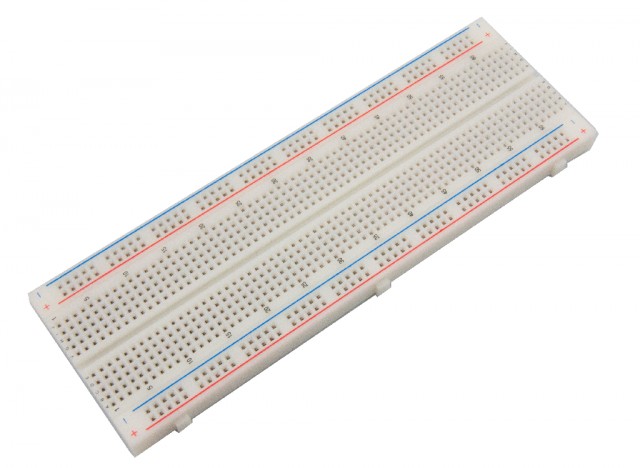 | Breadbord (full-size) | Solderless breadboard with 840 connections and polarity indicators. A smaller sized board could suffice. | [Electrokit](https://www.electrokit.com/en/product/solderless-breadboard-840-tie-points-2/)<br/>*(€7.38)* |
| 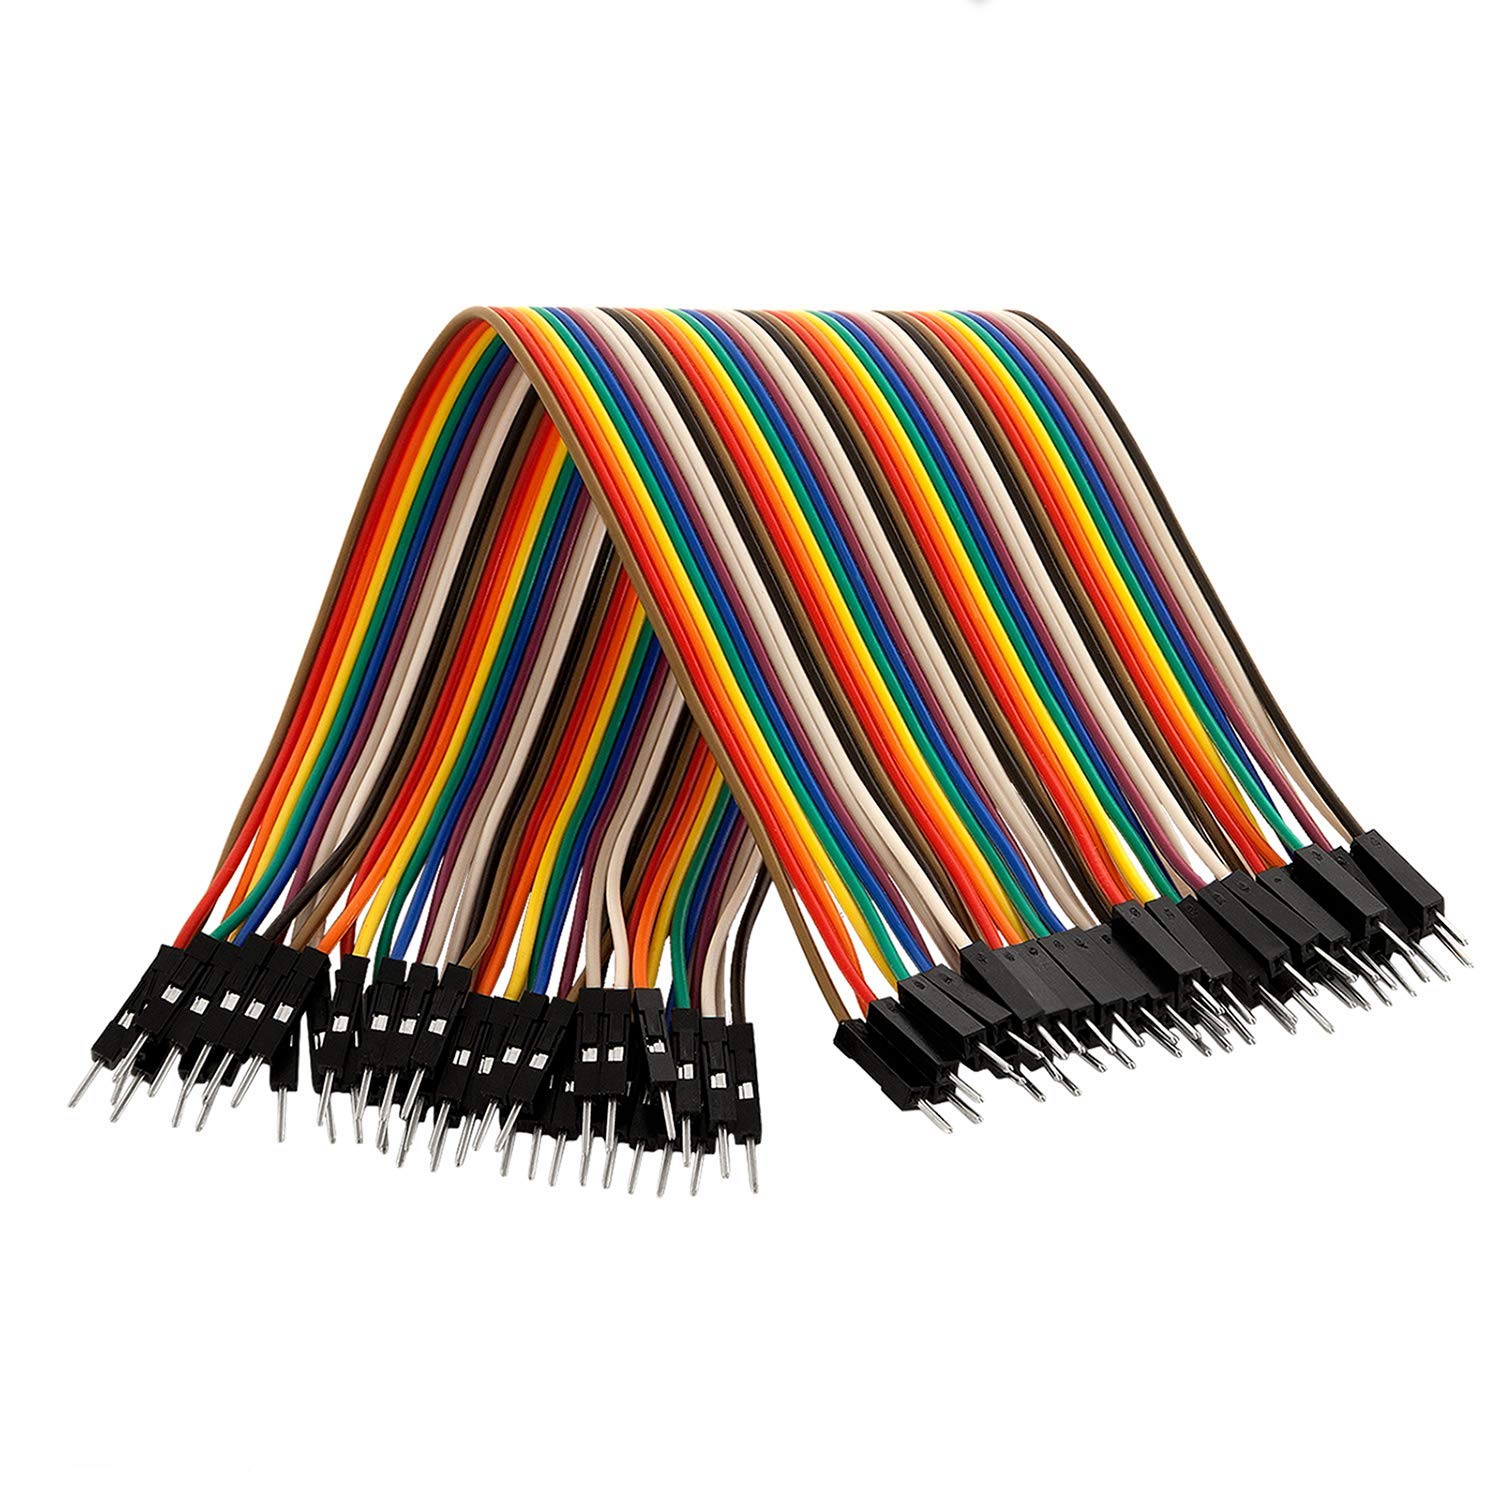 | Jumper wires | Wires to connect sensor with MCU on the breadboard. Only male-male wires are required. Shorter length breadbord wires can also be used to reduce clutter. | [AZ-Delivery](https://www.az-delivery.de/products/40-stk-jumper-wire-male-to-male-20-zentimeter)<br/>(40-pack, male-male) <br/>*(€3.79)* |
| 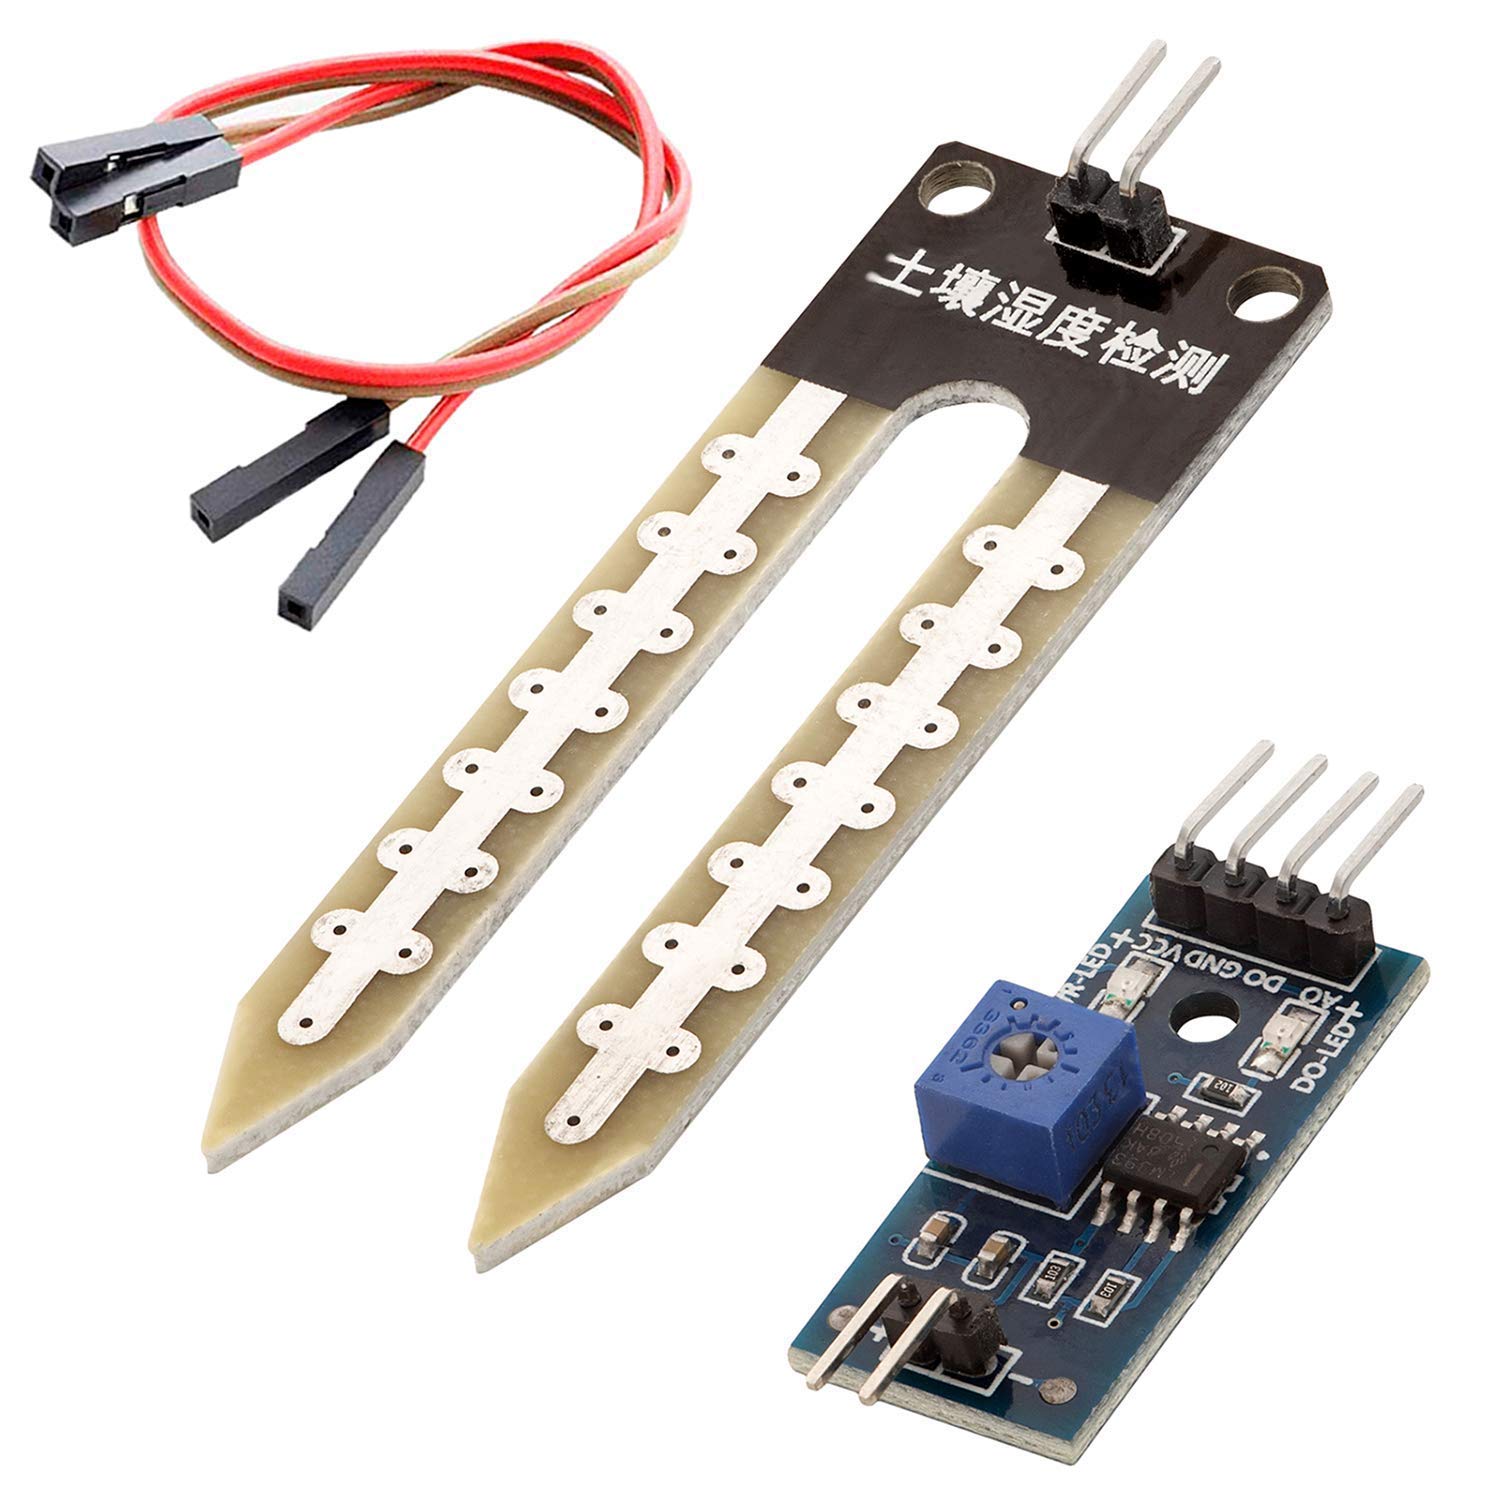 | Soil moisture sensor (w. comparator module) | Capacitive soil moisture sensor with a comparator module. A threshold can be set with the potentiometer on the comparator to provide a digital output, high or low, if the threshold is met or not. The comparator module also outputs the analog value directly. | [AZ-Delivery](https://www.az-delivery.de/products/feuchtigkeitssensor-modul)<br/>*(€4.49)* |
| 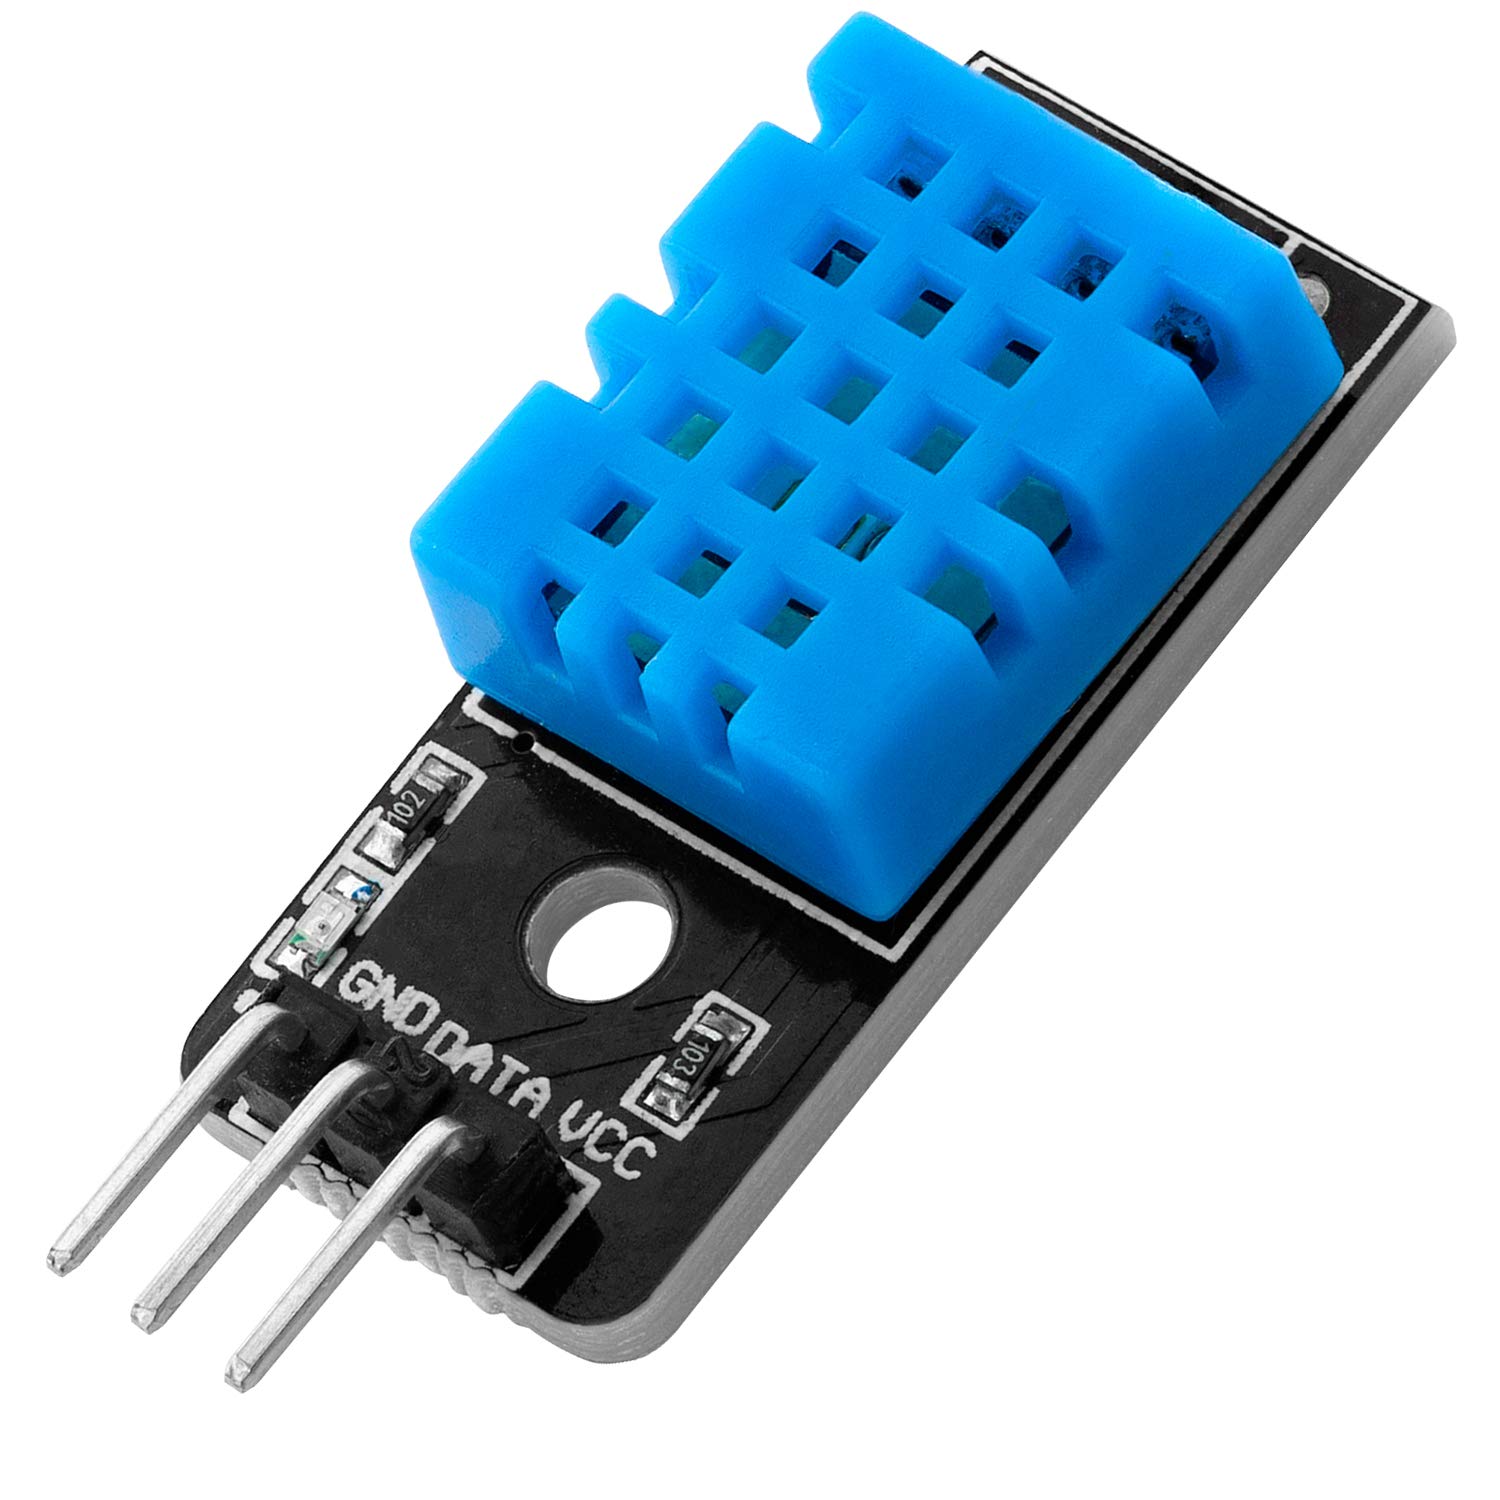 | DHT11 temperature and humidity sensor | Temperature and humidity sensor with low precision, connected with GPIO. Only used for humidity in this project, since the barometer provides temperature measuring. | [AZ-Delivery](https://www.az-delivery.de/products/dht-11-temperatursensor-modul)<br/>*(€4.99)* |
| 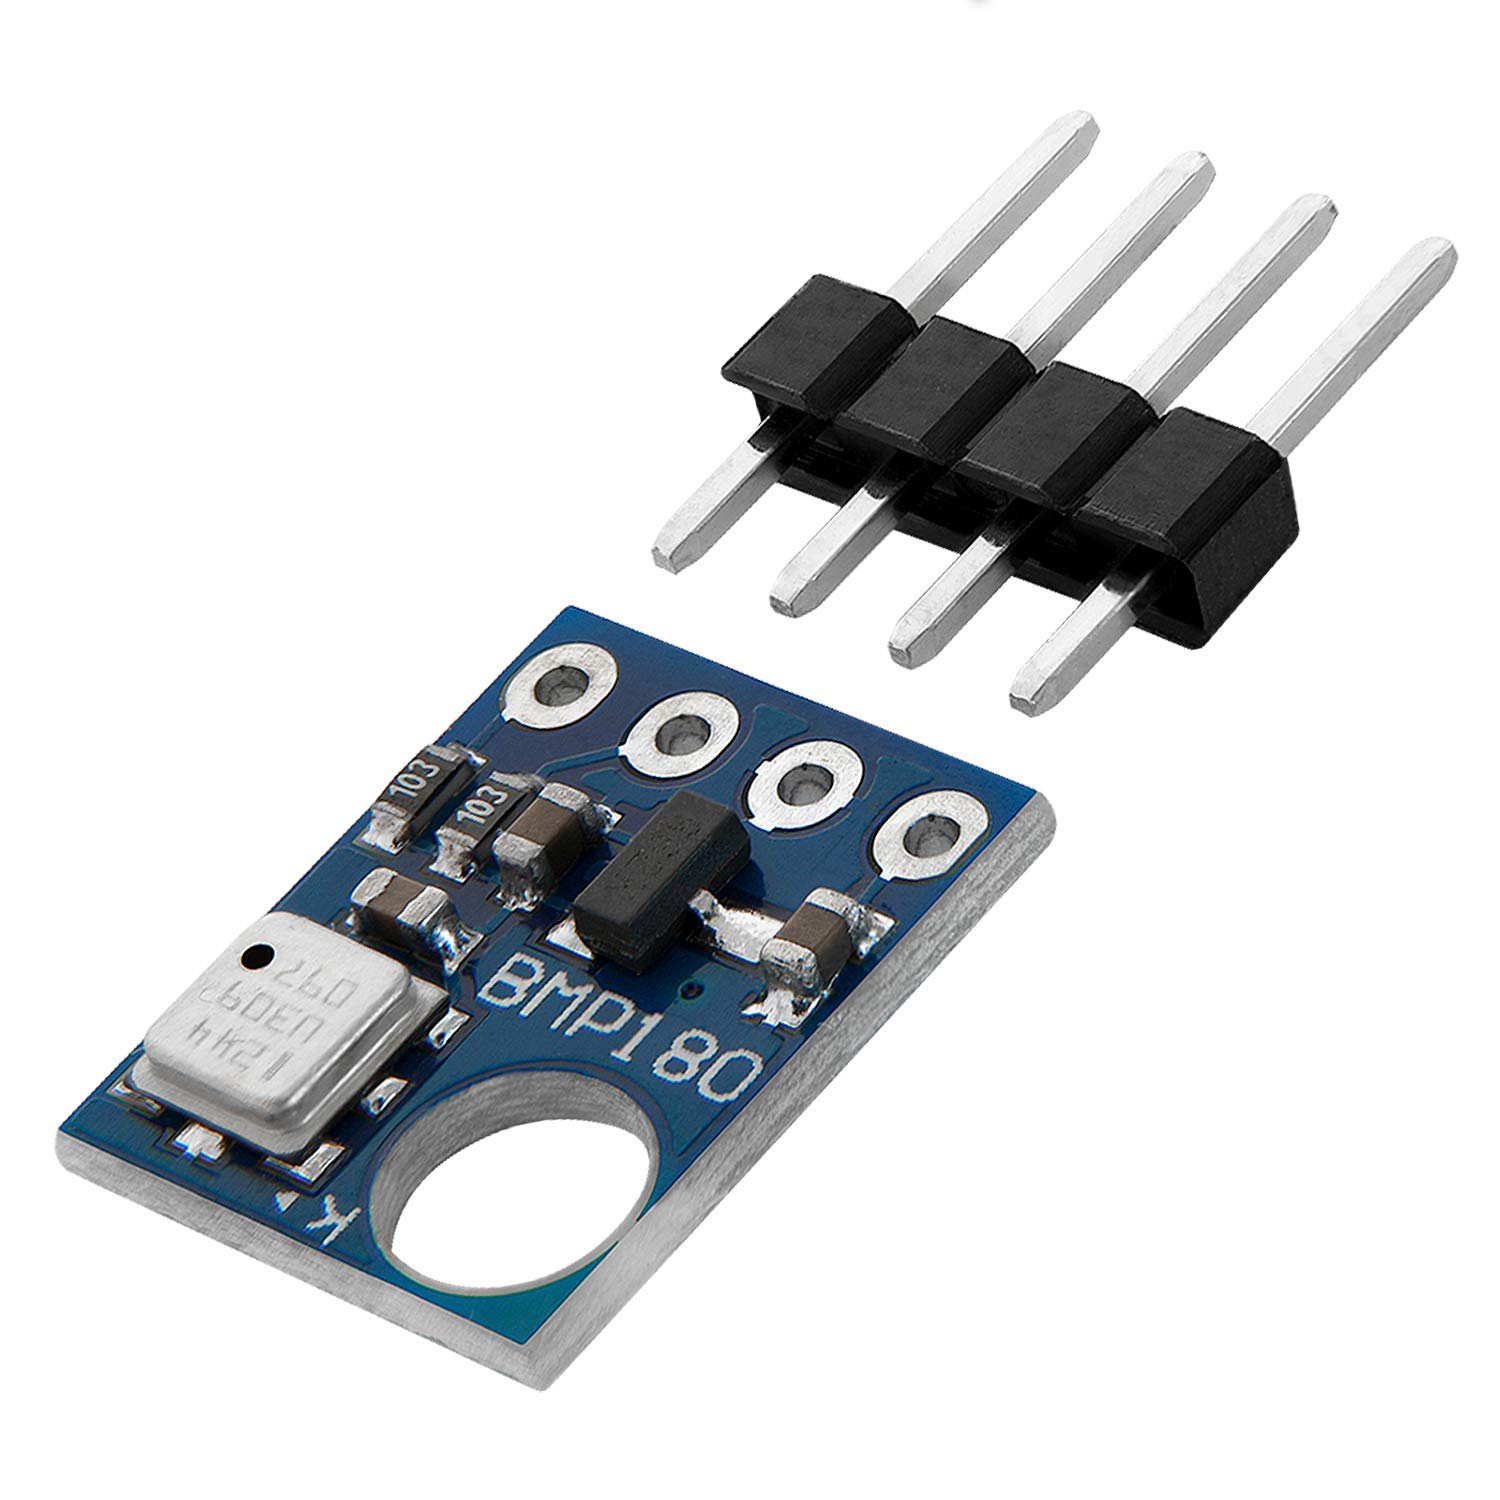 | BMP180 barometer | A high precision barometer, with I2C interface. Also measures temperature. The unit used in this project requires soldering. | [AZ-Delivery](https://www.az-delivery.de/products/azdelivery-gy-68-bmp180-barometrischer-sensor-luftdruck-modul-fur-arduino-und-raspberry-pi)<br/>*(€5.49)* |
| 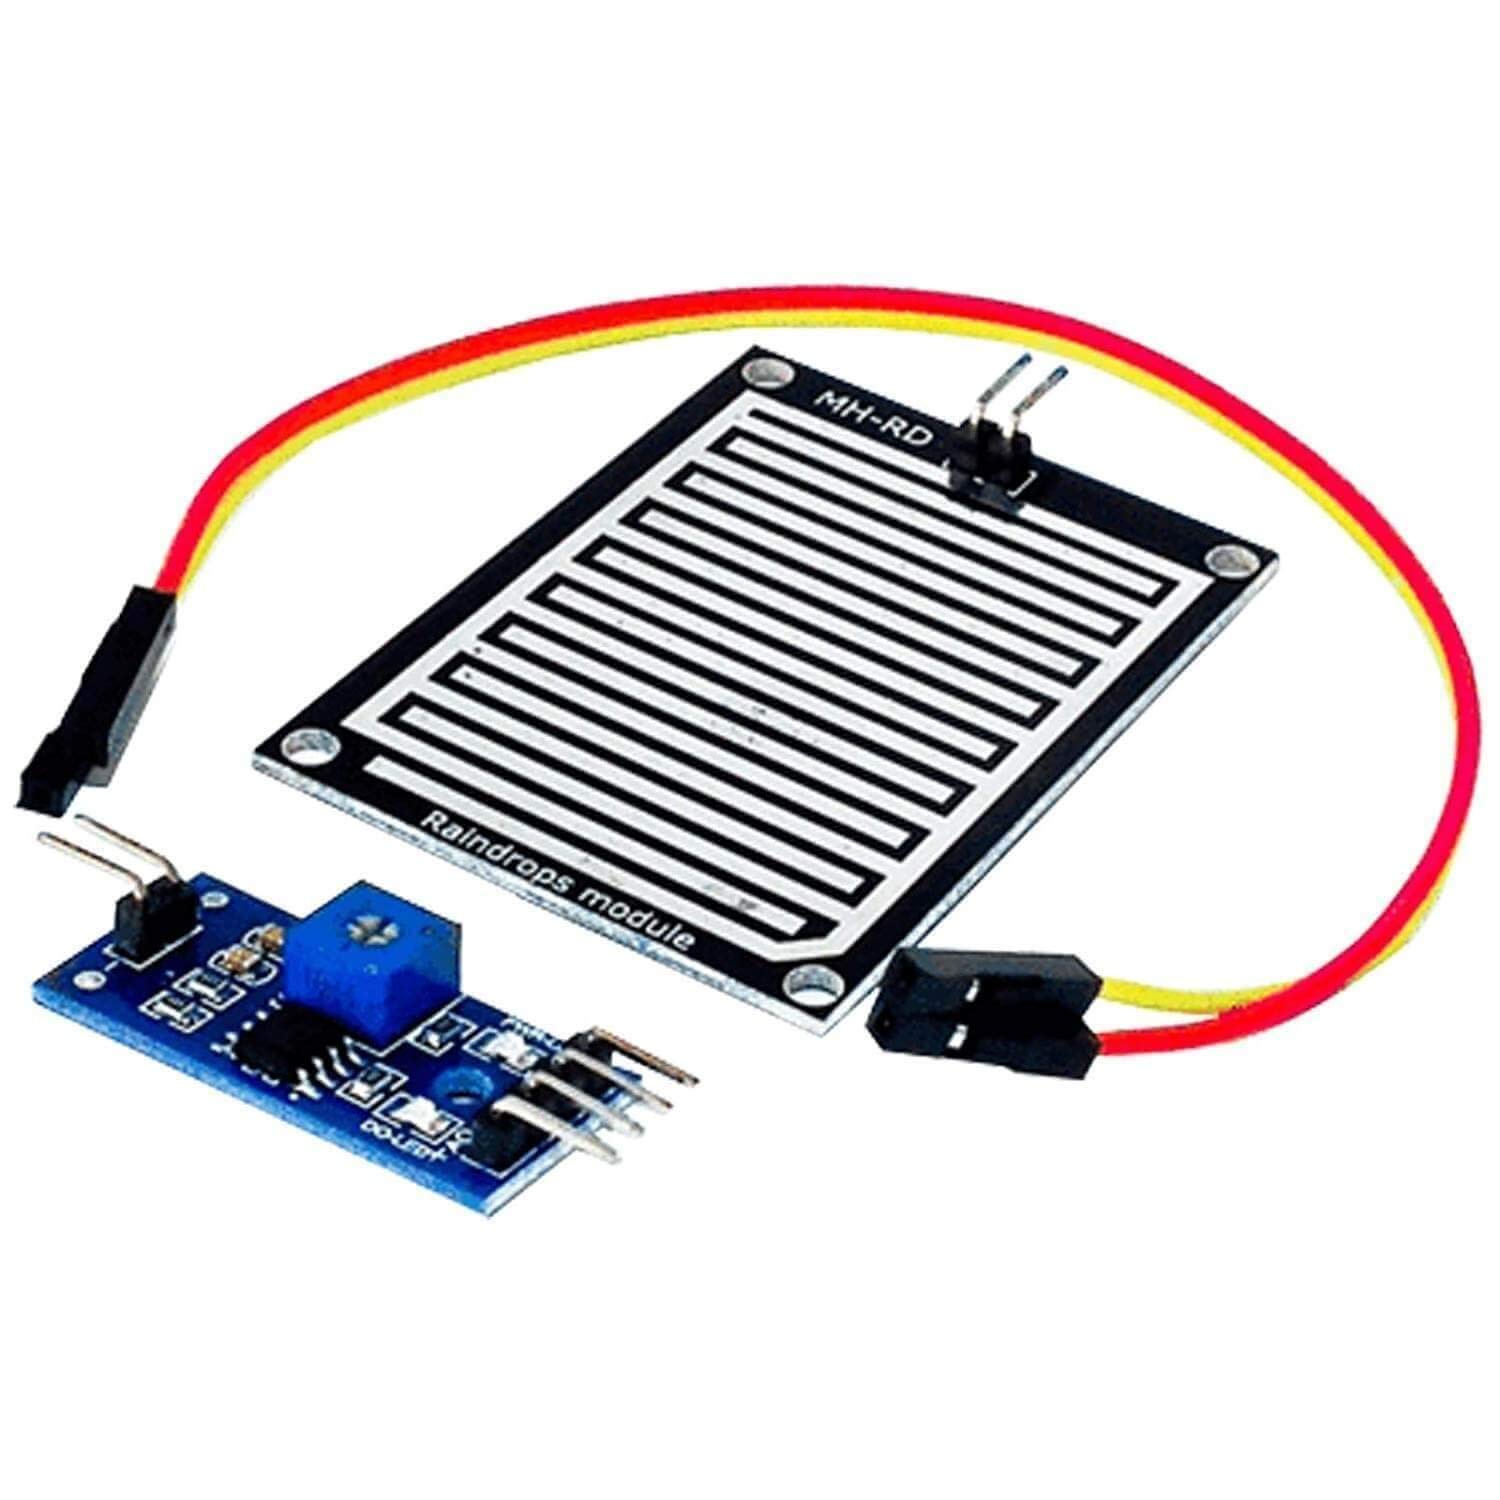 | (Optional)<br/>Rain sensor | Capacitive rain sensor, with identical comparator module as the soil moisture sensor. Only applicable for outdoor use, but still used in this project. | [AZ-Delivery](https://www.az-delivery.de/products/regen-sensor-modul)<br/>*(€3.99)* |
|  | (Optional)<br/>NPN transistor or equivalent CMOS circuit | Used as a digital switch for the power supply, to save power and extend the lifespan of the capacitive sensors when not in use. A CMOS inverter constructed from NMOS and PMOS transistors are used in this project instead, simply because that is what I had on hand. | [Electrokit](https://www.electrokit.com/produkt/mpsa14-to-92-npn-30v-500ma/)<br/>*(€0.54)* |
You will of course also need a USB-A to micro USB cable for programming and powering the Heltec board, but we all usually already have one.
**You will also need a soldering iron to solder the pins onto the MCU.** It is always good to have one, anyway.
All sensors can be bought as a kit, the one I bought was from [AZ-Delivery](https://www.az-delivery.de/products/16-in-1-kit-zubehorset-fur-raspberry-pi-arduino-und-andere-mikrocontroller) (€23.99, comes with additional sensors).
Any 3.7V battery with JST-PH connector could be used as power supply. Different capacity batteries can be bought from [Electrokit](https://www.electrokit.com/?s=lipo+3.7v&post_type=product).
It took some time to receive all the equipment, which delayed the project more than I would have wanted.
I wanted to use a photoresistive sensor as well, to measure sunlight intensity, but the one I got from the kit was attached to a comparator module without analog output. I could have removed the resistor and used it separately, but I decided not to because I already had several sensors to deal with.
## Computer setup
### Code platform: MicroPython
It was recommended to use the [MicroPython](https://micropython.org/) as code platform, so I chose to use it for this project. MicroPython includes a modified subset of the Python standard library specifically tailored towards microprocessors. It is used with the Python language and allows for code to be run directly on the board without needing to compile. It also features an interactive prompt that runs natively on the MCU.
The Heltec board needs to be flashed with the MicroPython firmware before any code can be uploaded. If you intend to use WiFi, you can use the latest official MicroPython binary for ESP32, downloaded from [here](https://micropython.org/download/esp32/). That page also has instructions on how to flash the device. LoRa is not included in this firmware version because generic ESP32 devices do not have LoRa built in. If you wanted to use LoRa, you could use the [binary from PyCom](https://docs.pycom.io/updatefirmware/device/) instead, but other modules may also differ from the official version.
If your operating system does not recognize the device when connected, you can install the driver manually. It can be downloaded from [here](https://www.silabs.com/developers/usb-to-uart-bridge-vcp-drivers). Choose the latest version for your OS and run the installer extracted from the downloaded .zip file.
### IDE: Visual Studio Code
I chose to use [Visual Studio Code](https://code.visualstudio.com/) as IDE for the project since it is the one I am most familiar with and it has the [Pymakr](https://marketplace.visualstudio.com/items?itemName=pycom.Pymakr) extension available, which you need in order to upload code to the device and interact with it. I had some problem uploading code with Pymakr, so I switched to the [preview version](https://marketplace.visualstudio.com/items?itemName=pycom.pymakr-preview) of the extension which worked better. At one point I also tried to use [Atom IDE](https://atom.io/) with Pymakr extension, but I had worse problems there so I switched back.
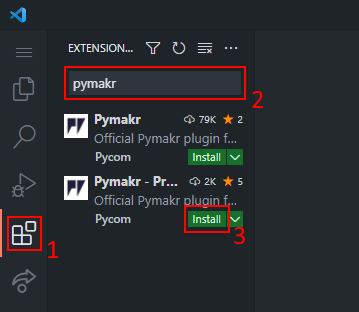
You can download Visual Studio Code from [here](https://code.visualstudio.com/Download). In order to install the Pymakr plugin, open VS Code, click the "Extensions" icon in the side panel and search for "pymakr". I installed the preview version as mentioned but the main might work as well.
<!-- Once installed, you will find the Pymakr icon in the side panel, which reveals the Pymakr options. You create a project by clicking "Create Project" or the + sign next to "Projects".

After selecting a directory where the project shall be located, you will be prompted to enter a project name and select a template.


Using the "empty" template will generate a ```boot.py``` and a ```main.py``` file, which you can see in the file view in the side panel. -->
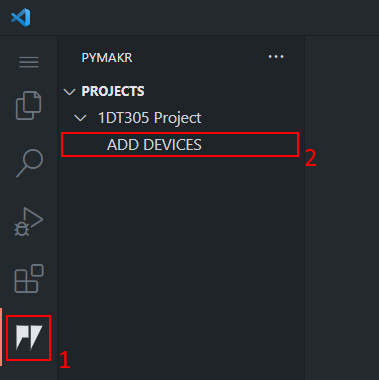
When in the project folder (found on [GitHub](https://github.com/villed3/1dt305-project)), the project will show up in the Pymakr view. You will need to add the device to the project to be able to interact with it, by connecting it and clicking "ADD DEVICES" underneath the project.
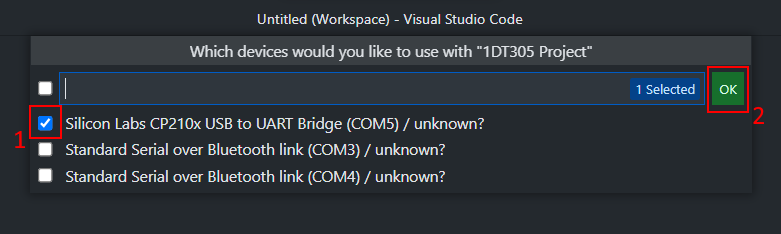
If you have the correct driver installed it will show up as "Silicon Labs CP210x...". Simply select it and click "OK".
Hovering over the newly added device in the Pymakr view will reveal options for the device. You first click the connect icon to connect to the device. Then you will be able to upload the code by clicking the upload icon.
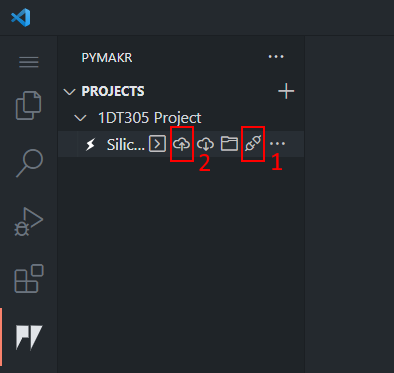
After the upload has finished, the new code can be run by clicking the reset button on the physical board (labelled "RST").
## Putting everything together
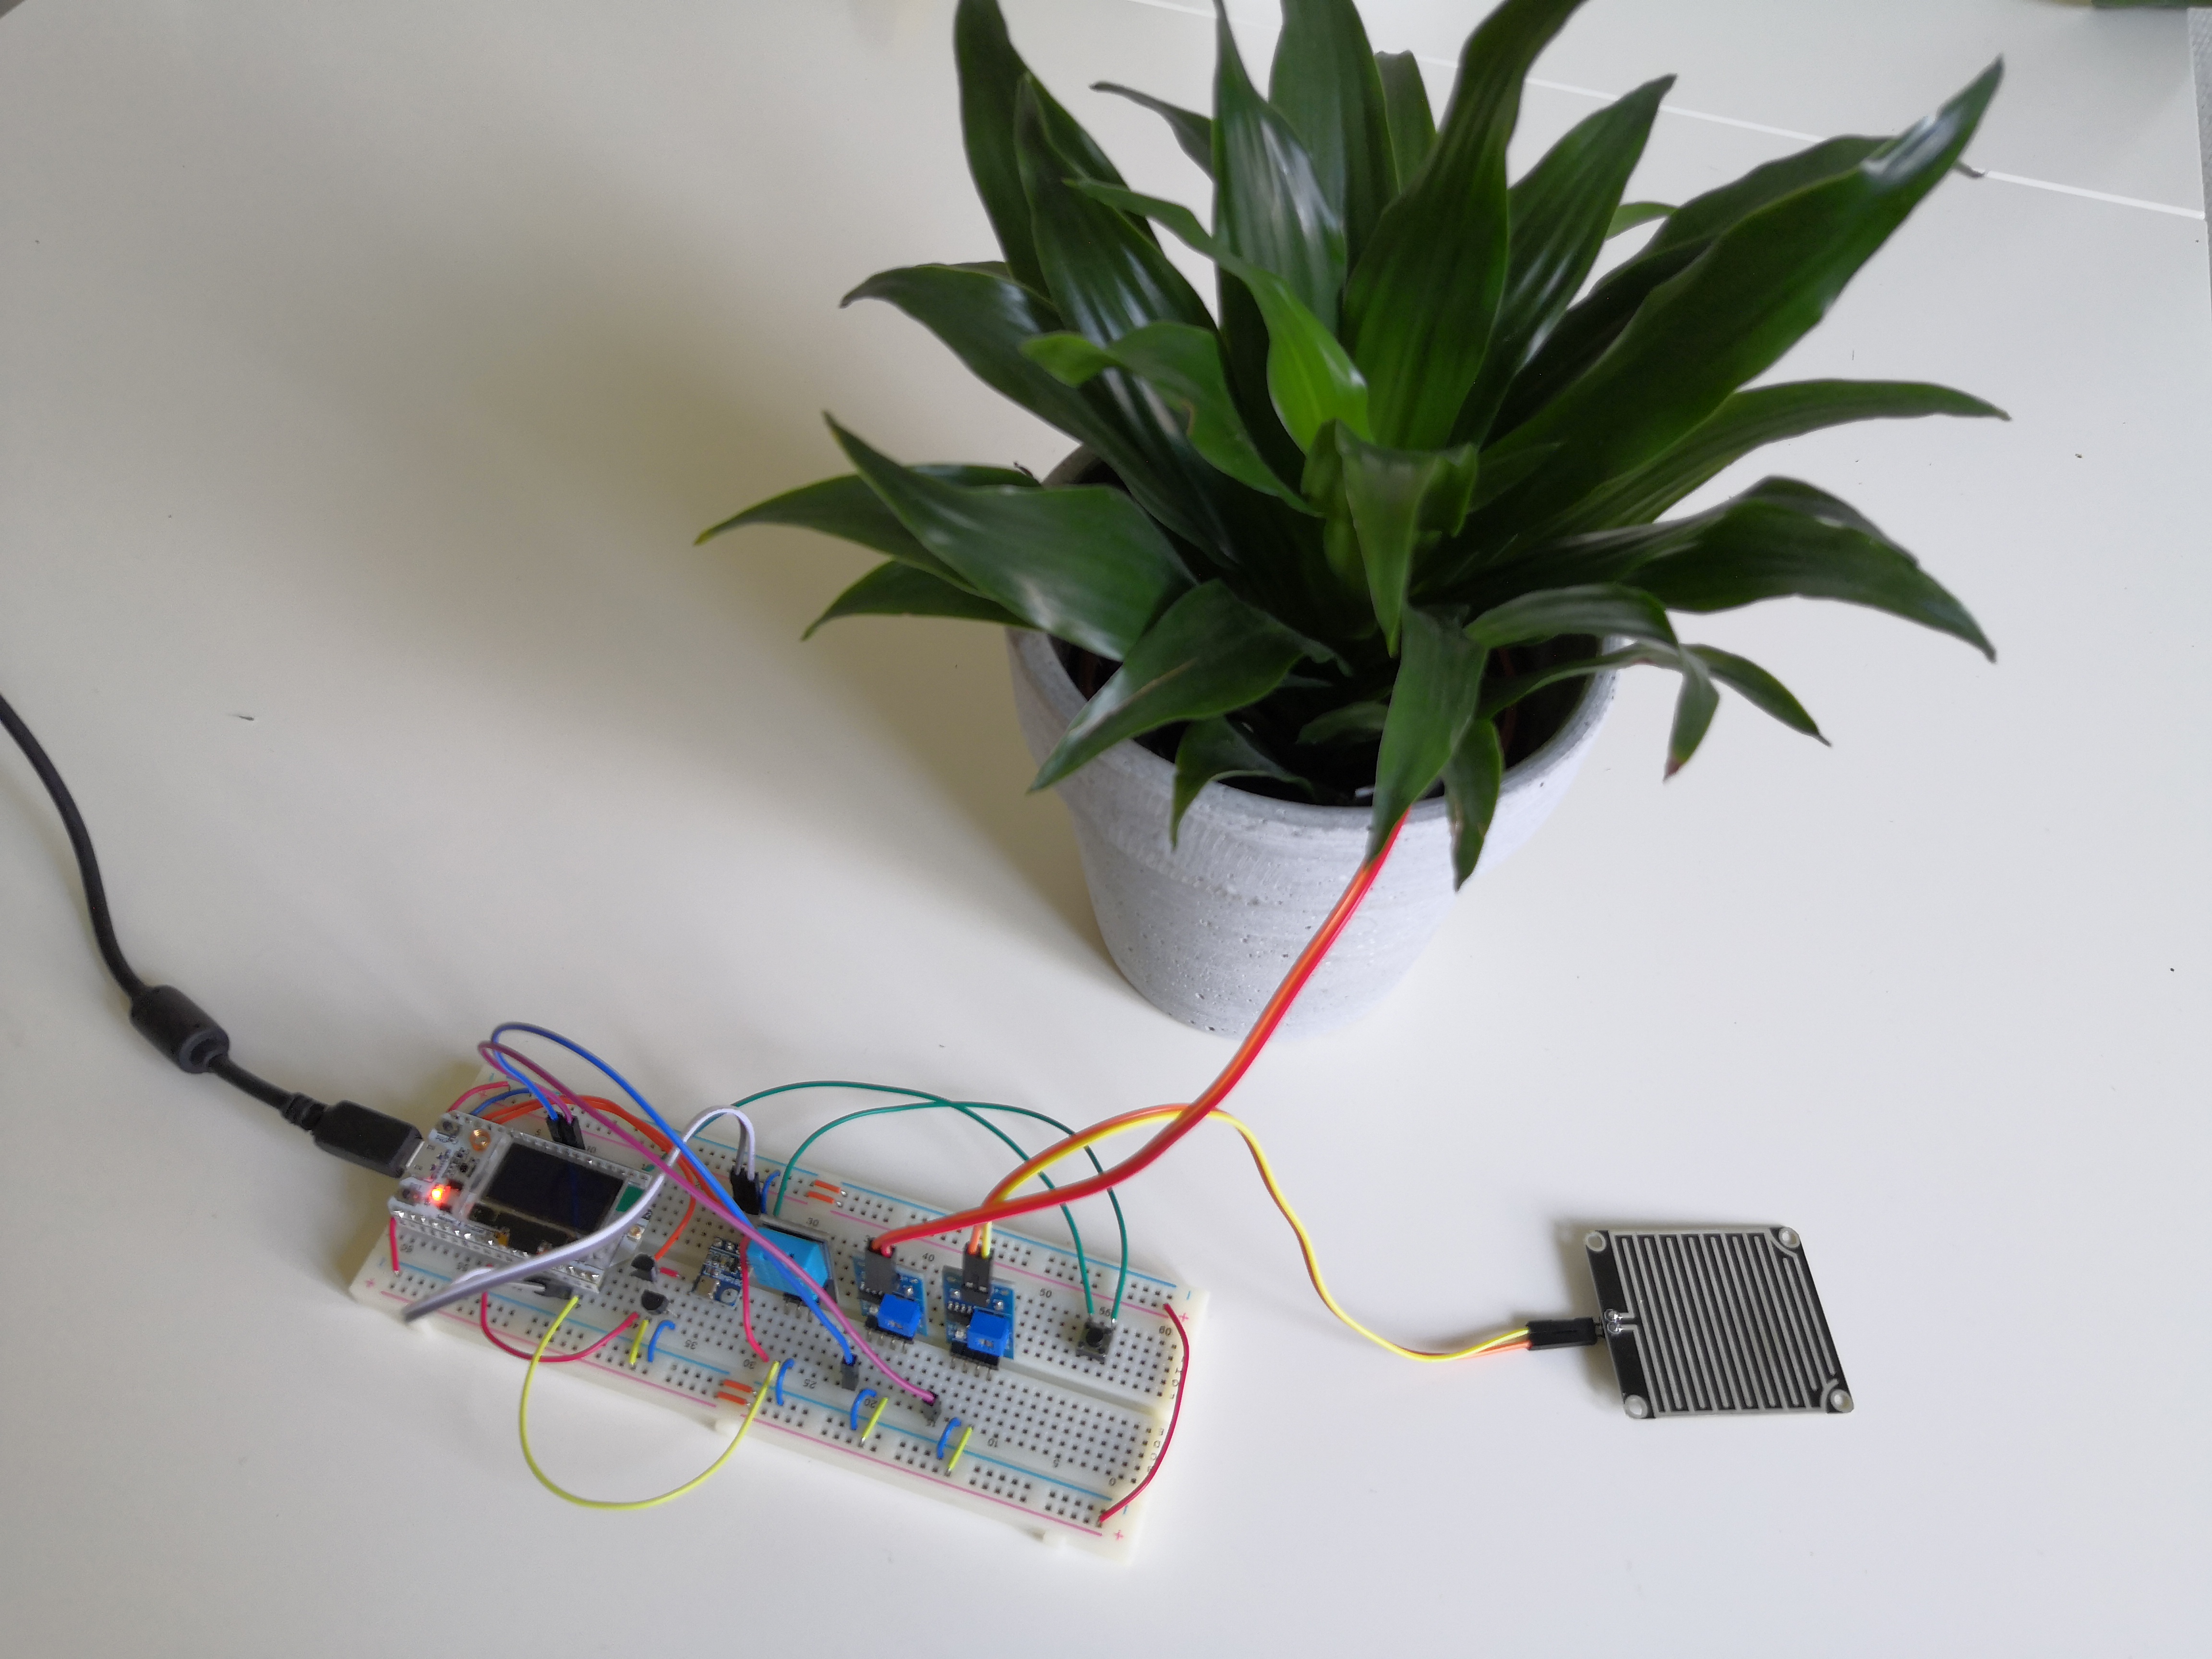
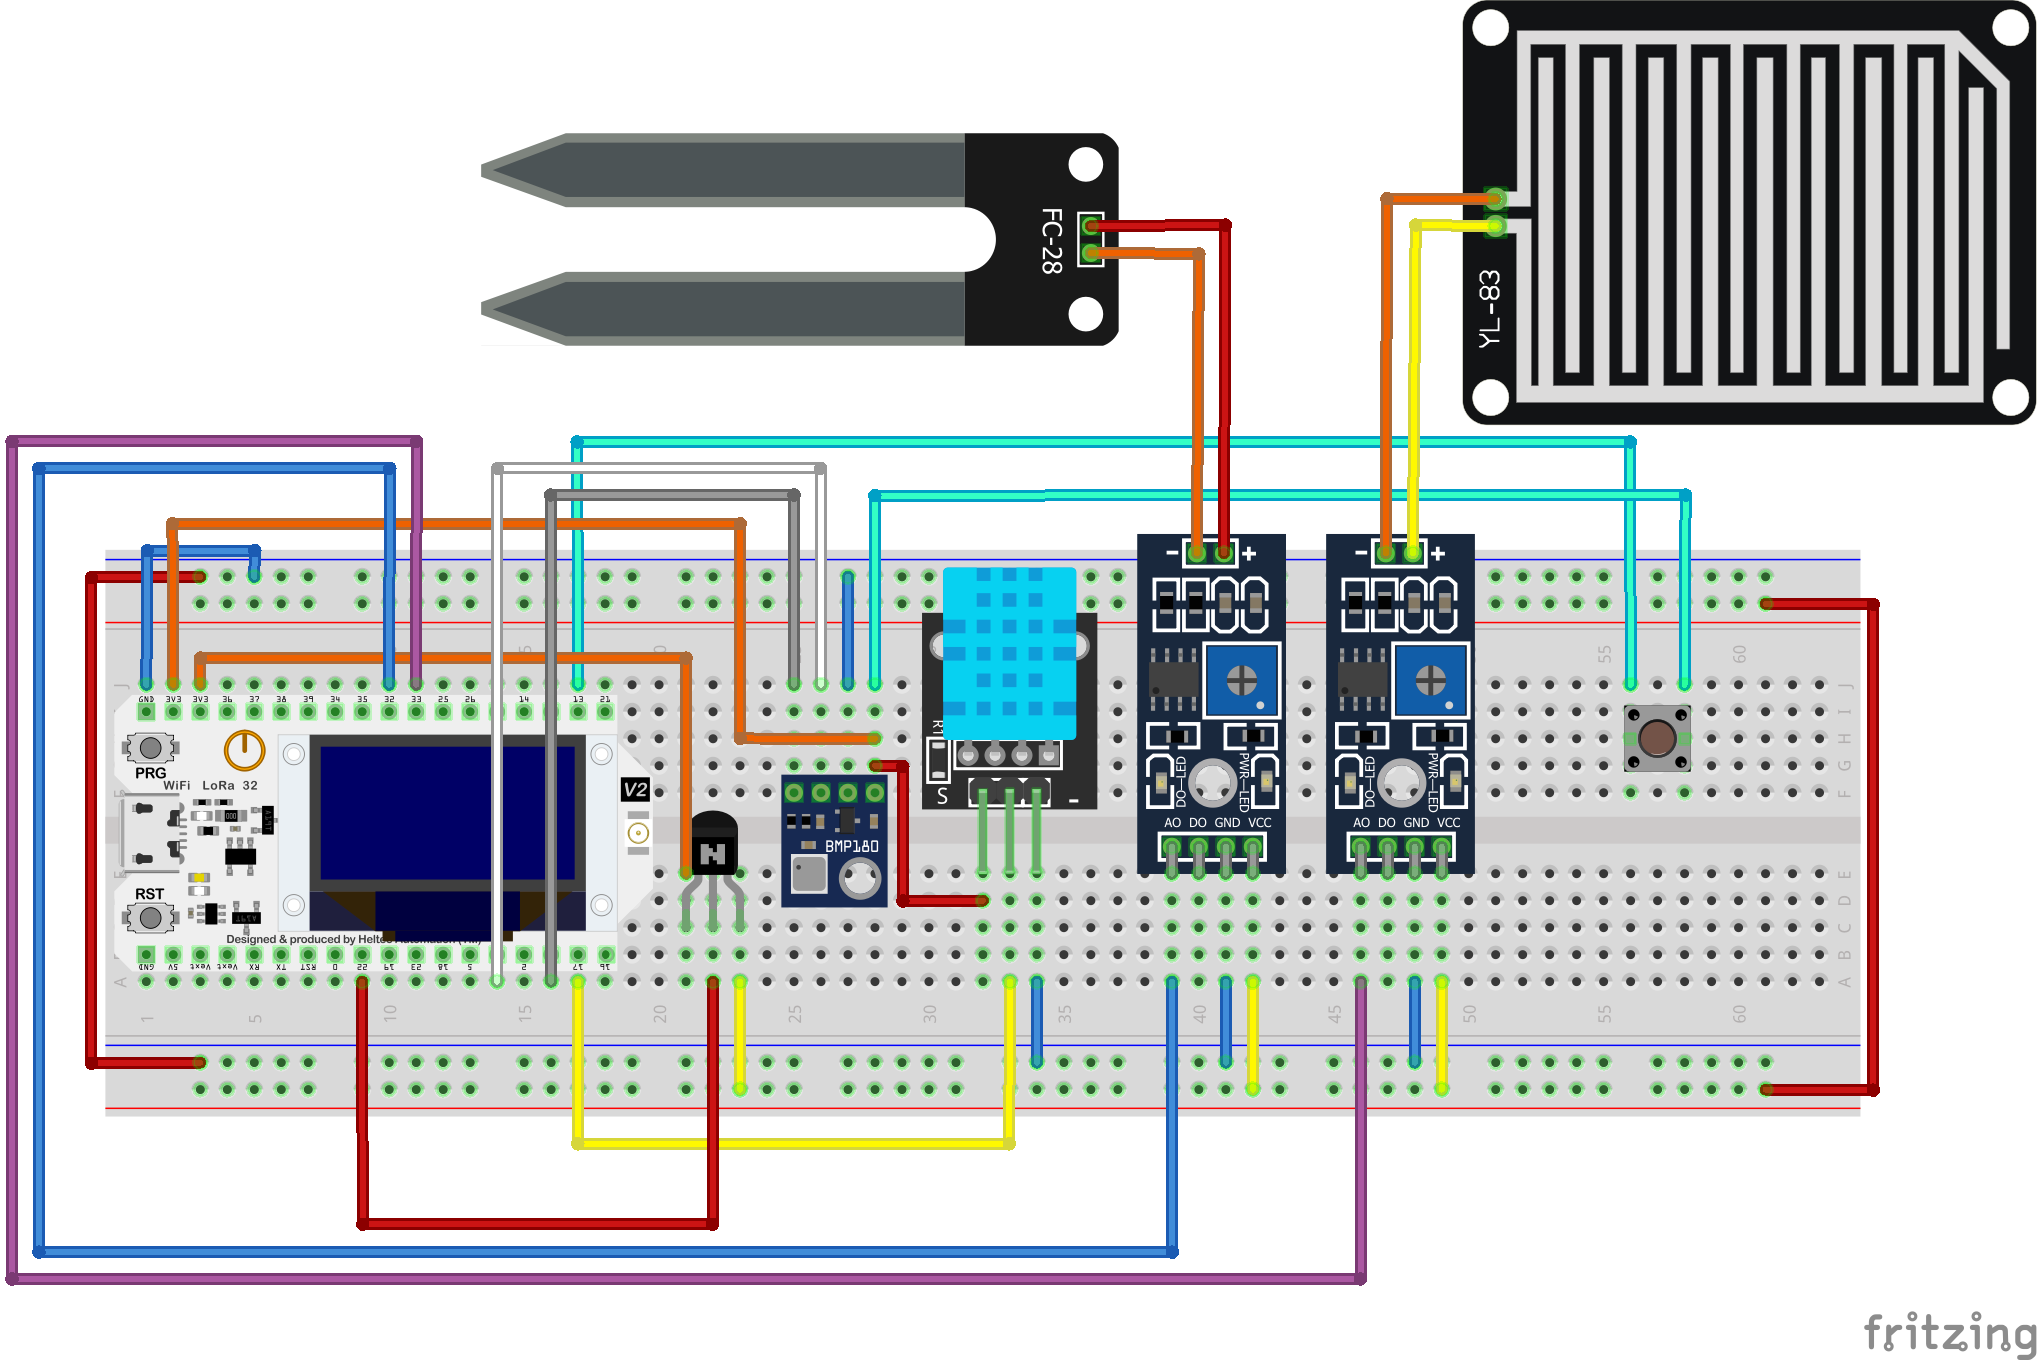
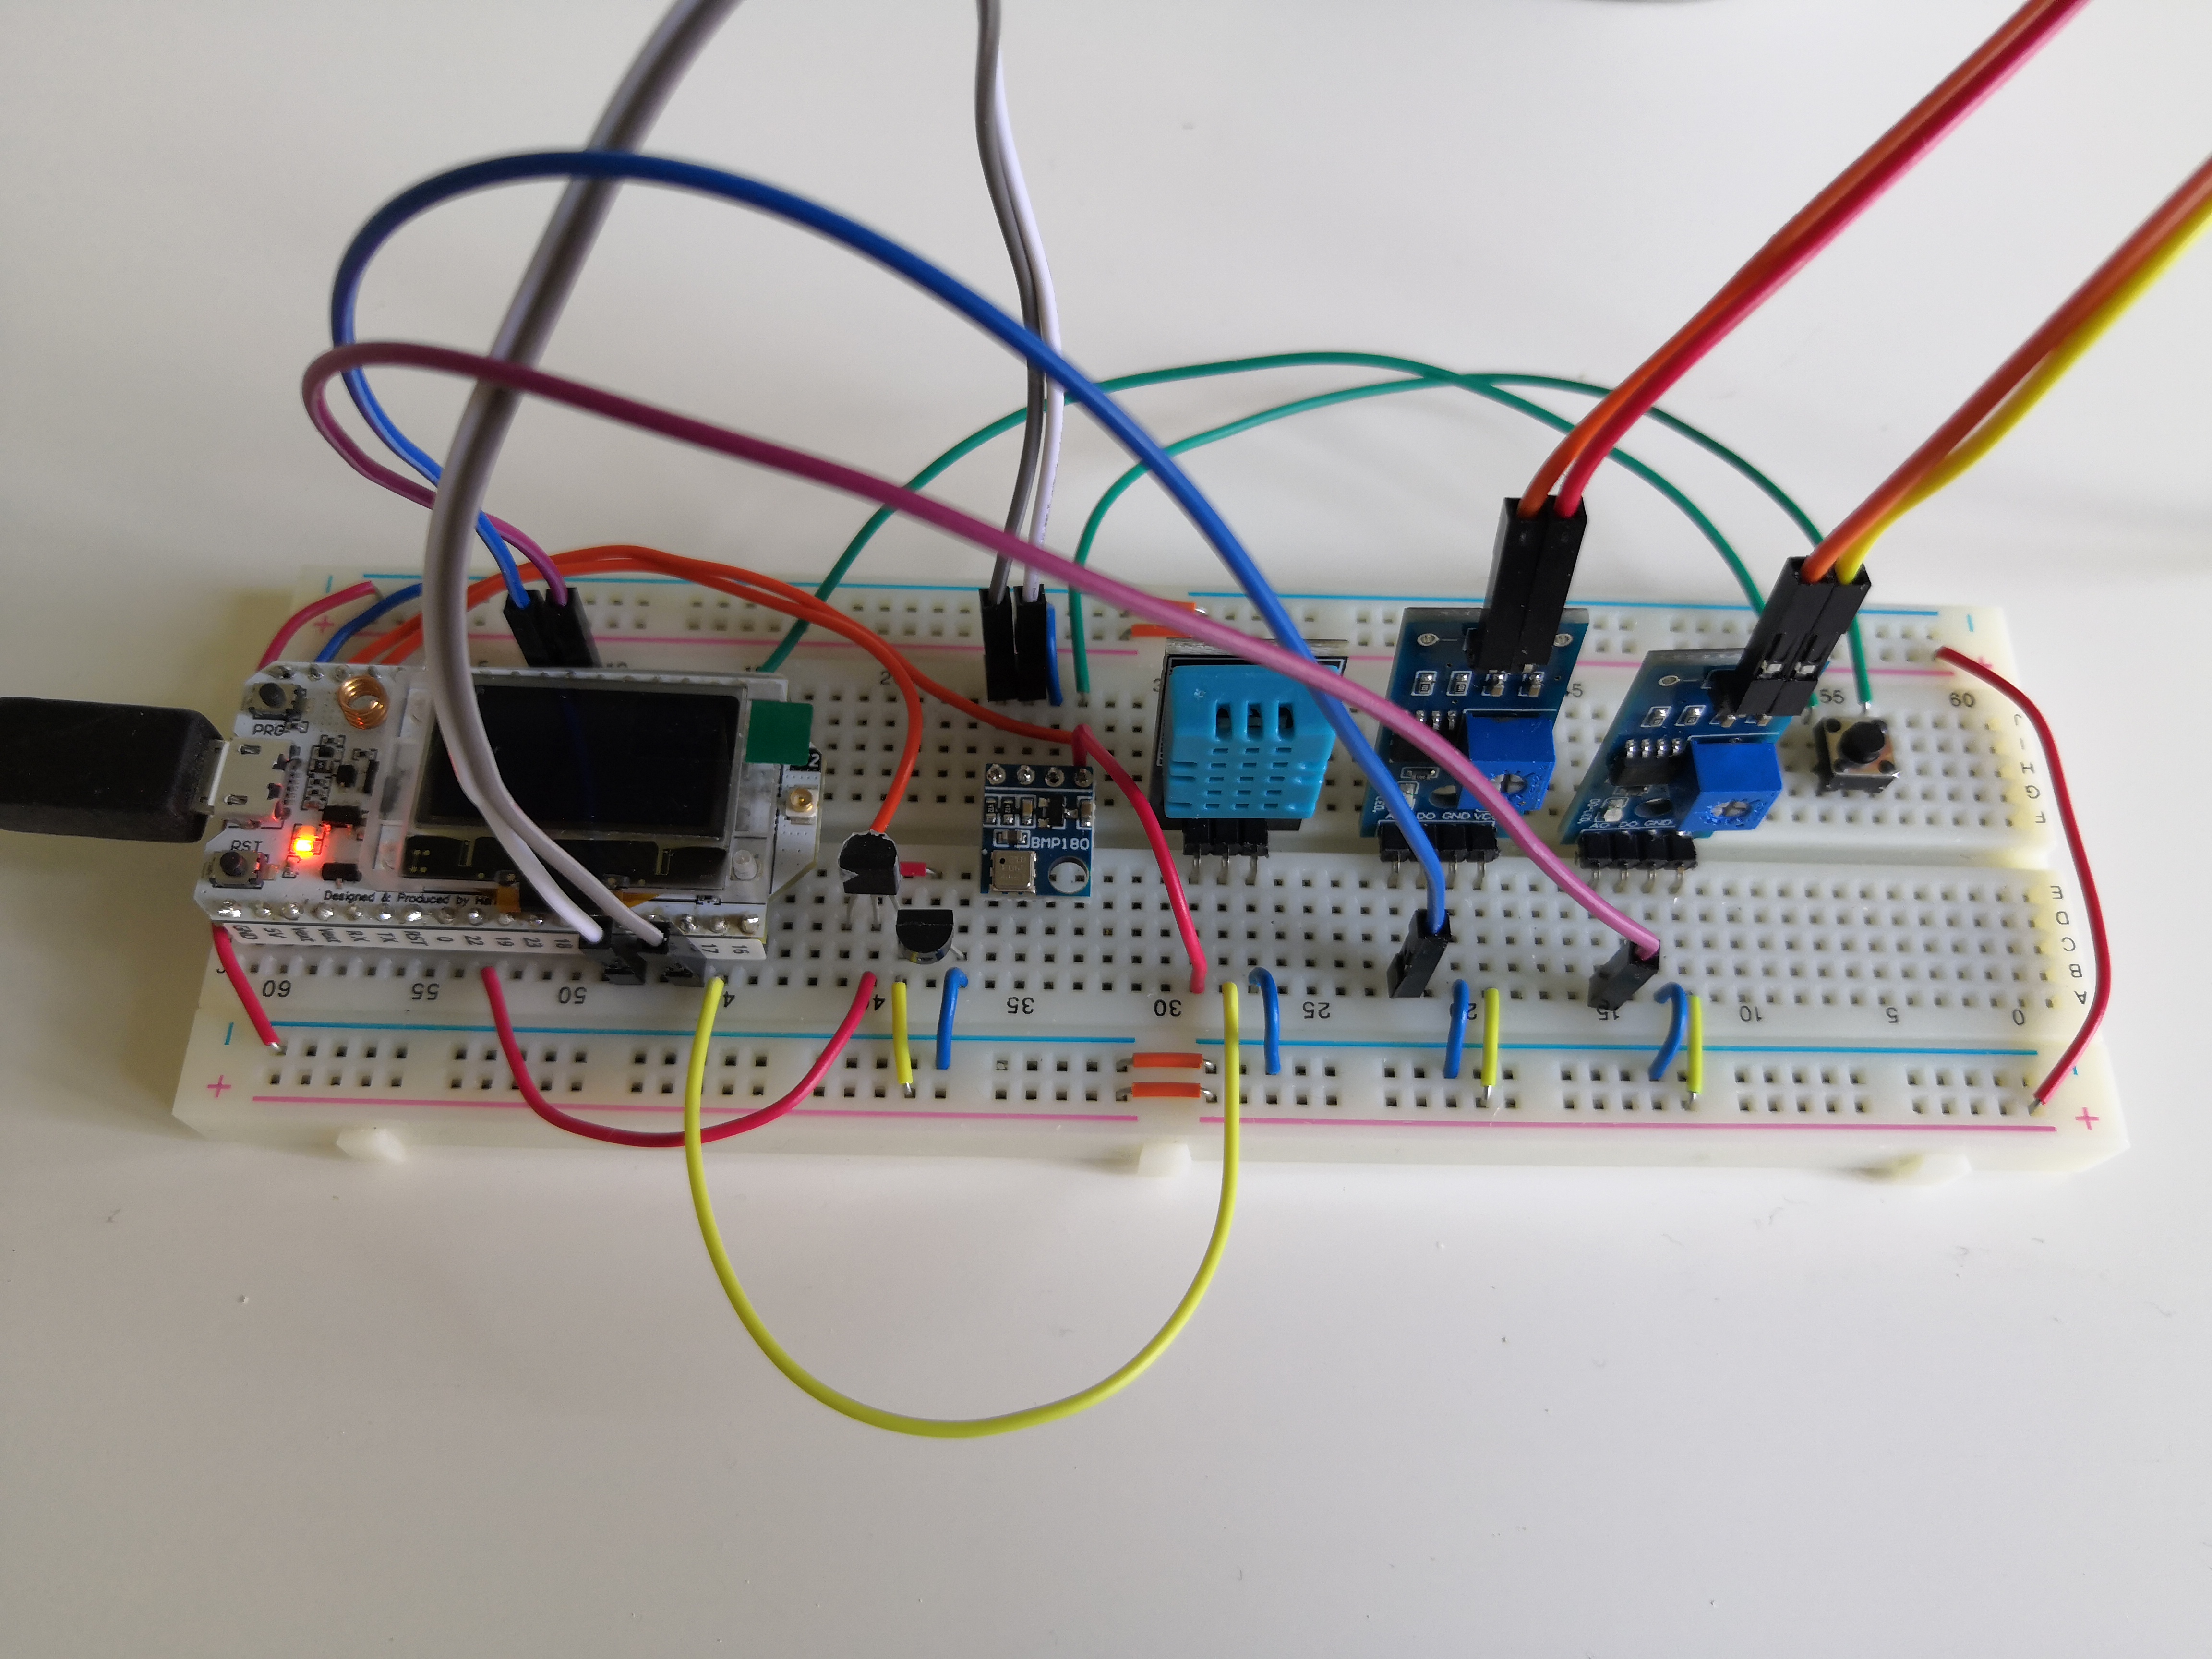
The image below shows the exact wiring I did with my sensors. The Heltec MCU is small enough to fit on the breadboard, but the pins had to be soldered onto it first. The barometer (BMP180) also required soldering of pins.
The temperature sensor (DHT11) has one digital data pin in the center which is connected to a pin on the MCU that supports bidirectional GPIO.
The barometer communicates over I2C, which requires 2 wires: one for data and one for a clock. The Heltec MCU already has dedicated pins for I2C since the OLED display also uses I2C, so I re-used those.
The analog output pins of the comparator modules for the capacitive sensors (soil moisture and rain) are connected to one pin on the MCU each. Not all pins on the MCU have analog to digital converters so that had to be checked.
The power lines for the capacitive sensors is connected to a transistor switch, so that the power can be activated only when measuring. I had read that these types of sensors corrode very quickly if they are constantly powered, and they also consume a lot of power so I wanted to moderate that.
*NOTE: In the diagram I added an NPN transistor as switch for the power supply, but in reality I used an NMOS and a PMOS transistor (forming a CMOS NOT gate). I am therefore not entirely sure if the wiring in the diagram is proper.*
I used the pushbutton on the right side of the breadboard for debug purposes (sensing and publish data manually), so it is not required.
It is important that all sensors are connected to the 3.3V pins, even though some of them can operate on 5V. This is to save some power but also ensuring that nothing breaks on the MCU, since not all input pins can handle more than 3.3V. The digital connections to the board requires pull-up or pull-down resistors, but luckily the MCU has these built in and can easily be enabled in software.
To save energy I did as mentioned connect a switch to the capacitive sensors, but not to the others. The barometer has very low idle consumption so that is not a big problem, and the temperature sensor would get bad readings if not constantly powered.
The power consumption of the sensors are approximately the following:
| Component | Active power | Standby/Idle | |
| -------------------- | ------------ | ------------ | --- |
| DHT11 | 0.3 mA | 60 µA | |
| BMP180 | 1 mA | 3 µA | |
| Soil moisture sensor | 15 mA | - | |
| Rain sensor | 15 mA | - | |
The processor on the Heltec board itself consumes a little more, especially when sending data. When in deepsleep, the power is very low however. The OLED display and power LED needs to be turned off though.
| Component | Operating (w. WiFi on) | Deepsleep |
| --------- | ---------------------- | --------- |
| ESP32 | 160 ~ 260 mA | 10 µA |
If we assume that the device is active for about 10 seconds, including connecting to WiFi, gathering data for one second, transmitting and then going to sleep for 5 minutes minus the time spent awake, we get can calculate an approximated power consumption for the device, assuming also that the averaging consumption of the processor is 200mA.
$$
\frac{(0.3 + 1 + 15 + 15 + 200) + (0.06 + 0.003 + 200) * 9 + (0.06 + 0.003 + 0.01) * 290)}{300}
$$
$$
= 6.843457
$$
With an approximate consumption of 7 mA, a battery with 3000mAh capacity would last for about 430 hours or almost 18 days. There are of course ways to make things even more efficient, but it is a good start.
## The cloud platform
I chose to setup a cloud platform stack on my own PC using [Docker](https://www.docker.com/). Using Docker containers is very handy when developing because it takes basically no time to set up if you have it preconfigured. The components I needed were:
- An MQTT broker that receives MQTT data sent from the device.
- A data collector that subscribes to the MQTT broker that stores the data in a database.
- A database storing all measurements within a certain time period.
- A data presenter with a web interface, for example showing graphs of the measured values over time.
### MQTT Broker: Mosquitto
As MQTT broker, I decided to use [Mosquitto](https://mosquitto.org/). It is a very reputable and open source platform that does the job. Users can be set up with read or write access to particular MQTT topics very easily using a single file.
### Database: InfluxDB
[InfluxDB](https://www.influxdata.com/) is a high speed database that is very suitable for IoT. Tables are referred to as measurements and a measurement entry is divided into tag keys, that can describe where the data was measured, and fields, which contain the data itself. It has word-based quering, similar to SQL, which makes it easy to use. An easy pick for this type of project.
### Data collector and data presenter: Node-RED
I chose to use [Node-RED](https://nodered.org/) as data collector because it is very powerful and can operate as both data collector and data presenter, removing the need of yet another application. It has a visual interface where "flows" are created with nodes that perform actions, such as collecting, filtering, modifying and visualizing data. It is perhaps not the most intuitive tool but it is very flexible and also has good integrations with both MQTT and InfluxDB. The image below shows what my flow looks like.
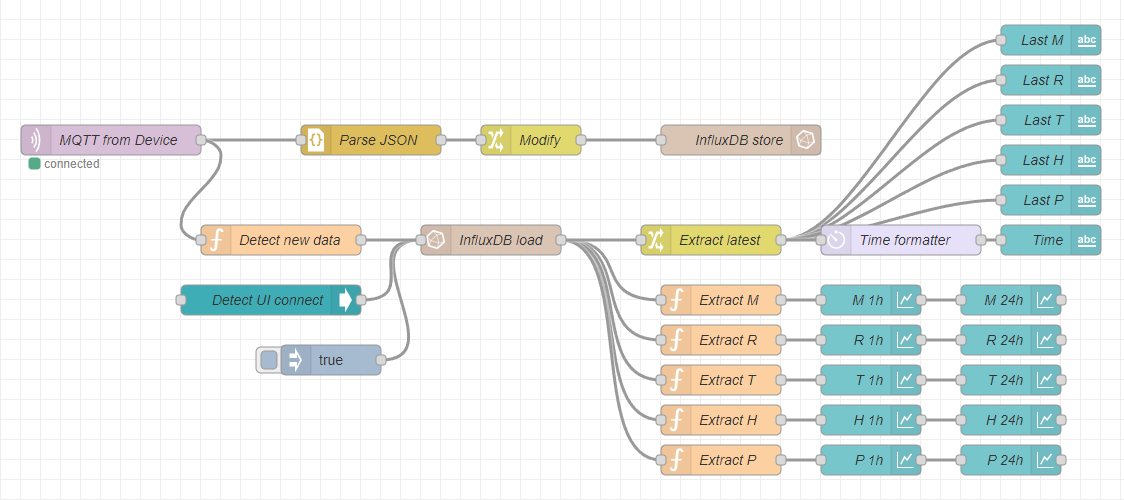
It starts from the left where MQTT data is collected. The data is parsed and stored to the database, while also a signal is sent to trigger loading of the new data from the database. The right-most nodes in the flow image are the UI elements that appear in the visualization dashboard.
### Composing with Docker
All these platforms have official docker images. I created a composition file to make it easy to deploy and redeploy. I have my own domain pointed to my public IP address so that the MQTT data can be sent to me. However, my DNS provider does not allow all TCP ports, including 1883 for MQTT, so I had to use port 8080 instead. I set up volumes for the different containers so that the data would be saved even if I removed the containers. I provide a tutorial on how to setup and run my Docker composition in the [GitHub repository](https://github.com/villed3/1dt305-project/tree/main/docker) of the project.
### For users
If this project would have been more serious and developed towards having customers, there would definitely have to be improvements to the platform. For instance, user should be able to register their devices in the dashboard to an account only they have access to. Additionally, the platform would need to be deployed on an actual server, and perhaps the users would have to pay a fee for the service. Node-RED is good with data but with individual users it is maybe not as scalable.
## The code
The complete source code can be found in the [GitHub repository](https://github.com/villed3/1dt305-project/tree/main/python). The code is structured into two main files:
- ```boot.py``` which runs at startup. Here I set up the wireless connection and create an MQTT client.
- ```main.py``` which runs after boot. Here I initiate sensors and create functions that sense and transmit data.
In addition to those, there are some libraries that were not included with MicroPython, these reside in a ```modules/``` directory and are:
- ```bmp180.py``` - for for the BMP180 barometer
- ```mqtt.py``` - for using MQTT over WiFi
- ```ssd1306.py``` - for the OLED display, only used for testing
There is also an ```env.py``` file where I store secrets such as WiFi and MQTT credentials, which is not committed to the GitHub repository.
In the beginning of the ```main.py``` file, all pins on the MCU are configured for the sensors. The ```Pin``` class from the machine library is used to define the properties of a pin. The ```Pin``` object can be passed to another class that will use it. The example below is for the DHT11 sensor:
```python
dht_data = Pin(17, mode=Pin.OPEN_DRAIN, pull=None)
dht = DHT11(dht_data)
```
The function for sensing from all sensors looks like this:
```python
def sense():
(temp, pressure, _) = baro_sense()
(_, hum) = dht_sense()
vcc_on()
sleep_ms(50)
moisture = moist.read()
rain_intensity = rain.read()
vcc_off()
return (temp, pressure, moisture, rain_intensity, hum)
```
It uses separate functions I created for reading the barometer and temperature sensors, while the analog sensors values can be read using ```.read()```. The reason I have a try-catch block around the DHT11 sensor is because it would not always have enough time during the first loop. The temperature value from the DHT11 is ignored and instead the BMP180 temperature is used. The ```vcc_on()``` and ```vcc_off()``` toggles the power to the analog sensors using the external transistors. The function then returns all values in a tuple.
In the main loop, data is sensed and published over MQTT and then the device is put into deepsleep. When it wakes up it will run the code from the beginning and do all steps again.
During development I did not let it publish automatically. Instead I let the program loop infinitely, and created an interrupt function that would run whenever I pressed the external pushbutton, shown below.
```python
btn_pressed = false
# Interrupt for button
def btn_int(pin):
global btn_pressed
btn_pressed = True
sense_and_publish()
sleep(1)
while btn.value():
pass
btn_pressed = False
btn.irq(trigger=Pin.IRQ_RISING, handler=btn_int)
# Main loop
while True:
if DEVELOPMENT:
pass
else:
try:
sense_and_publish()
print("Published. Entering deepsleep.")
except OSError as e:
print("Could not publish. Entering deepsleep.")
sleep_ms(100)
deepsleep(60000 * 5 - 10000)
```
If I would have had more time for the project, I would have reworked the structure of the code as well as work to improve the efficiency of the program.
In the current version I do not alter the values before sending them. The capacitive sensors will return 4095 if there is nothing sensed and less if there is, which is not very displayable. I could have had the logic in Node-RED if I had had time to implement it.
## Transmitting data
My initial goal was to use LoRa for the communication because it is very practical if it is used outdoors, since it does not require much power and it has a wide reach. There are different established LoRa networks that are basically free to use, for example The Things Network and Helium. After trying to connect to both of these networks without success, I concluded that LoRa would not work for my project without buying my own LoRa gateway.
I decided to use WiFi instead, and connect the device to my home network. WiFi is only practical indoors, because of its limited reach and high power consumption that leads to many recharges.
MicroPython includes a library for WiFi which makes it easy to connect. All you have to do is set the device into station mode, connect with your credentials and wait until connected.
```python
import network
wlan = network.WLAN(network.STA_IF)
wlan.active(True)
wlan.connect("ssid", "password")
while not wlan.isconnected():
pass
```
Since the device goes to deepsleep after each transmission, it needs to reconnect every time it wakes up, which takes up to 10 seconds. As mentioned, I use MQTT as transport protocol when sending the data. It has a very low overhead for the small amount of data it sends each cycle. I downloaded and imported [an MQTT library](https://github.com/micropython/micropython-lib/tree/master/micropython/umqtt.simple) that creates an MQTT client with both publishing and subscribing capabilites. You create a client with your broker information and your credentials, and you can then publish the data to a chosen topic. I had to provide a keepalive value or else my client would fail to connect. I also provide a unique ID as client ID that is retrieved using the machine library.
```python
from mqtt.simple import MQTTClient, MQTTException
import ubinascii
import machine
device_id = ubinascii.hexlify(machine.unique_id())
mqtt_client = MQTTClient(client_id=device_id, server="mqtt.example.com", port=1883, user="user", password="password", keepalive=60)
mqtt_client.connect()
mqtt_client.publish("/some/topic", 1337)
mqtt_client.disconnect()
```
The function that sends the measured data first formats it into a JSON string so that it can be sent to a single topic and later be parsed by Node-RED.
When testing I used a cycle period of 5 minutes, but in a practical scenario I would reduce the measurements per hour to 2 or 4.
## Presenting data
For the dashboard I created an element that shows the latest values as well as some graphs that show the values over time. I would have wanted to create more and utilize a weather API but I did not have enough time.
The data that is received from the device is displayed immediately when received, which for the sample displayed in the image below is every 5 minutes. Currently, the database is set to keep the data for 30 days, but in a practical scenario you might want to have an ever longer duration or somehow store averages in a separate database.
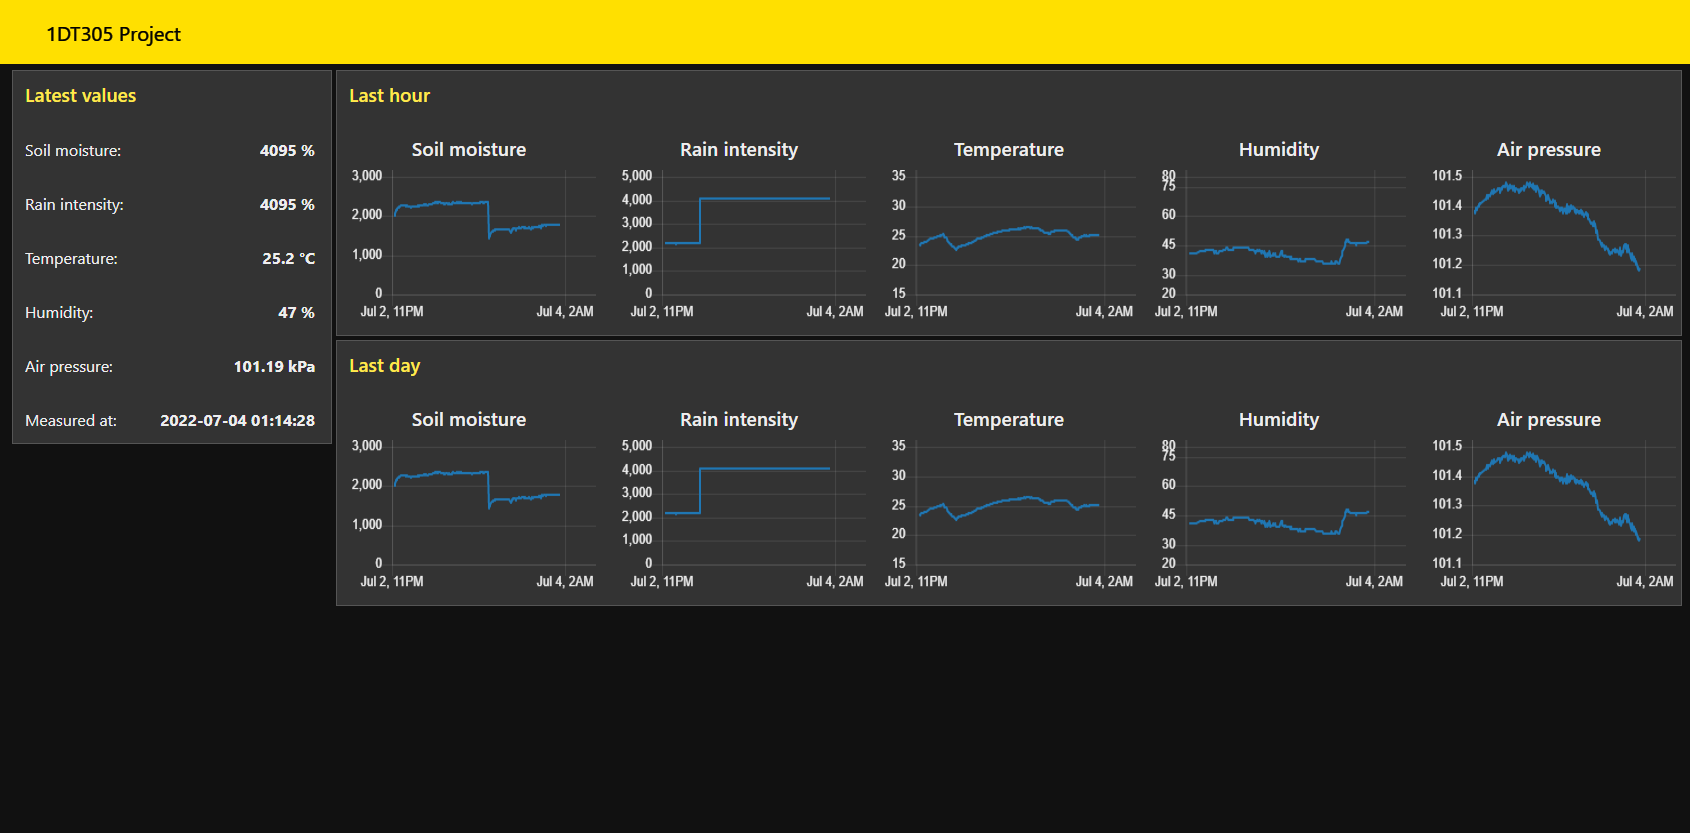
*The graphs in the image displays all the data instead of the particular timeframe. I believe it is a bug with the graphing tool, so it could be fixed by having to queries that retrieve limited amounts of entries.*
## Finalizing the design
In conclusion, I have managed to create an IoT device that senses plant moisture along with other environmental properties, and sends it to a cloud platform that visualizes it.
The next step would be to apply this project with LoRa instead of WiFi and use a battery as power supply. I would have liked to use a photoresistive sensor as well. There is also more things that can be done to improve the dashboard, in order to fully complete the objective.
Despite that, I am satisfied with the work I have done. I have learned a lot through this project and I hope others may learn something from this report.

 Sign in with Wallet
Connect another wallet
Sign in with Wallet
Connect another wallet