# Delivering Shore Power
Chris Budd mascjb@bath.ac.uk
Ann Smith a.smith@hud.ac.uk
Simone Appella sa2407@bath.ac.uk
Tina Zhou yz3259@bath.ac.uk
Huining Yang huining.yang@maths.ox.ac.uk
Yu Tian yu.tian@maths.ox.ac.uk
Wenzhong Wang ww390@cam.ac.uk
Nicolas Boulle boulle@maths.ox.ac.uk
Babooshka Shavazipour, babooshka.b.shavazipour@jyu.fi
Sam Kamperis s.kamperis@brookes.ac.uk
Wee Meng Yeo WeeMeng.Yeo@glasgow.ac.uk
Ioan Alexandru Puiu ioan.puiu@maths.ox.ac.uk
------
Google drive for papers:
Simone Appella: simone.appella@gmail.com
https://drive.google.com/drive/folders/1JS_mjG5Hqs9PpMKP3qfDGqwmkvJoe2RU
-----
## Day 1
### Summary:
Ships arrive at a port and use shore power whulst in port eg. for heating, refrigeration, living support.
UK Vessels

Notes on TS plot above:
2009-2017 old basis, 2017-2020 newbasis.
Years from 2009 to 2017:
Figures are derived from data supplied by Lloyds List Intelligence, combined with data on passenger vessel arrivals collected by DfT from ferry companies, as well as counts of cargo vessel voyages collected from ports and shipping agents as part of prot freight statistics
2018:
From 2018 onwards, the data sources used to estimate vessel arrivals have changed. The primary source of data is now the Maritime and Coastguard Agency CERS system, though data from ferry companies, ports and shipping agents collected by DfT is also still used.
Users should note that as a result the 2018 figures are not directly comparable with those for earlier years.
For further deatils please refer to the technical documentation.
2020:
Due to insufficient data, Manchester and Liverpool use a different estimation method based on CERS and experimental AIS data.
Will construct two models
**Model 1: Statistical/Monte-Carlo model of demand and supply**
* Number of ships arriving at a port (95 600 per year in the UK ?? Poisson process)
* Length of stay (?? Poisson process)
* Type of ship (size, cruise/cargo/ferry)
* Power demand of each type of ship (1MW-10MW)
* Aggregate over the UK
**Model 2: Costs/income**
* Cost of infrastructure
* Costs to ship owners (eg. $1M per ship)
* Costs to ship operators
* Running costs eg. electricity
* Income to port operator
* Taxation (eg. Carbon tax)
* Legislation
* Environmental costs/benifits eg. CO2, pollution reduction (possible 80% reduction)
**Inform both models by careful data gathering**
**Use Model 1 to inform Model 2 and optimise**
**Do we have future capacity in the national grid?**
# Background Info about vessels
Shore power or “cold ironing” is the use of electricity from the shore to power a ship’s systems when it is in port. When it is cruising, a ship’s main engines drive an auxiliary power generator. As the ship begins maneuvering to enter a port, the main engines slow down and no longer drive the generator. An auxiliary generator is then switched on to supply electricity. Once the ship docks, the main engines are switched off, and the auxiliary generator continues to power it.1 The electricity needed by a vessel in port, called the hoteling load, can range from a few hundred kilowatts to several megawatts, depending on the vessel’s size and purpose
# Vessels types and emissions
ref:
Update on emissions and environmental impacts from the international fleet of ships. The contribution from major ship types and ports
https://www.researchgate.net/publication/26639670_Update_on_emissions_and_environmental_impacts_from_the_international_fleet_of_ships_The_contribution_from_major_ship_types_and_ports
Emission at sea:

Emission in port:

Engine power

In port time on avearage:


----
# Data questions
------
Wish list from Chris:
1. Average power required in each port as a statistic (mean and sd) for different days in the year
2. Projected estimate of this as it changes year on year.
3. Define a poission distribution and get the rate of arrival and departure based on the port data (which is number arrivals in last 24h), this will give us a statistical model of arrivals and departures
(Order in temrs of largest port downwards)
To do this we will need to use the statistics of number of vessels in prt at any time, plus type of vessel (size, type of use etc). Statistics likely to be Pisson
Cost benefit analysis: Cost per shipp of putting in the shore power facilities, cost of using it (time spent in port is a factor), cost of shore based installation etc
## Supply data/questions
Chris, Alex, Wang
Ports map: https://uk-ports.org/uk-ports-map/
Transmission grid map (whole europe zoom to the UK): https://www.entsoe.eu/data/map/
Main UK ports (basic read): https://www.icontainers.com/us/2020/01/24/5-major-ports-uk/
Some statistics for UK ports: https://assets.publishing.service.gov.uk/government/uploads/system/uploads/attachment_data/file/1014546/port-freight-annual-statistics-2020.pdf
Number of ships in port: https://www.marinetraffic.com/en/data/?asset_type=ports&columns=flag,portname,unlocode,photo,vessels_in_port,vessels_departures,vessels_arrivals,vessels_expected_arrivals,local_time,anchorage,geographical_area_one,geographical_area_two,coverage&flag_in|in|United%20Kingdom|flag_in=GB
**Initial brainstorming questions:**
1. Types of shore power available and Equipment available in ports
* Generally good proximity to the main electricity grid and nearby plants also available
* Southampton (passenger and cargo): 3 Gas power plants in proximity, total 1.17GW capacity, transmission lines available, substation available Fawley (20 miles away)
* Felixstowe (massive conrainer trade port): 1 Wind farm available in proximity 500MW capacity, 1 Nuclear plant 1.2GW capacity, substation at Sizewell (30 miles away).
* London (cargo): clearly access to grid and power plants nearby
* Liverpool (cargo): at least 2Fosil gas plants available in neighborhood, capacity 1GW, wind farm 254MW, transmission lines close, substation available at Birkenhead (3miles from Liverpool city centre).
* Immingham (cargo): Gas plants and Wind farms nearby, close to the main grid, substation at Grimsby, 7 miles away.
* Aberdeen: Wind farms nearby, 300kV transmission grid available to Persley (substation)
2. Cost of building power plants and or transmission lines from the main electricity grid
3. Cost of building a power transmission station (transformer) to extract electricity from the main UK grid
4. Cost, capacity, emission, benefits and problems for using: Hydrogen, battery, or Hydro storage
5. Existing infrastructures: Main electricity grid, substations nearby
6. Wind power available at ports: amount produced, feasibility of usage
7. Cost of retail electricity at port
8. Cost of wholesale electricity (this is time dependent)
9. How much better is it to charge at off peak times?
10. Main supply issues: "The most important issues to address are electricity charging mechanisms, and planning for infrastructure development."
There was consensus among interviewees that shore-power as a business proposition suffers from four main problems:
* Shore-power projects are highly capital-intensive, particularly for ports, competing with many other potential projects in what are now very challenging economic circumstances.
* Uptake of almost all solutions to environmental problems requires some combination of financial or regulatory policy support. Neither are in place in the UK for shore-power.
* In the absence of supportive policy, shore-power’s viability stands on a business-case which is perceived to be very weak: returns are seen as being low, long and uncertain for both ports and ships.
* Shore-power projects are viewed as complex and difficult.
**Some questions following modelling and analysis:**
1. Is it economically feasible for a retail distributor to create a power transmission station?
2. How much time would it take to recover the initial investment?
3. If not, is government intervention needed, and how should this intervention be achieved: carbon tax, funding projects, etc.
-----
## Growth in UK power supply


-----
## Demand data/questions
Sam, Weemeng, Alex
 
Demand factors to consider: stick or carrot, price, timescale (weekly, daily, hourly), number of berthing slot, alternative demand sources, technical capability to take power, reasons for need?
See number of ships in port in the UK: https://www.marinetraffic.com/en/data/?asset_type=ports&columns=flag,portname,unlocode,photo,vessels_in_port,vessels_departures,vessels_arrivals,vessels_expected_arrivals,local_time,anchorage,geographical_area_one,geographical_area_two,coverage&flag_in|in|United%20Kingdom|flag_in=GB
### Plymouth
We called Cattewater Harbour Commissioners in Plymouth.
They can have one tanker at any one time. It comes in and out on the tides, typically staying for 24 hours. They average one tanker every two days.
What is the demand for this berth?
### London
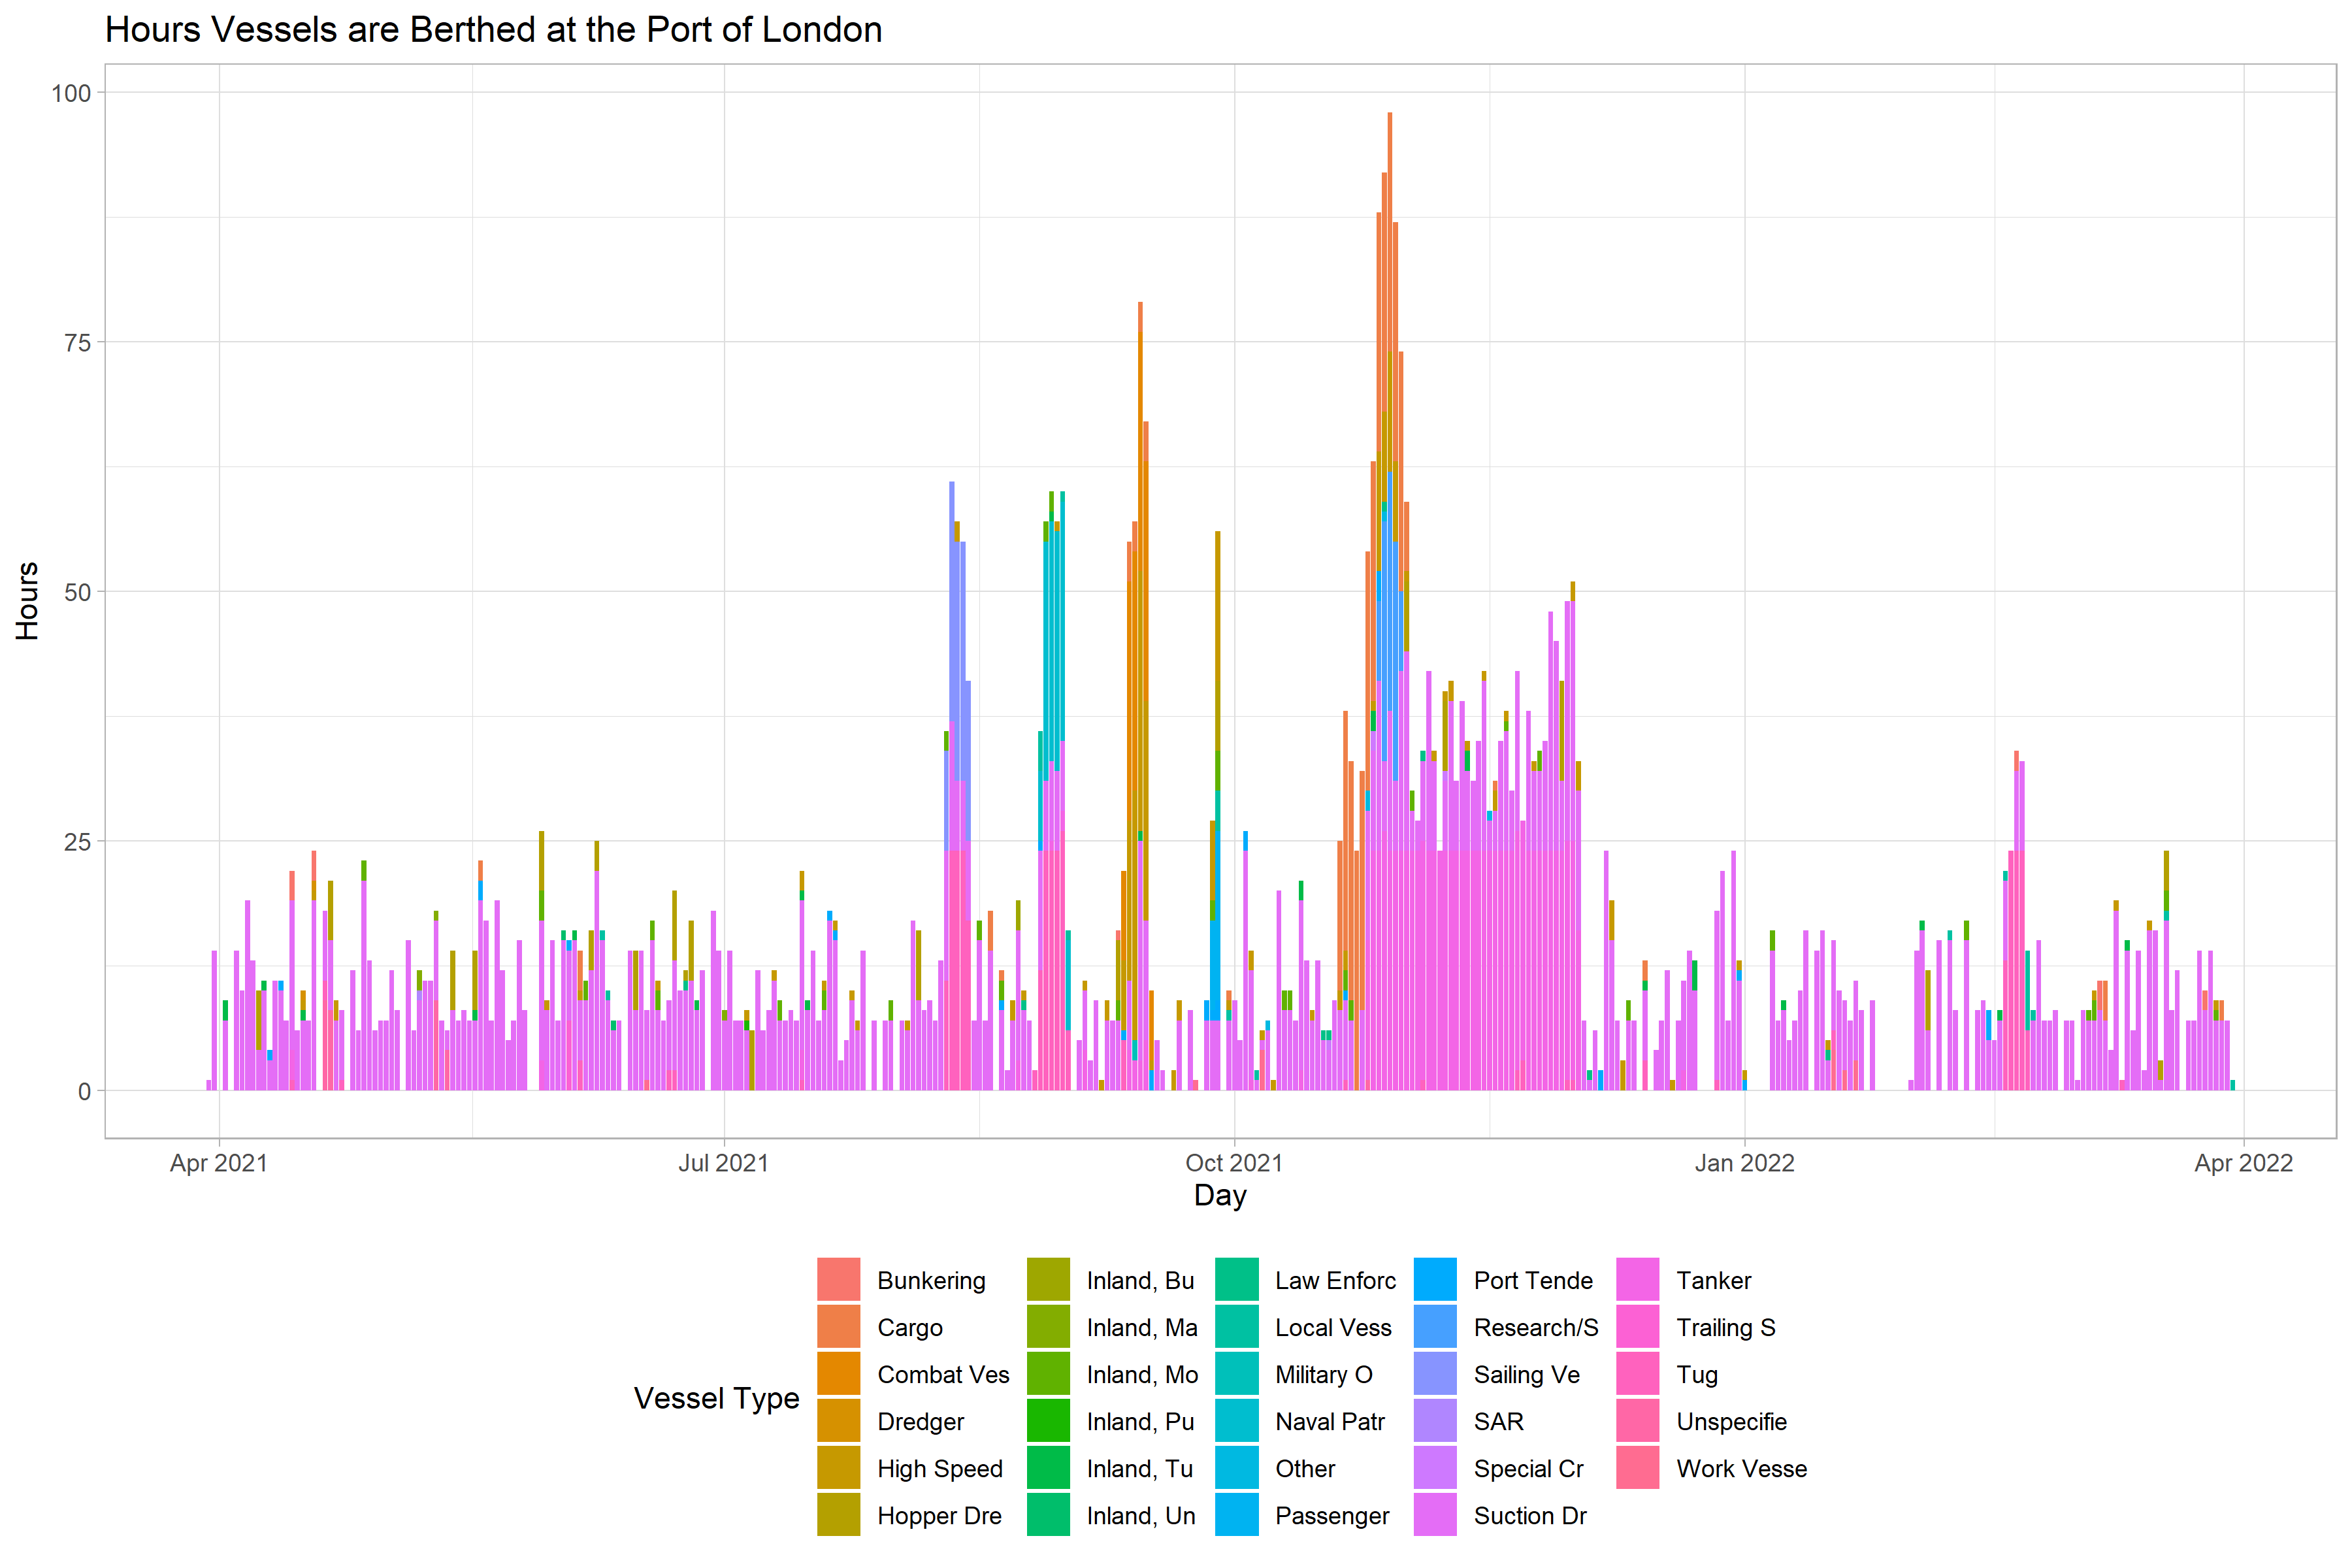
Interactive graph gives hover over details of vessels berthed.
[Full Screen](https://skamper1.github.io/STUDY_GROUP_Transport-Logistics-Challenges/hours_in_london_port_daily.html)
<iframe width = "100%" height=500 src= "https://skamper1.github.io/STUDY_GROUP_Transport-Logistics-Challenges/hours_in_london_port_daily.html"></iframe>

### Dover in March
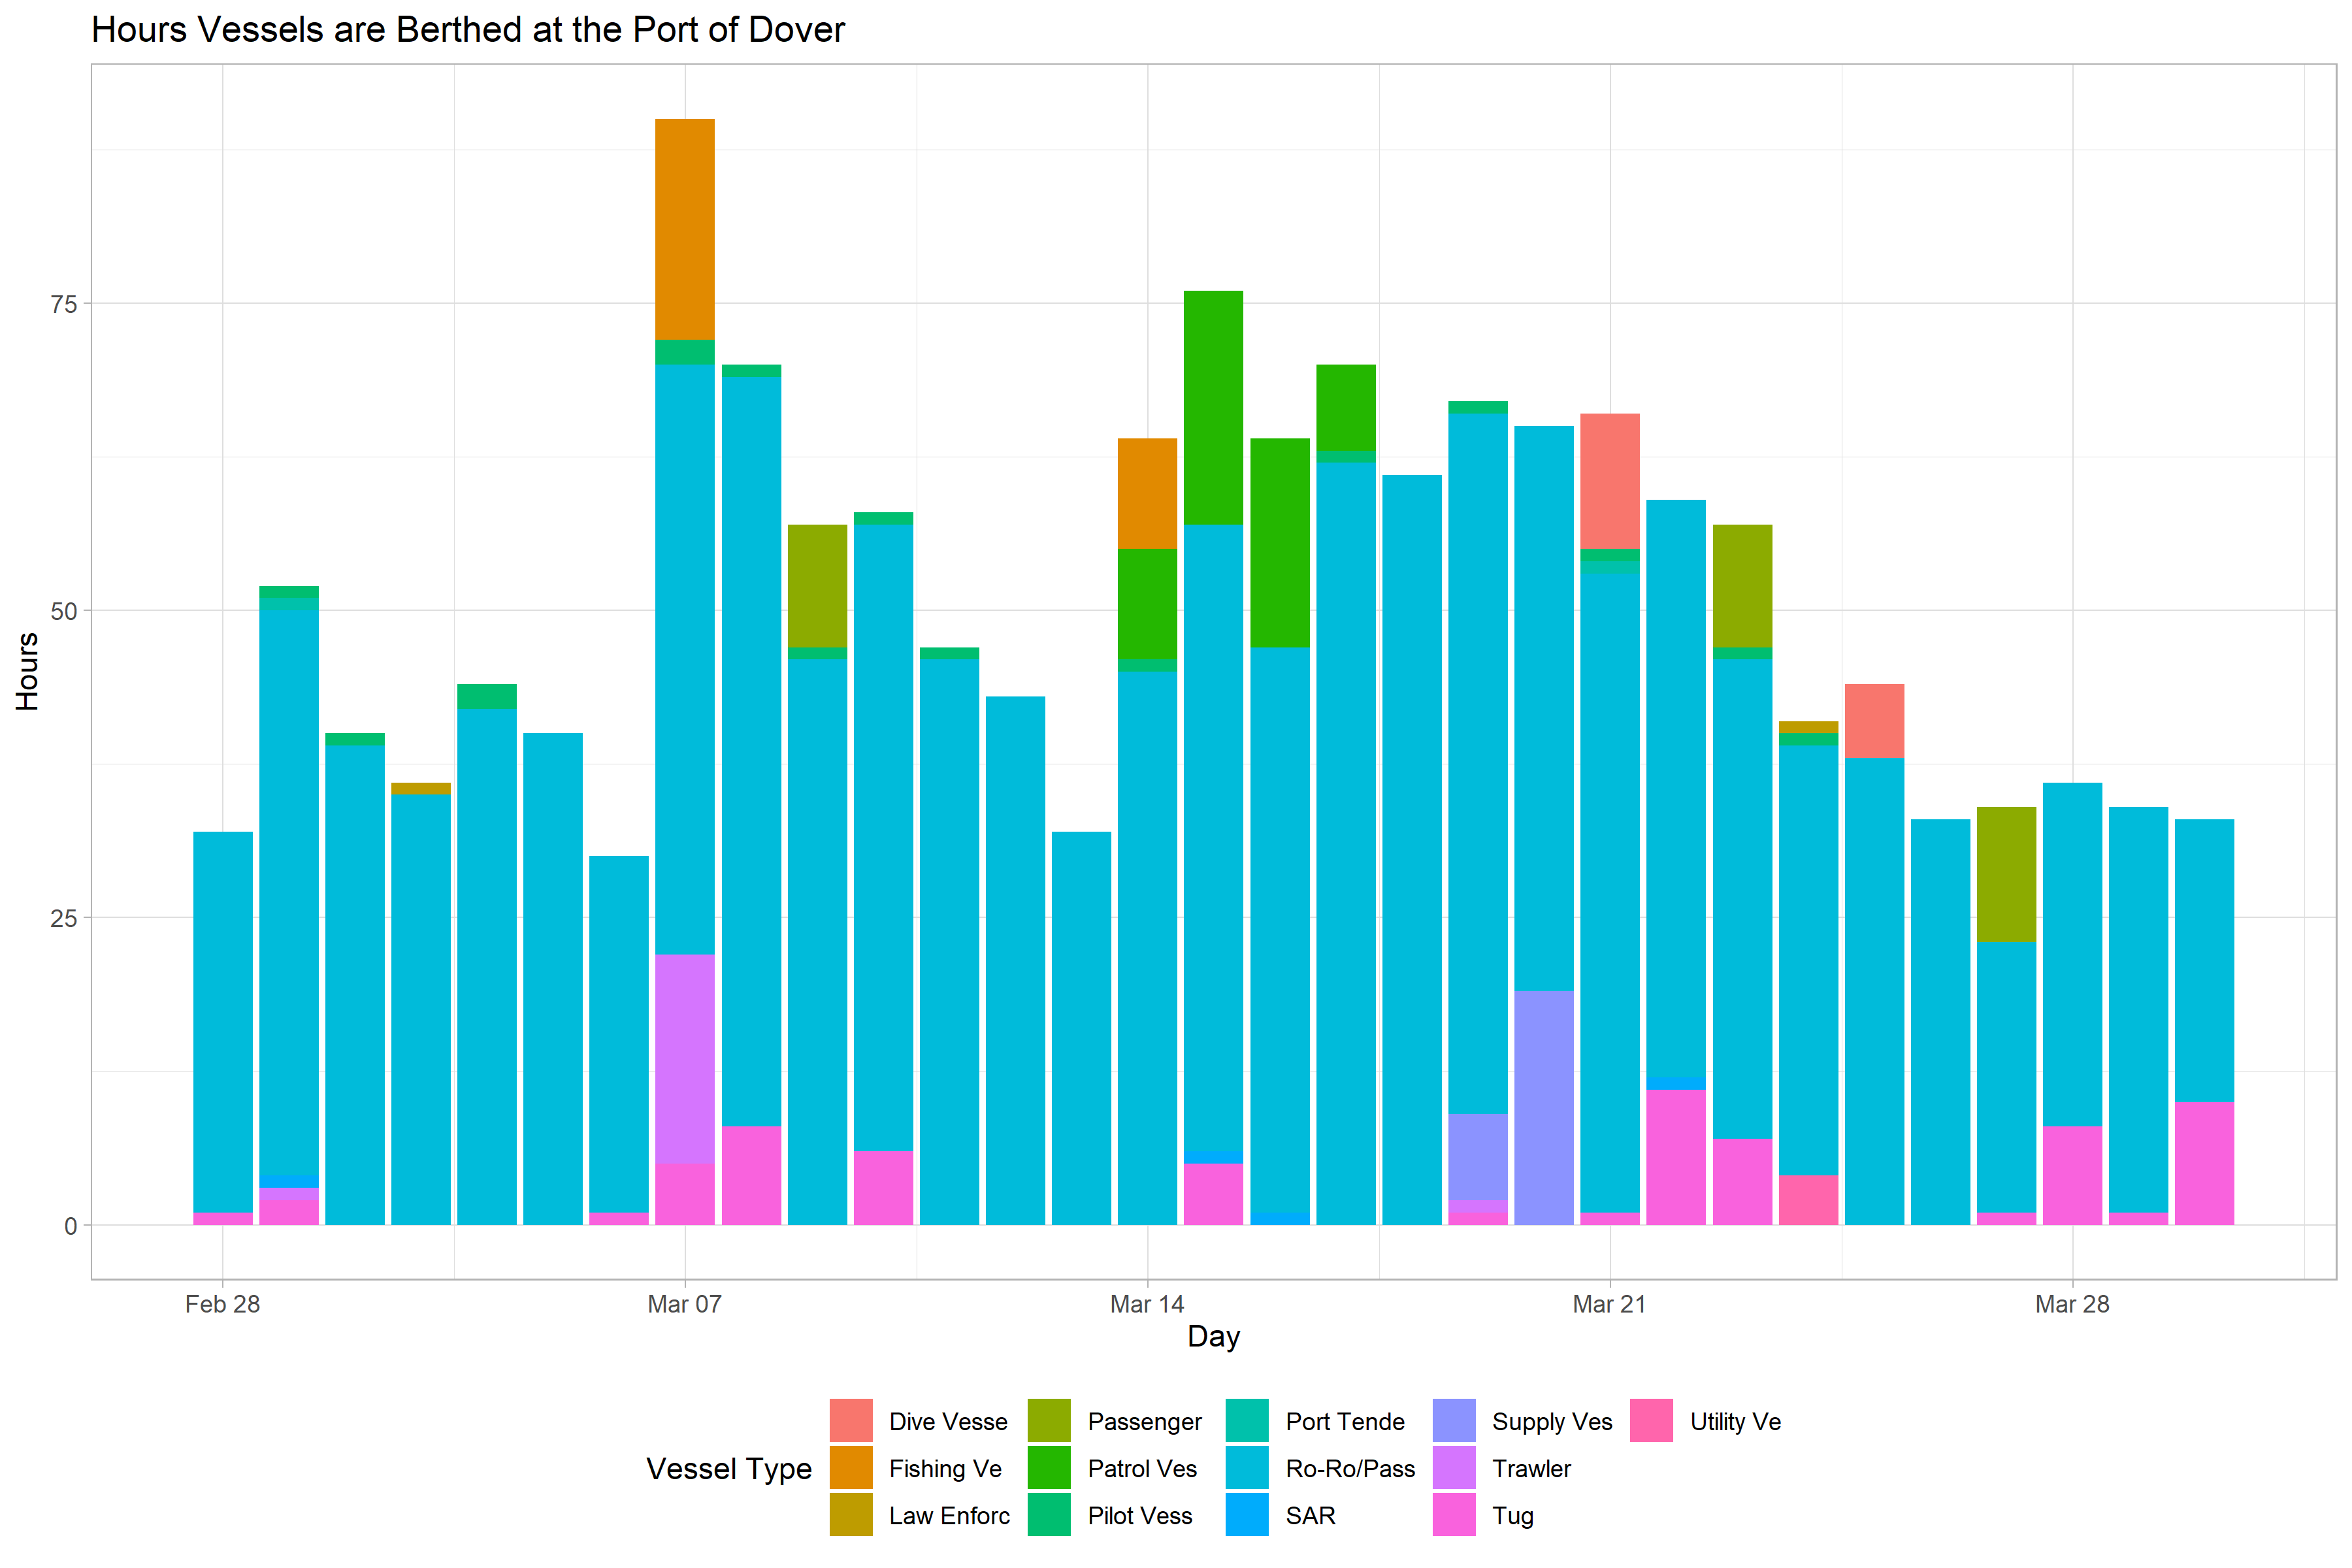
Interactive graph gives hover over details of vessels berthed.
[Full Screen](https://skamper1.github.io/STUDY_GROUP_Transport-Logistics-Challenges/hours_in_dover_port_daily.html)
<iframe width = "100%" height=500 src= "https://skamper1.github.io/STUDY_GROUP_Transport-Logistics-Challenges/hours_in_dover_port_daily.html"></iframe>
### Liverpool in March
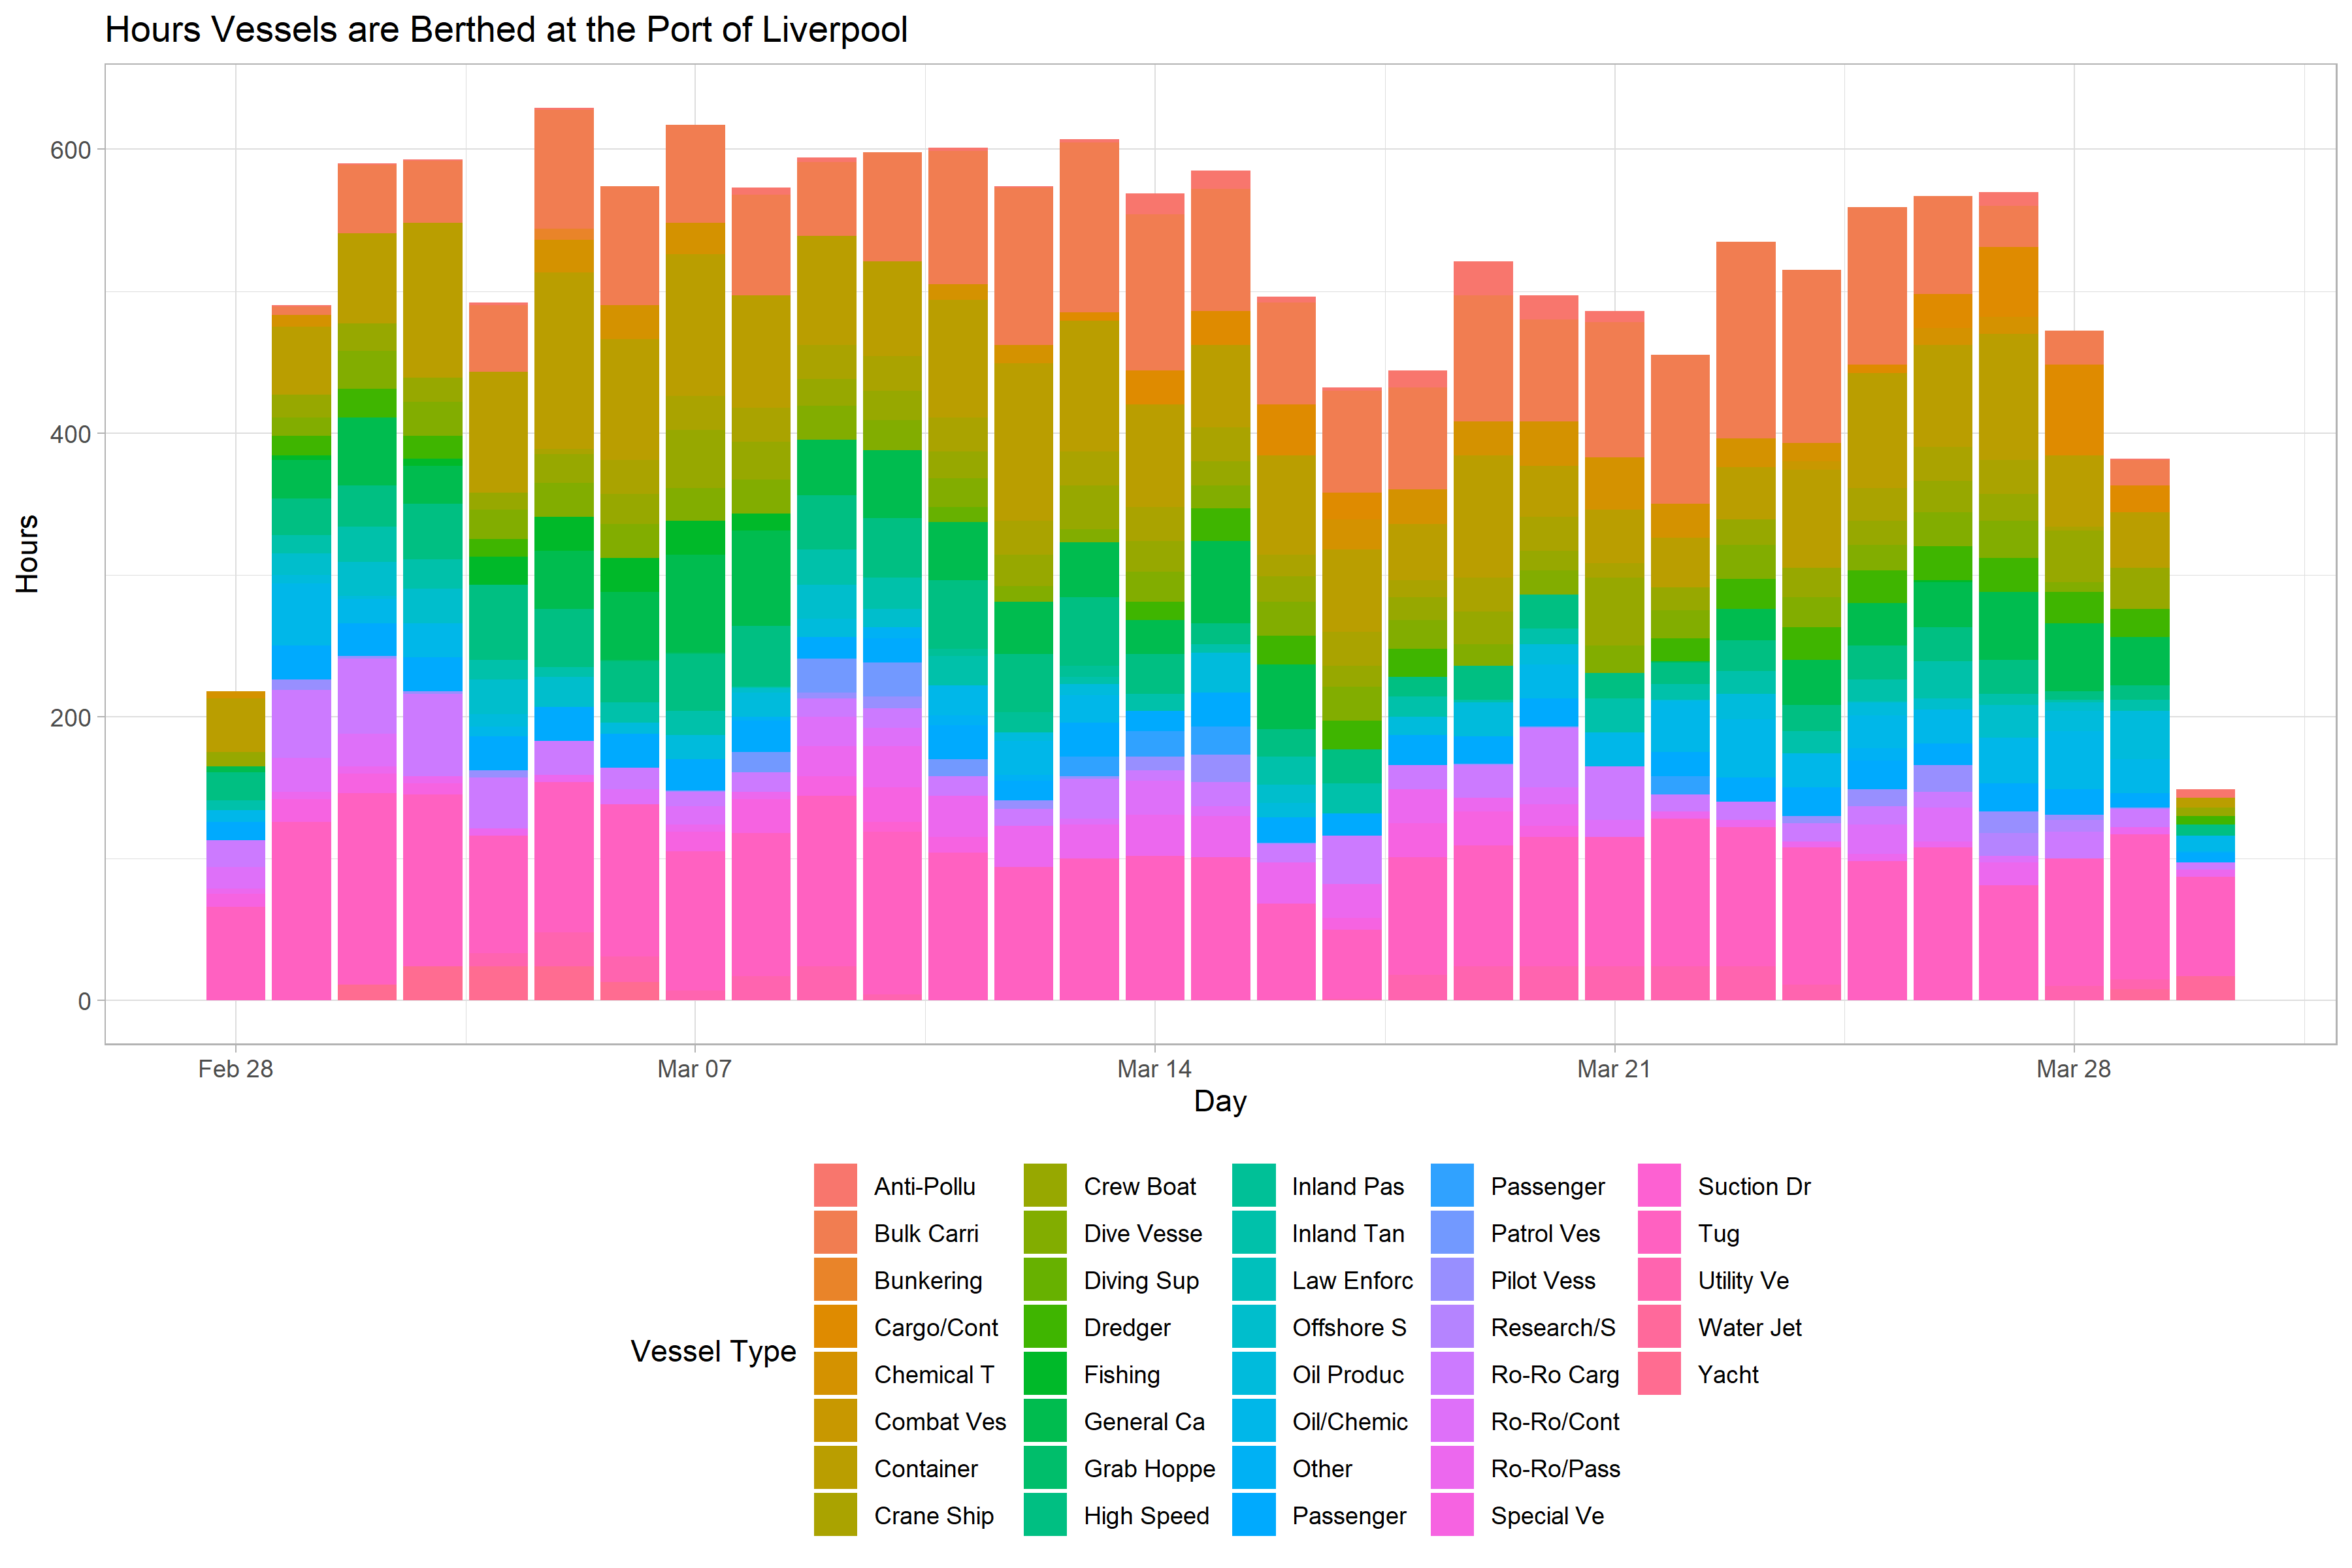
Interactive graph gives hover over details of vessels berthed.
[Full Screen](https://skamper1.github.io/STUDY_GROUP_Transport-Logistics-Challenges/hours_in_liverpool_port_daily.html)
<iframe width = "100%" height=500 src= "https://skamper1.github.io/STUDY_GROUP_Transport-Logistics-Challenges/hours_in_liverpool_port_daily.html"></iframe>
Selected Vessel Types in Liverpool
<iframe width = "100%" height=500 src= "https://skamper1.github.io/STUDY_GROUP_Transport-Logistics-Challenges/selected_cargo.html"></iframe>

### Consumption
Consumption per type of ship estimates:
* Container vessel: 5-10MW
* Dry cargo vessels: 1-4MW
* Ro-ro vessels:
* Tankers
**Want a statistical model for ship arrivals in terms of**
* Time of arrival
* Length of stay (distribution?)
* Size of ship
* Charging time (see [1], page 31)
Outcome: To get [min,max] power requirement?
Power demand: Depends on vessel type. Up to 3 MVA for ferry/RORO, 7.5 MVA for container ships and 20 MVA for cruise vessels. Berths need to have the appropriate infrastructure to meet the maximum power demand (see [2], page 5).
Literature review on shore power demand:
* Barriers to demand: Ships having capability? Ships having capability? Cost?
* Frequency berthed
* Mix of ships (container 1Mw Cruise ships 10Mw *Tyndall*)
* Assumptions made?
* Economic models (an inverse demand model, sensitivity to price)?
Reference:
[1] https://www.nek.no/wp-content/uploads/2019/03/DNV-GL-2017-0101_ReCharge.pdf
[2] https://wbcsdpublications.org/wp-content/uploads/2020/07/WBCSD_Business_Case_Shore_to_Ship.pdf
-----
**Power to drive a ship**
https://www.marineinsight.com/naval-architecture/power-requirement-ship-estimated/
https://www.usna.edu/NAOE/_files/documents/Courses/EN400/02.07%20Chapter%207.pdf
T tonnage (assumed proportional to volume)
* To push a ship through the water
$${\cal O}(T^{2/3})$$
* To keep it in harbour (heating, refrigeration, people support, for example)
$${\cal O}(T)$$
-----
## Port specifics
### Data tables UK port usage:
https://www.gov.uk/government/statistical-data-sets/port-and-domestic-waterborne-freight-statistics-port
### Simone's shipping movements data:
https://www.marinetraffic.com/en/ais/home/centerx:-1.4/centery:55.0/zoom:7
Huining, Yu
The main UK ports are:
1. Felixstowe
2. Southampton
3. London
4. Immingham
5. Liverpool
6. Aberdeen is probably also important
Portsmouth system architecture includes Digital twin-details say functional is this conjecture or existing?

Capacity

-----

## Existing studies, incentives, benefits
Tina, Ann, Nicolas
* Costs / Barriers:
- costs to obtain low sulfur fuels
- costs to remove pollution

* Policies in other countries
*https://pubs.acs.org/doi/pdf/10.1021/acs.est.5b04860
* Policy:
The California Air Resources Board (ARB), for example, requires ships in Los Angeles, Long Beach, Oakland, San Diego, San Francisco, and Hueneme to use shore power or equivalent control techniques to reduce at-berth emissions by 80% by 2020 (At-Berth Regulation, 2007).
* International Maritime Organization (IMO) regulations now require ships calling at U.S.ports to use cleaner, low-sulfur marine, gas or diesel oil, which can be up to 60% more expensive.
* marine pollution:
Ships entering the Emission Control Areas (ECA), which include the 200 nautical miles from the coasts of the US and Canada, the Baltic Sea, and the North Sea, are required to burn fuel with a maximum sulfur content of 0.1% (1,000 ppm) as of January 1, 2015 (International Maritime Organization, 2015). The higher cost of lower
sulfur fuels will alleviate cost concerns about using shore power.
* 9 million per year to run,
around 2% of cargo costs to adjust to use shore power.
* Benefits:
- Significant reduction of carbon emission (BPA, p.16), needs to be mitigated with source of electricity production (and projections for the next years)
- Shipping is the most energy efficient way of transport (lowest CO2 / tonne-km)
* infrastructure requirements:
- an industrial substation to receive power transmitted from the local grid, normally at 34.5 kilovolts (kV)
- a transformer to bring the voltage down to be compatible with the ship’s electrical specifications (i.e., 6.6 kV or 11.0 kV 3-phase, 60 Hz).
- A list of onshore infrastructure requirements includes: distribution switchgear, circuit breakers, safety grounding, underground cable conduits, electrical vaults, and power and communications receptacles and plugs.
- An existing berth must be modified to accommodate the installation of shore power cables and accessories.
- For the construction of a new berth, technical requirements and specifications of shoreside electrical and infrastructure can be included in the design phase.
- Ships participating in a shore power electrification program will require the installation of shore power cable receptacles and an associated electrical management system.Retrofits can be made to the existing fleet without the capacity of shore power.
----
# Cash flow
Simone
## Overview: Shore power transition
The British Ports Association (BPA) considers different aspects for the Shore power cost
1. First, there is a need for grants or loans to help with high capital costs. **No port worldwide has implemented shore-power without such support**. A green maritime fund to support shore power in the UK is clearly needed to help meet prohibitive costs, particularly around energy networks and generation (e.g. various ranges for Government support were mooted, from 50-100%. It was noted that in Germany, Government support was 90%).
2. Action must be taken to improve the margin between grid electricity and power from on-ship diesel. The UK Government can partially address this competitive disadvantage for grid electricity by exempting ships from electricity taxes, as has been done in countries like Germany, France, Sweden and Denmark.
3. Price of electricity in the UK is much higher than in countries where shore power is provided. Most ports with shore power provision have support to help make electricity as a marine fuel more competitive and that needs to be replicated in the UK
4. There is a lack of consistent demand from vessels calling in the UK for shore power. Government needs to address this. The BPA is putting forward a zero emission berth standard for discussion with industry and Government which would drive up demand for emissions abatement technology and provide certainty for investors.
The price each UK port pays for electricity varies, and is commercially confidential. *BEIS* reports that the average electricity price for a medium-sized UK industrial user is **12.8p/kWh**, with 4.6p/kWh of that being various environmental taxes. On average a further 5p/kWh of the final cost comes from three electricity network charges: transmission, distribution and balancing services. The remainder is the wholesale cost of electricity.
### Requirements of Different Vessel Types


The BPA suggest that vessels at berth in the UK used over **641,086,164 kWh** of energy in 2019. Removing vessels that were at berth for less than two hours, that number falls to **502,411,805 kWh**.
Research by Frontier Economics for the Department for Transport in 2019 forecasted energy demands from UK ports from shore power under a business as usual scenario to be around **5GWh** in 2026.
Total Power Usage of Vessels at Berth in 10 largest UK ports in 2019 (monthly totals in kWh)

### Cost for Shore power transition


### Emission intensity from Marine Diesel Engines
The diesel fuel used by OGVs is rich in sulfur but low in price. The International Maritme Organization (IMO) has established that fuels cannot contain a sulfur level higher than 5000 parts per million (ppm).
Together with fuel quality standards, IMO also set up regulations for engines
Pollutant and energy efficiency. These are Tier I through Tier III. We assume that after 2020 all ships belong to the Tier II category. The Emissions intensities are showed in the table below:
| Pollutant | 2020 (g/kWh) |
| -------- | -------- |
| SO$_X$ | 2.1 |
| NO$_X$ | 9.8 |
| PM | 0.38 |
| CO$_2$ | 610 |
The chart above shows demand variance throughout the year, however what it does not capture is that for every port there will be many berths.
## Methodology: discounted cashflow (DCF)
The DCF approach models the cost effectiveness of onshore power. Under this approach, the starting year is 2017 and the capital investments are made in equal amounts in three years between 2017 and 2019. The costs would be fully depreciated by 2035. The 15-year lifetime is in line with assumptions made by Environ and CARB. In addition to capital investment, the recurring costs include terminal O&M costs and extra costs of replacing diesels with electricity. We used a 10% discount rate in this analysis. Consistent with the prior sections, we assumed the onshore power would begin to operate in 2020. The benefits of applying onshore power to reduce emissions accrue between 2020 and 2035. The emissions reduction due to onshore power includes emissions reductions of NO$_X$ , SO$_X$, PM, and CO$_2$.
$$Cost Benefit = \frac{Net \, Present \, Value \; of \; Net \, Cash \, Outflow}{Emissions \, Savings}$$
The above equation represents the average cost effectiveness of onshore power for all container ships visiting the Port, but the cost of reducing one tonne of pollutant from each individual ship may vary. In this analysis, 6,000 (twenty-foot equivalent units )TEU container ship have been used as an example for a case study to demonstrate the effectiveness of a policy that encourages frequent callers to use onshore power to reduce overall compliance costs.
The Emission for all ships at berth for pollutant $j$ is given by
$$E_j = \sum_i (AE_i \; H_i \; EF_j \; LD_{i-AE} + Bo_i \; H_i \; EF_j \; LD_{j-B}) \frac{1}{10^6}, $$
where
1. $E_j$ is the total tonnage of emission $j$
2. $AE_i$ represents the auxiliary engine power of ship $i$ (Kw)
3. $LD_{i-AE}$ is the load of the auxiliary engine

4. $H_i$ is the total hours a ship stays at the port
5. $EF_j$ is the emission factor (grams per KWh) for emission $j$
6. $LD_{j-B}$ is the load of boilers

7. $Bo_i$ represents the power used in the boiler of ship $i$ (kW)
The total emissions reduction from switching to shore power can be determined using life cycle analysis and depends mainly on emissions from auxiliary engines and the emissions reduction rate from shore power. Boilers have to operate during the hoteling period regardless. In addition, connecting and disconnecting shower power with ships takes about three hours, during which auxiliary engines are running to produce electricity. The emission reduction is given by
$$E_j = \sum_i(AE_i (H_i – 3) EF_j )\frac{RR_j}{10^6},$$
where $RR_j$ is the reduction rate for emission $j$ from shore power for NO$_X$ , SO$_X$, PM, and CO$_2$.
### Data and assumptions
The most important components in the previous equations are the total number of ships and their hoteling hours at the berth.
Emissions from container ships are showed in the table below in terms of twenty-foot equivalent unit (TEU). Because auxiliary engine power is sparsely populated, default values for auxiliary engine and auxiliary boiler power from *Ng et al. (2013)* are used. The default values assume certain auxiliary engine power for each ship size category.

The emission factors of SO$_X$, NO$_X$ , PM, and CO$_2$, in grams per kWh, are obtained from different sources. Emission factors of SO$_X$ and PM based on the 0.5% sulfur level in marine fuels is used, as it came in effect as standard requirement in 2020. The emission factor for NO$_X$ is taken from *Ng et al. (2013)*, which is based on a 2007 emissions inventory. Ships built between 2007 and 2012 generally meet higher NO$_ X$ engine standards. We applied the average NO$_X$ emission factor in the global fleet to calculate NO$_X$ emissions in 2020 based on the Third IMO GHG Report (International Maritime Organization, 2014).

> We remark that the second column is consistent with the Emissions intensity table showed in the Section **Emission intensity from Marine Diesel Engines** for the UK scenario.
With the aforementioned data, assumptions, and methodology, it is possible to calculate the cost effectiveness of using onshore power for the container ship fleet visiting the port.
Two important variables influencing the cost-benefit analysis are the adoptability of onshore power by ships visiting a given port (**penetration rate**)and the number of ships already equipped with vessel-side onshore power infrastructure due to similar initiatives elsewhere.
Higher penetration rates will result in greater reduction of emissions and thus improve cost effectiveness. Higher percentages of ships already equipped with vessel-side infrastructure will reduce the investment requirements directly attributable to a given port’s shore power initiative and result in lower total costs as well.
Cost of reducing pollutants using onshore power for 80% penetration rate in Shenzhen


### Results
In this case study, we used the emission factors introduced in the previous Section to calculate savings of NO$_X$, SO$_X$, PM, and CO$_2$ between 2020 and 2035. The auxiliary engine power is also the same as the default value for a 6,000 TEU ship. We assumed the container ship
uses 20 hours of onshore power per visit and the fuel cost is $700 per tonne.
The figures below show the cost and benefit of NO$_X$ and PM reduction under different penetration rates and shares of ships originally equipped with onshore power visiting the Port of Shenzhen. Under the best scenario, where 60% of ships are already equipped with vessel-side
equipment and the shore-side infrastructure is 50% utilized, the average cost of reducing one tonne of pollutant is only a quarter that of the worst scenario, defined as 40% of ships already with vessel-side equipment and 10% utilization rate. Both figures point to
an important policy insight: **policies that are designed to attract ships already equipped with onshore power will significantly boost the cost effectiveness of onshore power in the port.**
Reduction NO$_X$

Reduction PM

References:
[1]https://theicct.org/publication/costs-and-benefits-of-shore-power-at-the-port-of-shenzhen/
[2]https://www.researchgate.net/publication/298026922_Assessment_of_marine_auxiliary_engines_load_factor_in_ports
[3]https://www.researchgate.net/publication/257522249_Policy_change_driven_by_an_AIS-assisted_marine_emission_inventory_in_Hong_Kong_and_the_Pearl_River_Delta
### Cost-benefit equations
Reference from https://pubs.acs.org/doi/suppl/10.1021/acs.est.5b04860/suppl_file/es5b04860_si_001.pdf
$$benpvt_{i,j}=(m-e_j)\times ener_{i,j}\times o_{i,j}$$
where $benpvt_{i,j}$ is the **private benefit** for each vessel, in dollars per year, if the vessel $i$ choose to use shore power at port $j$.
$m$ is the cost of electric power generated from marine fuel on board the vessel.
$e_j$ is the average price of electricity of industrial use at port $j$.
$ener_{i,j}$ is the amount of energy generated at berth.
$o_{i,j}$ is a binary decision variable. $o_{i,j}=1$ when the vessel $i$ uses shore power at port $j$. Otherwise $o_{i,j}=0$.
$$benenv_{i,j}=ener_{i,j}\times o_{i,j}\times\sum_q(eim_q-\dfrac{eie_{q,j}}{1-t})\times sc_{q,j}\times10^{-6}$$
where $benenv_{i,j}$ is the net annual **environment benefit** if the vessel uses shore power instead of marine fuel. .
$eim_q$ is the emission index, in grams per kWh, for pollutant $q$ from marine fuel. $q$ is taken from {$NO_X$,$SO_2$,$PM_{2.5}$,$CO_2$}.
$eie_{q,j}$ is the emission index for pollutant $q$ from electricity at port $j$.
$t$ describes the ratio of transmission and distribution loss in shore power.
$sc_{q,j}$ is the value of emitting pollutant $q$ at port $j$.
----
# Modelling questions
-----
* Capacity and mix of charging sources eg. Hydrogen/renewables
* Emmision reduction
* Cost/benefit analysis
* Capacity vs need
* Uncertainty
## Modelling
### cost model
### capacity model
### benefit model
-----
### General notes
### Government Tools
* Exploring the potential of government’s coordinating function. For example, commissioning research, producing guidance for port operators concerning planning and energy network requirements, and facilitating collaboration across the sector as well as information sharing. This could also include exploring other potential measures to unlock private investment.
* Exploring the potential of government mandates through regulation. This could include requiring vessels and ports to report on the usage of shore power, requiring vessels to use shore power when in port, and requiring ports to install shore power infrastructure.
* Exploring the potential of market-based measures. This could include economic instruments based on the “polluter pays principle9”, to incentivise the adoption of shore power by vessel and port operators.
### Policy support
* Ports are generally owned by the state (e.g. Canada, Spain, US), the muniplicities (e.g. Norwey, Sweden), local government (e.g. China), or other public institutions (e.g. Germany).
* Public fundings are the main funding source:
1. Transport Canada received regional fundings and investment from other public sources. Other projects have been funded by federal and other public sources.
2. German government announced 140m Euros for shore power in German ports.
3. Norway has several standing grant schemes and one state funding body Enova is financed with between £160m and £320m partly by **electricity levy** and partly by state funding.
4. Spainish National Ports Agency has undertaken a 6m Euros for shore power in Spanish ports, which has been co-financed with 1.4m Euros from the **EU's Connecting Europe Facility**.
5. Ports in Sweden have accessed public funding through the KlimatKlivet ('Climate Leap') fund.
6. Same for the US, e.g. California.
7. p.s. China has also received some private investment and private operations, but in partnership with the state as joint ventures.
* Further policy is necessary to improve the benefit.
1. (Vancouver Fraser Port Authority) Vessels only pay for their metered energy and not the peak demand. The port also offers a 47% discount to vessels that have the ability to connect.
2. German government proposed to remove a large portion of a tax on electricity, e.g. 80% for shoreside electricity by mid-2020, and also to allow special arrangements for the supply of power to shore connections, plus discount on the price.
3. Spanish government lowered tax from 5% to a "symbolic sum" of 0.05 Euro per kWh.
4. Swedish government reduced tax on shoreside electricity by 98%.
<span style="color: red"> Maths looks like this </span>
$$x^3 + y^3 = z^4$$
Lists look like this:
* **Item one**
* *Item two*
* Item three
Figures look like this:

 Sign in with Wallet


