# Observability and the opentelemetry project
slides: https://hackmd.io/@pulp/H1TXoJPBs#/
---
## What is Observability?
In production, complex infrastructure (both hardware and software) is often like a black box. When things start to go wrong, it is critical to know early and to have enough relevant information to pinpoint the issue quickly.
---
Observability lets us understand a system from the outside, by letting us ask questions about that system without knowing its inner workings. Furthermore, allows us to easily troubleshoot and handle novel problems (i.e. “unknown unknowns”), and helps us answer the question, “Why is this happening?”
https://opentelemetry.io/docs/concepts/observability-primer/
---
"There was no monitoring, there was no dashboard, there was nothing, there was no place to look to see if the site was working today or not, except for CNN"
-- Mikey Dickerson on being brought in to help fix healthcare.gov
(don't do that. have monitoring.)
---
## The Three Pillars of Observability
Metrics, Logs, and Traces
---
## Metrics
Numeric representations of data measured over intervals of time.
Easy to visualize and correlate, efficient to generate, collect and store
---
e.g:
* requests per second
* failures per second
* megabits per second
* resource utilization (CPU, RAM, Disk)
* active logins
* rolling average (or buckets) of request latency
---
## Logs
An immutable, timestamped record of discrete events that happened over time.
Doesn't require much explanation.
Logs are great, but there can be "too much of a good thing", it is difficult to piece together a failure from a mountain of logs in real time. And they don't provide much context.
---
## Traces
An end-to-end, detailed construction of an entire action, which can sometimes cross service boundaries.

---
## Traces vs. Logs
Traces are a bit like logs on steroids. They are typically associated with a particular user request or transaction, and include data about significant steps during the processing of the request, including potentially hops across different services.
---
More structure available than logs
```
server{host="localhost", port=8080}
0ms INFO starting
300ms INFO listening
conn{peer_addr="82.9.9.9", port=42381}
0ms DEBUG connected
300ms DEBUG message received, length=2
conn{peer_addr="8.8.8.8", port=18230}
300ms DEBUG connected
conn{peer_addr="82.9.9.9", port=42381}
600ms WARN weak encryption requested, algo="xor"
901ms DEBUG response sent, length=8
901ms DEBUG disconnected
1502ms WARN internal error
1502ms INFO exit
```
---
## Point
It's easier to go from a structured collection of correlated events (a trace) to flat uncorrelated logs, than to go from a set of uncorrelated log events to a trace. Thus sometimes logging functionality provided by a tracing library is preferable since it works both ways.
---
## Tracing vs. Profiling
Most developers are familiar with the concept of "profiling" - a way of automatically instrumenting a program so that performance can be measured in a fine-grained way, often down to individual lines or functions.
---
A mental model of a tracing is thus:
* Tracing is aware of request / response cycles
* Instead of being fully automatic, we add the instrumentation to the code ourselves, and annotate with context
* Tracing (can) track parameters
---
## What is opentelemetry?
"OpenTelemetry is a collection of tools, APIs, and SDKs for instrumenting, generating, collecting, and exporting telemetry data (metrics, logs, and traces) to help you analyze your software’s performance and behavior."
https://opentelemetry.io/
---
## Quick note
The "telemetry" in "opentelemetry" is closer to "a user monitoring their application" than what the Pulp team refers to as "telemetry" which is "automated usage feedback provided by". The overlap is very limited.
---
## Opentelemetry is an emerging standard
The project is part of the CNCF, the same organization behind Kubernetes.
Opentelemetry is rapidly becoming the standard set of libraries (across many programming languages) you use to get this functionality. The ecosystem is largely consolidating around opentelemetry.
---
## Supported languages
Python, Ruby, C++, Go, .NET, Java, Javascript, Rust, Swift, PHP, Erlang/Elixr
---
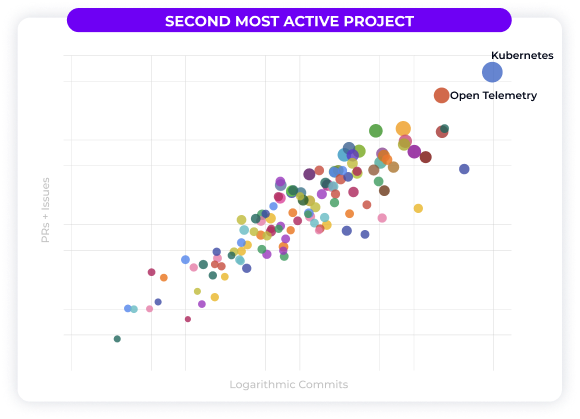
Second most active CNCF project, behind Kubernetes
---
## Why opentelemetry?
Applications are getting more distributed. Many applications (including Pulp) are spread multiple services, even if they are not architected as "micro-" services.
And even monolithic applications are often reliant on "services" such as a database, a Redis cache, etc.
---
Monitoring a distributed application presents unique and difficult challenges, and the ecosystem strongly benefits from the network effects of building standards.
The consolidation around opentelemetry means that collection backends and other tools can be swapped without needing to re-instrument code using entirely new libraries.
---
Opentelemetry became the standard toolset for tracing early on, and is expanded from there to metrics and logs.
---
## Components of OpenTelemetry ("otel")
API, SDK, Collector
https://trstringer.com/otel-part1-intro/
---
API: in charge of gathering the telemetry and all the data that is part of it
SDK: what gets this data out of the current observed process to another entity for analysis.
---
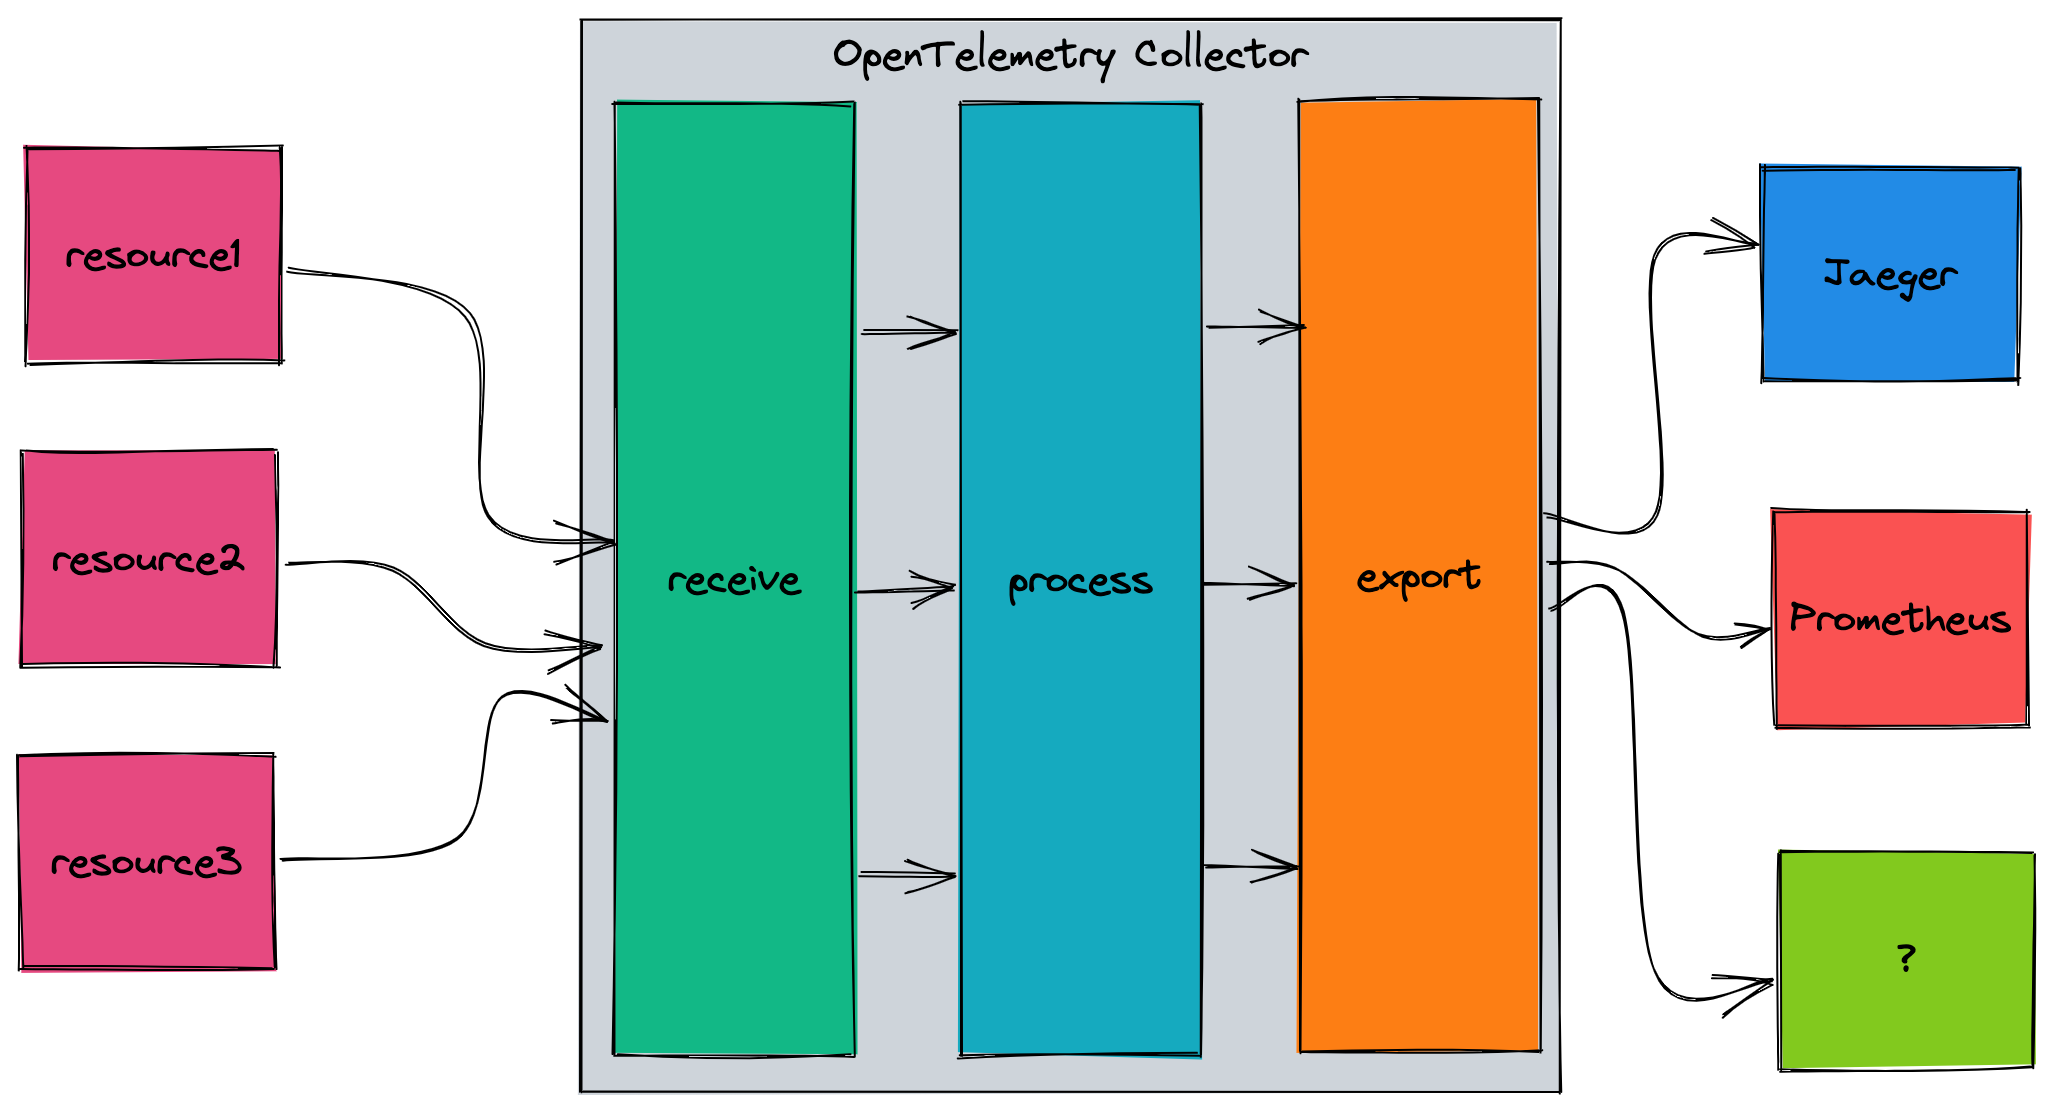
Collector:
* Receives telemetry data
* Processes telemetry data
* Exports telemetry data
---
https://trstringer.com/otel-part4-collector/
---
"So why choose the OTel Collector when you can send directly to Jaeger, Prometheus, or the console? Because of flexibility:"
* Duplicate telemetry data from the collector to multiple endpoints
* Process the data (adding/removing attributes, handling batching, etc.) before sending it to another destination
* Decouple the producer with the consumer
---
## How is this different from Prometheus?
Prometheus is a time-series metrics monitoring tool, it comes with a data storage solution and some analytics capability.
Opentelemetry is a vendor-agnostic set of specifications and libraries. It doesn't do analytics or storage, you need to choose a backend for that. But the data can be exported into almost any backend, including Prometheus!
---
## Back to metrics
Metrics are usually about aggregating data.
An aggregation is a technique whereby a large number of measurements are combined into either exact or estimated statistics about metric events that took place during a time window.
Common aggregations: sum, count, average, histogram
---
## Metrics in opentelemetry
Examples from:
https://uptrace.dev/opentelemetry/python-metrics.html#getting-started
https://uptrace.dev/opentelemetry/metrics.html
---
**counter:** a value that is summed over time – you can think of this like an odometer on a car; it only ever goes up.
**measure:** a value that is aggregated over time. This is more akin to the trip odometer on a car, it represents a value over some defined range.
**observer:** captures a current set of values at a particular point in time, like a fuel gauge in a vehicle.
---
## Synchronous measurements:
Synchronous instruments are invoked together with operations they are measuring. For example, to measure the number of requests, you can call counter.Add(ctx, 1) whenever there is a new request.
---
Counter
```Python
counter = meter.create_counter(
name="total_requests", description="TODO", unit="1",
)
counter.add(1)
counter.add(10)
```
e.g. number of requests, bytes read/written
---
Bidirectional counter
```Python
counter = meter.create_up_down_counter(name="updown_counter", description="TODO")
while True:
if random.random() >= 0.5:
counter.add(+1)
else:
counter.add(-1)
time.sleep(1)
```
e.g. number of active connections
---
Histogram
```Python
histogram = meter.create_histogram(
name="some.prefix.histogram",
description="TODO",
unit="microseconds",
)
while True:
histogram.record(random.randint(1, 5000000), attributes={"attr1": "value1"})
time.sleep(1)
```
e.g. request duration
---
## Asynchronous instruments
Asynchronous instruments (observers) periodically invoke a callback function to collect measurements. For example, you can use observers to periodically measure memory or CPU usage.
---
GaugeObserver
```Python
def callback():
# calculate current value on-demand
return [Measurement(random.random())]
gauge = meter.create_observable_gauge(
name="some.prefix.gauge_observer",
callback=callback,
description="TODO",
)
```
Non-additive values for which sum does not produce a meaningful correct result, e.g. resource utilization, error rate (percentage)
---
## Collection
Metrics are automatically collected by opentelemetry in-process, aggregated & exported.
Unlike logs, the cost of metrics doesn’t increase in lockstep with user traffic or any other system activity that could result in a sharp uptick in data. Client-side aggregation reduces traffic.
---
## Tracing
---
## Terminology
Source: https://www.aspecto.io/blog/distributed-tracing-with-opentelemetry-rust/
Source: https://opentelemetry.io/docs/concepts/observability-primer/
---
### Span
"A Span represents a unit of work or operation. It tracks specific operations that a request makes, painting a picture of what happened during the time in which that operation was executed.
A Span contains name, time-related data, structured log messages, and other metadata (i.e. Attributes) to provide information about the operation it tracks."
---
### Trace
A Trace records the progression of requests (made by an application or end-user) as they propagate across different services and components in our app (DB, data sources, queues, etc.)
Like ‘Call-stacks’ for distributed services. Traces represent a tree of spans connected in a child/parent relationship.
---
Without tracing, it is challenging to pinpoint the cause of performance problems in a distributed system.
---
### Attributes
We want any and all data relevant to a "span" to be available, so that we can draw conclusions when investigating the trace. Attributes are metadata attached to the span such as:
* username
* (shopping) cart ID
* user agent
---
### Exporter
Once we create a span within our application, the exporter handles sending the data to our backend (e.g., in memory, Jaeger Tracing, or console output)
---
## What does this look like in practice?
Live demo
---
## What I didn't get to:
* Using with Kubernetes
* Autoscaling based on metrics
* Showcasing otel metrics
* Deeper demonstration of tracing
---
###### tags: `PulpCon 2022`
{"metaMigratedAt":"2023-06-17T13:46:23.571Z","metaMigratedFrom":"YAML","title":"Observability and the opentelemetry project","breaks":true,"description":"slides: https://hackmd.io/@pulp/H1TXoJPBs#/","contributors":"[{\"id\":\"191376ae-ffab-4a37-b020-820f7bc62a81\",\"add\":23257,\"del\":12195},{\"id\":\"1a6032ad-e6b7-434d-aa35-96e6ebf50256\",\"add\":1,\"del\":0}]"}