# driB^Dat
good :watch: = :heartbeat: hackathons
<small>Permalink: **bit.ly/hello-dribdat**</small>
<small>Presented in the Open Space at [Open Education Day 2023](https://openeducationday.ch/)</small>
---

[Google Trends](https://trends.google.com/trends/explore?date=all&q=hackathon,barcamp&hl=en) for Barcamp vs. Hackathon
---
<!-- .slide: data-background="#333333" -->
[](https://en.wikipedia.org/wiki/More_Cowbell) <!-- .element: style="margin:0px;border:0px;box-shadow:none" -->
## Let's [Hack It](https://all.utou.ch/games/morecowbell/) like [The Bruce](https://en.wikipedia.org/wiki/More_Cowbell)
<small><i>Image: (c) NBC via [Wikipedia](https://en.wikipedia.org/wiki/More_Cowbell), Fair Use</i></small>
---
### 1. Find a challenge
<!--  -->

----
The open source [dribdat](https://dribdat.cc) platform generates this overview of a hackathon. In white are the "blueprints", or Challenges, of suggested topics, open issues, ideas. You can hover over them for a short summary, or open them up to get more details. The [backboard](https://github.com/dribdat/backboard) is an alternative frontend, that offers even more flexibile visualization through the API.
---
### 2. Sign in and say hello

----
Once you have found a topic of interest, open the project page and tap on the blue **Join** button at the top. When you create an account, you can fill out a **Profile** to introduce yourself, choose a role, and recruit further team members for your challenge.

---
### 3. Get the data
<img width="50%" src="https://i.imgur.com/VxoXuX5.png"><img width="40%" src="https://i.imgur.com/2d1y1L4.png">
----
You can upload small datasets (CSV, JSON, ..) directly into the project. Dribdat also integrates with [Opendata.swiss](https://opendata.swiss) and [Data Packages](https://frictionlessdata.io). It allows configuring **Resource** areas where organizers and participants can share tools and sources. These can even be auto-suggested to teams based on their progress, or used as **Templates** for new projects.
---
### 4. Post an update

----
Once you join a project, buttons appear at the top of the page allowing you to **Post** status updates, progress through [stages](https://dribdat.cc/about.html), and **Edit** links to your hackathon outputs. You can also Leave (★) the project if you joined one by accident.

---
### 5. See the results

----
Shared text documents, a folder full of sketches, datasets, and any other online materials can be showcased. Put whatever is currently the most actively developed prototype at the top (in the **Demo Link** with the Embed option), and list links to any other relevant materials in your description or posts.
---
### 6. Get feedback

----
You can use either the built-in **Comment** button on top, or the **Contact** link - connected to an external chat channel or contact page - to leave constructive commentary and motivate your peers. The on-platform updates appear directly on the team's **Log** and in the **Dribs** section.
---
### 7. Keep an eye on the clock

----
The countdown timers and **Dashboard** on the home page are handy ways to keep track of your available time, and see progress reports from all the teams. Put it on a second screen, or your mobile phone. Keeping the pace is the organizers main task, and we would like to make it easier.
---
### 8. Get the data
 <!-- .element: style="margin:0px;border:0px;box-shadow:none" -->
----
[](https://forum.opendata.ch/t/an-open-platform-for-documenting-hackathon-projects/156)
----
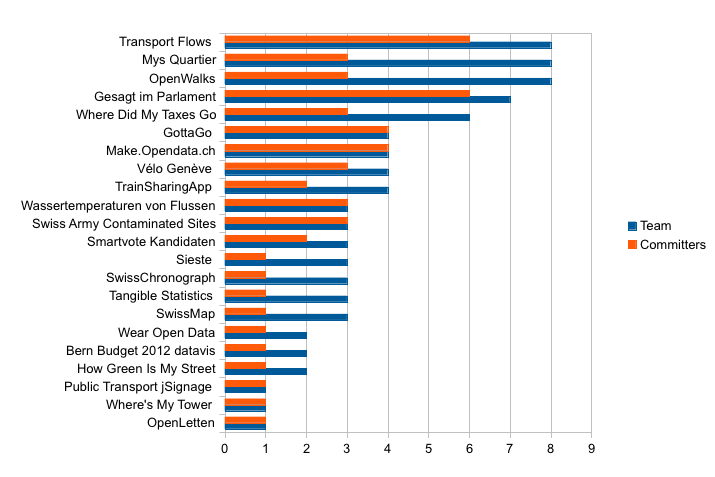
You can drill into various statistics from the data provided by the hackathon platform's APIs. Besides making lovely infographics, it will hopefully help you run a sustainable, effective, enjoyable community. In Dribdat you can find this on the **About** page linked in the footer.
---
## 9. Why use Dribdat?
- Swiss made software :flag-ch:
- Open source goodness :snake:
- Open Data in the kernel :open_file_folder:
- Multiplatform to the bone :meat_on_bone:
- More awesome hackathons :rocket:
- It's fun to "dribble" with "data" :basketball:
- And, last but not least, ...
---
<!-- .slide: data-background="#000000" -->
 <!-- .element: style="margin:0px;border:0px;box-shadow:none" -->
150% _More Cowbell_ :bell: :sunglasses:
---
:heart_decoration:
Please contribute any further ideas and feedback to our [online discussions](https://github.com/orgs/dribdat/discussions)!
---
# 10. PRO TIPS 🏅
Random advice from the hacklines.
---
### Volunteering is a labor of love
[](https://forum.opendata.ch/t/25-26-8-truth-within-statistics/373)
---
### Go big on tolerance & diversity - or go bust!
[](https://hack.opendata.ch/event/29)
---
### Have a relaxed, supportive atmosphere

---
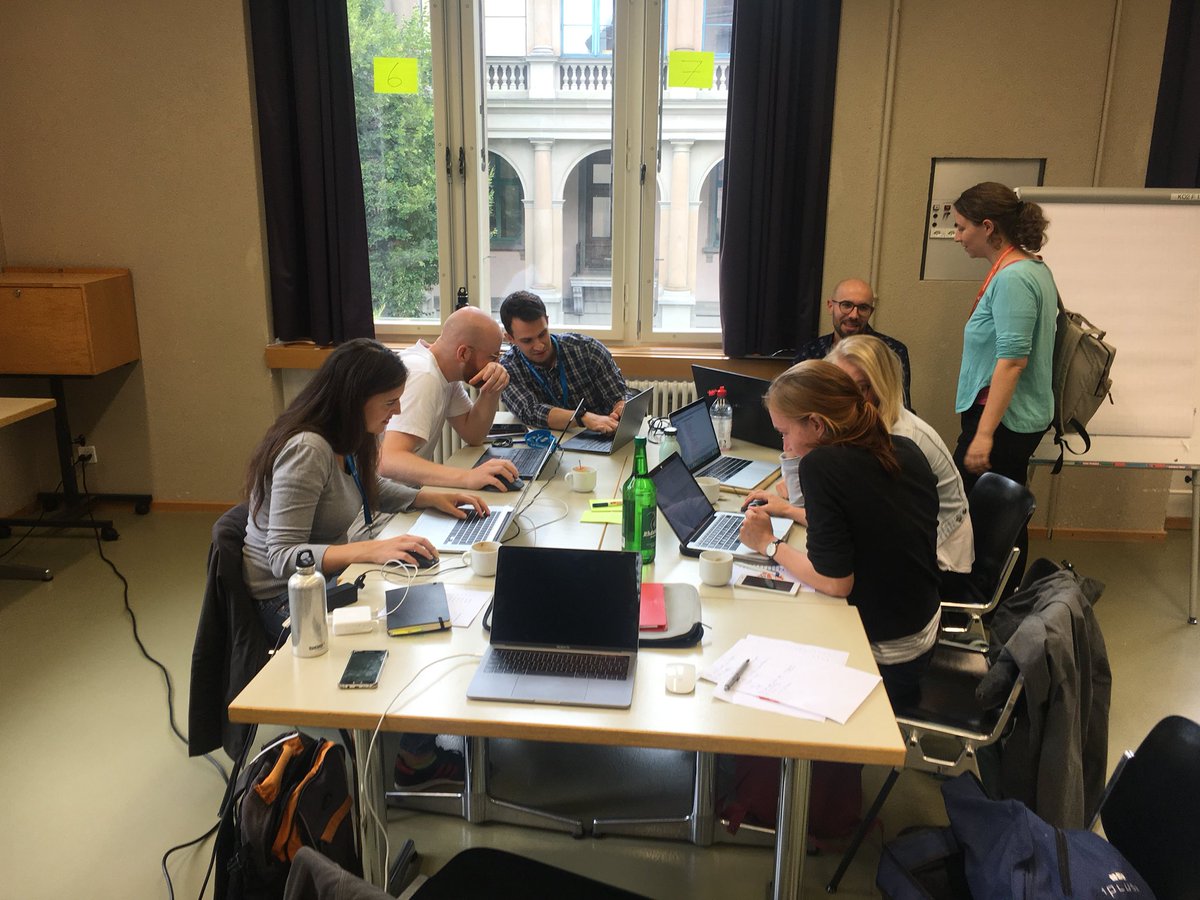
### Mealtimes are awesome for teambuilding

---
### Don't skimp on helping hands
[](https://hack.opendata.ch/project/26)
---
### Walk the walk of sustainability
[](https://hack.opendata.ch/project/74)
---
### Be relentless in pursuit of fairness
[](https://hacknight.dinacon.ch/project/23) <!-- .element: style="margin:0px;border:0px;box-shadow:none" -->
---
### Acknowledge contribution
[](https://github.com/hackathons-ftw/dribdat/issues/204) <!-- .element: style="margin:0px;border:0px;box-shadow:none" -->
---
 <!-- .element: style="margin:0px;border:0px;box-shadow:none" -->
<small><i>Image: [Wikipedia](https://commons.wikimedia.org/wiki/File:The_Hitchhiker%27s_Guide_to_the_Galaxy.svg), CC0</i></small>
---
{%youtube QNHNjr50p74 %}
### Everyone's a winner! :heart:
---
### Bring it together
:open_hands:
**Fair** competition through cooperation and content
:penguin:
Let's **hack** on open data with people at heart
:basketball:
We maintain **dribdat** so you get awesome data
---
Thanks for listening/reading. Pass it forward: **bit.ly/hello-dribdat**
Reach out: :love_letter: dribdat@datalets.ch :bird: [@dribdat](https://twitter.com/dribdat) :octopus: [@dribdat](https://github.com/dribdat)
<small>This presentation is shared under [CC BY 4.0](http://creativecommons.org/licenses/by/4.0/)</small>

{"metaMigratedAt":"2023-06-15T12:57:22.404Z","metaMigratedFrom":"YAML","title":"dribdat intro slides","breaks":true,"description":"View the slide with \"Slide Mode\".","slideOptions":"{\"theme\":\"white\"}","contributors":"[{\"id\":\"a4deb1ce-5c23-401b-81e4-d8091a101d53\",\"add\":17852,\"del\":9204}]"}