# Archive of LUMI Coffee Break 2025
This is the archive document of the past sessions of the public LUMI coffee break.
The archived questions and answers of 2024 sessions can be found here: https://hackmd.io/@lust/coffeearchive2024
The archived questions and answers of 2023 sessions can be found here: https://hackmd.io/@hpc/coffeearchive2023
The archived questions and answers of 2022 sessions can be found here: https://hackmd.io/@hpc/coffeearchive2022
:::info
Link to document for the __next coffee break__: https://md.sigma2.no/lust-coffee-break
:::
[TOC]
## Past sessions:
### 2025-03-26 13:00 -- 14:00 CET
#### LUMI Updates
- Trainings
- Lumi-G Hackathon -- 12.-16.5.25 in Oslo, Norway
- Get expert help to optimize your code for LUMI (especially AMD GPUs). 5 day intense workshop
- Registration: https://www.lumi-supercomputer.eu/events/lumi-hackathon-spring2025/
- Moving your AI training jobs to LUMI: A Hands-On Workshop -- 27.-28.5.25 in Amsterdam, Netherlands
- Workshop on efficient usage of LUMI-G for AI workloads and on scaling from one to multiple GPUs
- Join in person to get the best experience and also get help from experts from HPE, AMD and the LUMI user support team
- Registration: https://www.lumi-supercomputer.eu/events/lumi-ai-workshop-may2025/
- Maintenance breaks
- LUMI datacenter electric breaker maintenance and full blackout 8-16 June 2025.
#### Presentation "LUMI AI Guide"
Presentation by Gregor Decristoforo about the [LUMI AI guide](https://github.com/Lumi-supercomputer/LUMI-AI-Guide)
#### Questions & Answers
1. I use the PyTorch module, and create a virtual environment on top of that for additional packages. The number of files in my virtual environment is around ~1500 files. Is this a large number causing a slow execution of my code or strain on the Lustre file system? If it does affect the speed, is it only limited to the module importing phase? Once training begins, should we expect normal performance?
- It depends. also how is the training dataset organized? is that a single file or many?
- the last point in this page describes how you can turn the virtual environment into a squasfs file and mount that to the container: https://github.com/Lumi-supercomputer/Getting_Started_with_AI_workshop/blob/main/07_Extending_containers_with_virtual_environments_for_faster_testing/examples/extending_containers_with_venv.md
2. When I create an interactive session for VSCode through the web browser, I load the pytorch/2.4 module. However, when I try to select the Python interpreter in the VSCode session, I encounter "invalid Python interpreter" error. Ticker number is LUMI #5981.
- one can use module load Local-CSC instead of module use
/appl/local/csc/modulefiles. The documentation still isn't updated accordingly
unfortunately. I quickly tested the VScode web app with adding Local-CSC
pytorch/2.4 to the modules field and it detects the right python version with
torch installed.
3. I'm in the optimization stage of my project and found that my `rocblas _<T>gemm` routines are delivering a poor performance on a single Die of `MI250X` compared to how the same code performs on a `A100` NVidia GPU. To my knowledge, LUMI's GPUs should surpass NVidia's by at least a factor of `2x`. Specially in `FP64` operations.
A close examination using the rocblas-bench with square matrix multiplication, has revealed an inconsistent behavior on the GEMM routines. For example, `rocblas_dgemm` routine:
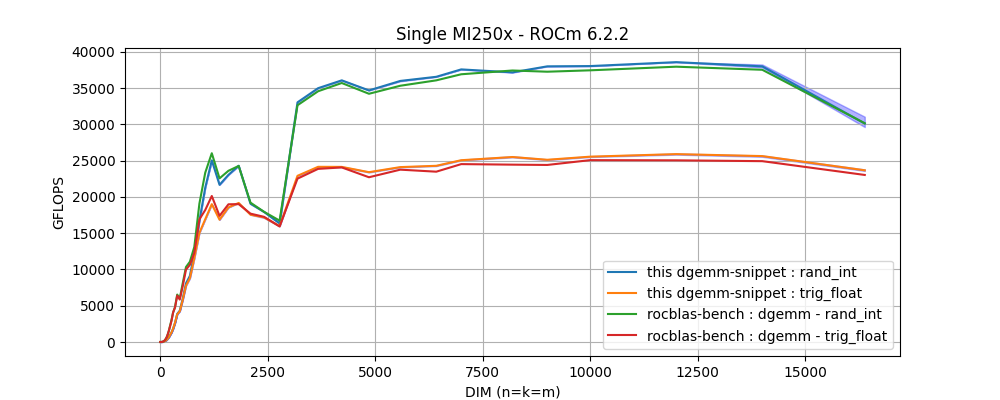
In this figure, two performance behaviors are found: the highest performance is obtained with arrays filled with integer values randomly picked from a limited range, and a lower performance when data is initialized with values generated from trigonometric functions. In otherwords, a performance degradation is observed on `dgemm` with the only difference being the arrays initialization.
Q1: _Is this the expected behavior?_ and if not, _how can we get the maximum performance with arbitrary input data?_
* I have reported to `LUMI support` and the `ROCm/Tensile` project on `github` (see [issue #2118](https://github.com/ROCm/Tensile/issues/2118#event-16959770942)).
* In [rocblas issue #1486](https://github.com/ROCm/rocBLAS/issues/1486#issuecomment-2374611121), it has been pointed to me that the most likely explanation is due to a Dynamic Power Management. But, my lastest discussion with Bert Jorissen indicated me that, for these 5 mins test, no reduction of the device frequency is experienced.
Q2: _Is there a way to verify whether DPM is actually reducing our performance when arbitrary data is used in the benchmark?_
- These questions are outside of what LUST can do. We're L1-L2 and not L3. Discuss directly with AMD who is usually present in the coffee break,
in a break-out room. And the hackathons serve to help with optimizing code.
- But your idea about the speed of an MI250X die is wrong. There is more than peak performance. There is also the cost to
start up a kernel, and the memory bandwidth isn't higher than on A100. So in practice we're happy if a single die can
keep up with an A100.
- And if you really want to understand what's happening, you should not speculate about dynamic power management (which shouldn't have
a huge influence as we're talking about relatively small variations in clock speed), but should use proper profiles to see where the
code gets stuck. The performance degradation may come from a totally different source than you expect...
4. WARPX GPU aware MPI, on host OOM.
* ticket: [LUMI #5463]
* compiler tested with both cray and amd
* MPICH_GPU_IPC_ENABLED=1/0
* MPICH_GPU_IPC_THRESHOLD: 1024, 8192
* libfabric 2.0.0
* ROCm/6.2.2
5. I have difficulties in installing conda environment (flash-attention 2) for training LLMs. I wonder if there is a hand-on video about the installation process. The LUMI environment is different to the system in CSC.
- How did you try to install the conda environment? using conda directly or one of our tools?
- I am trying to use the Container provided by LUMI, but instructions are difficult to follow for me. I would like to install my conda environment inside the container. Things may become simple after trying the github AI guides.
- If you have a container that you want to extend maybe try using cotainr or lumi-container-wrapper to extend it
- The containers come with a conda environment inside which you have to activate
- Check the example in the AI guide: https://github.com/Lumi-supercomputer/LUMI-AI-Guide/tree/main/2-setting-up-environment
- I get stuck with the EasyBuild version of PyTorch (https://lumi-supercomputer.github.io/LUMI-EasyBuild-docs/p/PyTorch/). I do not know how to install PyTorch using EasyBuild. But it seems not necessary for using pytorch. I use the other option `Directly, with you taking care of all bindings and all necessary environment variables` and it looks very convenient. Now I get access to the container and there seems to be flash-attn2.
- The PyTorch EasyBuild recipes don't install PyTorch but a wrapper around the container. We have plenty of course materials that tell you how to use it, so please check out [the software stack talk from our latest course](https://lumi-supercomputer.github.io/LUMI-training-materials/2p3day-20250303/M105-SoftwareStacks/) (and we even have some recorded demos in the materials of that course).
6. I am (Mehti, Aalto University) getting an error related to the missing OS library called **libgthread**. It's related to the opencv-python library (using headless version didn't help) and required to have on a system level. Users can't add this library because of permission restrictions. I also discussed this with Triton support at my university, they told me that you should install this library. Using different container version didn't help (I followed guideline here: https://github.com/mskhan793/LUMI-AI-Guide10032025/blob/main/setting-up-environment/README.md#installing-additional-python-packages-in-a-container). Some useful links that refer to this library:
* https://github.com/opencv/opencv-python/issues/208#issuecomment-547923876
* https://peps.python.org/pep-0513/#the-manylinux1-policy
* This is the link to use for installing in OS (depending on OS type): https://software.opensuse.org/download/package?package=libgthread-2_0-0&project=openSUSE%3ALeap%3A15.2%3AUpdate
- Have you tried an unpriviliged `proot` build? That way you can extend a prebuild container with system libraries. Check out this section of our training course: https://lumi-supercomputer.github.io/LUMI-training-materials/2day-20240502/09_Containers/#extending-the-container-with-cotainr
- Please take our trainings as we explain why we cannot install everything on the system as we are (a) a large and scalable HPC infrastructure, not a workstation and (b) have to serve multiple users with conflicting expectations. Such things should be done in containers, using the "unprivileged proot build" process, and we have tutorials and demos about it in our latest training materials. Have a look at [the software stack talk from our latest course](https://lumi-supercomputer.github.io/LUMI-training-materials/2p3day-20250303/M105-SoftwareStacks/)
7. Is there imagenet-1k dataset on LUMI machine? I know that there is mini-dataset, but I wasn't able to find imagenet-1k full dataset with 1000 labels.
- We use the mini-dataset for the AI guide. The whole dataset with 1000 labels is not publicly available on LUMI but you can download it yourself here: https://www.image-net.org/download.php
### 2025-03-12 13:00 -- 14:00 CET
#### Questions & Answers
1. (sorry I cannot attend this coffee break but I have a question so I write it here) I followed the instruction in the gdb4hpc, but cannot debug correctly, because it always says no rocm devices found. This is what I explored:
- `salloc`, then `gdb4hpc`, no rocm-device found ❌
- `salloc`, then `rocgdb`, no rocm-device found ❌
- `salloc`, then `srun --interactive --pty bash`, then `gdb4hpc`, no rocm-device found ❌
- `salloc`, then `srun --interactive --pty bash`, then `rocgdb`, this one works! ✅
- you can find the log here: https://hackmd.io/@kaiwu/rJUwb0AoJe
### 2025-02-26 13:00 -- 14:00 CET
#### LUMI Updates
- Trainings
- LUMI Intensive: Comprehensive Intro and Advanced Workshop -- 3.-7.3.25 in Stockholm, Sweden
- 2-day intro part followed by 3-day advanced workshop on performance analysis and optimization
- Registration: closed now
- https://www.lumi-supercomputer.eu/events/lumi-intensive-spring-2025/
- If you still want to join, please open a ticket today via: https://lumi-supercomputer.eu/user-support/need-help/general/
- Lumi-G Hackathon -- 12.-16.5.25 in Oslo, Norway
- Get expert help to optimize your code for LUMI (especially AMD GPUs). 5 day intense workshop
- Registration: https://www.lumi-supercomputer.eu/events/lumi-hackathon-spring2025/
- Moving your AI training jobs to LUMI: A Hands-On Workshop -- 27.-28.5.25 in Amsterdam, Netherlands
- Workshop on efficient usage of LUMI-G for AI workloads and on scaling from one to multiple GPUs
- More info to come out soon
- Registration: Not open yet
- Maintenance breaks
- LUMI datacenter electric breaker maintenance and full blackout 8-16 June 2025.
#### Questions & Answers
1. ```FATAL: container creation failed: mount /proc/self/fd/7->/var/lib/singularity/mnt/session/data-images/0 error: while mounting image /proc/self/fd/7: failed to find loop device: could not attach image file to loop device: no loop devices available``` (probably as described here https://github.com/sylabs/singularity/issues/1499 . Happened some times without any obvious reason. Happened both on small and standard CPU-only partitions)
* (Emmanuel) Can you create a ticket here https://lumi-supercomputer.eu/user-support/need-help/ and provide log files as well as nodes reference? Thank you.
2. python3: preload-me.cpp:64: int hipMemGetInfo(size_t *, size_t *): Assertion `count == 8 && "The hipMemGetInfo implementation is assuming the 8 GPUs in a LUMI node are visible to each process"' failed. I am getting this when trying to run a torch distributed job on 4 out 8 GPUs. If I run on all 8 GPUs, then there is no issue.
* (Emanuele) the assertion there checks you are using 8 gpus. so it is correct behavior of the code to fail the assertion if you only provide 4.
* ticket https://rt.lumi-supercomputer.eu/Ticket/Display.html?id=5873
* The ROCm 5.6 containers needed special patches to work with the ROCm 5.2 driver on the system when those containers were developed as there were issues with the memory capacity being reported. These patches only worked in certain cases and that is what you are running into now. Upgrade to newer containers is the solution.
3. Need guidance for collecting MPI stats of MPI+HIP application and information about any new ROCM availablity with containers. currently using 6.0.3.
* We have a whole course where profiling is an important part. Next week in Stockholm or online. We cannot summarize that in a few lines of text or 5 minutes in a discussion. See also all the training materials of previous advanced courses on https://lumi-supercomputer.github.io/LUMI-training-materials/ .
* The ROCm driver only officially supports up to 6.2.x. But even that does not mean that the current Cray MPICH will work. That can only be guaranteed for ROCm 6.0.x.
4. A question related to `rocprof`. I used to use it on LUMI-G before the major stack upgrade (summer 2024). Then, after ROCm was updated, I never managed to get useful traces, more specifically, I was using:
`srun -u -n1 rocprof --hip-trace --roctx-trace ./my_exec`
Then, I found that there is a new version, rocprofv3: https://rocm.docs.amd.com/projects/rocprofiler-sdk/en/latest/how-to/using-rocprofv3.html, but only available from `rocm/6.2.2`, which as per the message after `module load rocm/6.2.2`, it is not installed "properly".
My question is, anyone managed to get a standard way to make `rocprof` work with roctx traces in a non-hacky way?
* https://ui.perfetto.dev/v46.0-35b3d9845/ should be the perfetto version that can visualize trace with older rocprof
* You can try this too: https://hub.docker.com/r/sfantao/perfetto4rocm
5. Hello, I don’t know if it is the right place to ask this question but I tried to connect to my LUMI project but when I try to connect with MyAccessID I get this message, while other people from my lab did not have this issue:
`The digital identity provided by your organization when you log in to this service does not meet the required levels for assuring your identity. In the near future, this will become a mandatory requirement for you to continue to access LUMI HPC resources. We are working on solutions for the level of assurance of your identity, and to speed up this process it would be helpful if you could send the information below to the indicated IT support for your organization. If your organization cannot meet the requirements, you will be provided with an alternative to assure your identity and continued access. If so, this will be communicated to you in good time before the requirement is in effect.`
* (Emmanuel) Thank you for reporting this. We were not aware of this message sent to some MyAccessID users. I don't believe there is any fixed timeline about any change from their side at the moment. Have you been able to access LUMI despite of this warning?
* No because my account status in SUPR is still under the column MyAccessID as "Missing"
* Which way did you use https://puhuri.neic.no/user_guides/myaccessid_registration/ ?
* I created an account with eduID and then log in. And now when I try to link my AccessID identy, I get the message I sent previously just after logging on eduID.
* Can you send us a ticket here https://lumi-supercomputer.eu/user-support/need-help/account/ with your information about your identity and project number?
* Yes not problem I will do that thank you.
* Thanks!
* In case someone has the same issue, clicking on proceed and using safari still linked my SUPR account to MyAccessID
### 2025-01-29 13:00 -- 14:00 CET
#### Presentation "Application fingerprinting" by Thomas Jakobsche (Uni Basel)
LUMI is participating in a research project with the HPC group of Prof. Florina Ciorba at the Department of Mathematics and Computer Science of the University of Basel. This work will contribute to the PhD work of Thomas Jakobsche focusing on Monitoring and Operational Data Analytics (MODA) and how to better characterize user workloads and avoid inefficient resource usage on HPC systems.
Part of his work is to develop tooling that will record some metadata from applications that are being run, like what modules are loaded and which binaries are being executed with the goal to help the LUMI user support team detect misconfigurations and inefficient resource usage. The tooling should be entirely transparent to any user codes and have a negligible impact on application runtime. We have thus far tested these tools internally, and are now in a state where we would want to try it out with a broader scope of real user codes, both to further confirm that it does not cause any issues with user codes and also to gauge how well we can characterize actual user workloads. Currently the tools do not work with anything that is containerized, meaning that if you run mainly containerized applications you cannot participate.
Participating in the testing is really simple, you need to load a module and run whatever you normally run with the module loaded. You can contribute just a few runs or you can keep the module loaded for longer periods. In case you encounter any issues with the module, it causing issues with the programs you run, or significant performance impacts, please reach out to the LUMI service desk with a description of what you ran and how you ran it.
To load the module on LUMI use:
```
module use /appl/local/csc/modulefiles/
module load siren
```
or
```
module load Local-CSC siren
```
Submitting jobs with the module loaded or loading it inside the batch job should both have the same result. In practice what the module does is it adds the fingerprinting library into any applications you run, and once you unload the module the library will no longer be added to any new runs.
We appreciate any runs you can do with the module loaded, from simple single binaries to more complex workflows. If you have further questions please contact the LUMI service desk.
#### LUMI Updates
- EPICURE (members of **EuroHPC JU projects** only!)
- Email sent 27 January "EPICURE High-level Specialized Application Support Service in HPC for EuroHPC JU Users - Information and How to Apply"
- **Existing EuroHPC JU users**: if you already are a member of a EuroHPC JU project, you can request for EPICURE support by simply filling and submitting this form https://pm.epicure-hpc.eu/support/request/
- **Not yet a member of a EuroHPC JU project?** You can apply for EuroHPC JU resources through a dedicated call (benchmark, development, AI, regular, and extreme-scale) and request EPICURE support by ticking a box in the application form about EPICURE support services. Provided that resources have been granted to your project, the EPICURE team will contact you. More information on EuroHPC JU access calls here: https://eurohpc-ju.europa.eu/access-our-supercomputers_en
- Trainings
- Moving your AI training jobs to LUMI: A Hands-On Workshop -- 4.-5.2.25 in Espoo (Finland)
- Workshop on efficient usage of LUMI-G for AI workloads and on scaling from one to multiple GPUs
- Registration closed but next course in May/June
- Recordings will become available on [our training material page](https://lumi-supercomputer.github.io/LUMI-training-materials/)
- 2+3 day LUMI intense performance course/workshop
- 2-day intro part followed by 3-day advanced workshop on performance analysis and optimization
- Registration: open soon
- LUMI hackathon
- Get expert help to optimize your code for LUMI (especially AMD GPUs). 5 day intense workshop
- In May in Oslo
- More info to come out soon
#### Questions & Answers
1. Is there a tool on LUMI to generate a report of the job, showing the CPU/GPU usage, like the [LLView in Jülich Supercomputing Centre](https://www.fz-juelich.de/en/ias/jsc/services/user-support/software-tools/llview) ? Or is the "Application fingerprinting" above something like this?
- There is no graphical tool, but much of the data except the consumed billing units is available from the `sacct` and `sreport` commands in Slurm. The tool you mention seems to show mostly data monitored by Slurm with some additional data.
The billing formula is too complex to do with Slurm and is not done on LUMI itself but on a different CSC server after which the data on whether the project can keep access to the queues is fed back to LUMI.
- If you want very detailed behaviour info of a job, you need to use profilers etc.
- Application fingerprinting is something very different. It is a tool to give information to the cluster managers on which applications are used and not a tool to study in detail how each application or job step behaves.
2. It seems the mail-related features in the sbatch script does not work
```
#SBATCH --mail-user=bigbro@example.com
#SBATCH --mail-type=ALL
```
Is there a plan to implement this in the future?
- It will not be enabled partly because of the architecture of LUMI management services (containerised and no mail subsystem in the Slurm container) and partly because it is a feature that is easily abused and can get us also on lists of spammers due to the hight volume of suspicious emails that such a service can create.
:::info
End of archive
:::