# lab0
contributed by < `jhan1998` >
# Introduction
The goak of this lab:
* Git pre-commit hook
* [git-good-commit](https://github.com/tommarshall/git-good-commit): Learn to write good Git commit messages
* [cppcheck](http://cppcheck.sourceforge.net/): static code analysis tool
* [clang-format](https://clang.llvm.org/docs/ClangFormat.html): Ensure consistent programming style
* [GNU Aspell](http://aspell.net/): spell check
* [valgrind](https://valgrind.org/): Dynamic Program Analysis Tool
* [AddressSanitizer](https://github.com/google/sanitizers/wiki/AddressSanitizer): Check memory usage
* Learn to use Git and GitHub
* Establish a consistent and easy-to-collaborate program development specification
* Research on automatic testing mechanism
* Contact Linux Programming Interface
* Learn coroutineNew
For detailed environment settings and lab instructions, please refer to [I01: lab0](https://hackmd.io/@sysprog/2020-lab0?fbclid=IwAR2YOjtMYzE_kB5vqvBUOSM9OlR5hgvz7NHUGg21NOcN9Hb8vccxEV-yC3o)、[C Programming Lab: Assessing Your C Programming Skills](https://www.cs.cmu.edu/afs/cs/academic/class/15213-s20/www/labs/cprogramminglab.pdf)
## How to use
Use
> make test
We can test all test case.
But if you want to test a single capital test, I would suggest changing the check in the makefile file to the file to be tested, so that it will be more convenient to debug
```
check: qtest
./$< -v 3 -f traces/filename.cmd
```
## queue.[ch] implementation
For details, see [my GitHub repo](https://github.com/jhan1998/lab0-c)
### q_new
:::info
:bell: q_new is quite intuitive, just check whether q is NULL, and then just initialize each part in the linked list. Below is the code.
:::
```c
queue_t *q_new()
{
queue_t *q = malloc(sizeof(queue_t));
if (q) {
q->head = NULL;
q->tail = NULL;
q->size = 0;
}
return q;
}
```
### q_free
:::info
:bell: q_free is to release the memory occupied by the queue, so even the value in each element must be released. Below is the code.
:::
```c
void q_free(queue_t *q)
{
/* Free queue structure */
if (!q)
return;
while (q->head) {
list_ele_t *tmp = q->head;
q->head = q->head->next;
if (tmp->value)
free(tmp->value);
free(tmp);
}
free(q);
}
```
### q_insert_head
:::info
:bell: insert_head is to add (insert) a given new element at the beginning (head) of the queue. The first thing to note here is that the malloc space should be set to strlen(s) + 1! The position of `\0` is to be reserved. The rest is just to check whether the malloced space is NULL or not.
:::
```c
bool q_insert_head(queue_t *q, char *s)
{
if (q) {
list_ele_t *newh;
newh = malloc(sizeof(list_ele_t));
if (newh) {
int len = strlen(s) + 1;
newh->value = malloc(len);
if (!newh->value) {
free(newh);
return false;
}
strncpy(newh->value, s, len);
newh->next = q->head;
q->head = newh;
if (!q->size)
q->tail = newh;
q->size++;
return true;
}
return false;
}
return false;
}
```
### q_insert_tail
:::info
:bell: insert_tail is to add (insert) a given new element at the end (tail) of the queue. In fact, it is similar to insert_head in essence. You can get points if you notice the changes.
:::
:::warning
Here, pay special attention to the operation of whether q_size is 0, otherwise it is easy to make mistakes!
:::
```c
bool q_insert_tail(queue_t *q, char *s)
{
if (q) {
list_ele_t *newt = malloc(sizeof(list_ele_t));
if (newt) {
int len = strlen(s) + 1;
newt->value = malloc(len);
if (!newt->value) {
free(newt);
return false;
}
strncpy(newt->value, s, len);
newt->next = NULL;
if (q->size)
q->tail->next = newt;
else
q->head = newt;
q->tail = newt;
q->size++;
return true;
}
return false;
}
return false;
}
```
### q_remove_head
:::info
:bell: remove_head here is to remove (remove) the given element at the beginning (head) of the queue, in fact, there is no problem, just pay attention to the bufsize given by `strncpy()`.
:::
```c
bool q_remove_head(queue_t *q, char *sp, size_t bufsize)
{
/* TODO: You need to fix up this code. */
/* TODO: Remove the above comment when you are about to implement. */
if (q && q->size != 0) {
if (sp) {
strncpy(sp, q->head->value, bufsize - 1);
sp[bufsize - 1] = '\0';
}
list_ele_t *tmp = q->head;
q->head = q->head->next;
tmp->next = NULL;
free(tmp->value);
free(tmp);
q->size--;
if (!q->size)
q->tail = NULL;
return true;
}
return false;
}
```
### q_size
:::info
:bell: q_size is to calculate the number of elements in the queue, and the time complexity is $O(1)$. In fact, it is very simple. Just set one more size element and return it.
:::
```c
int q_size(queue_t *q)
{
/* Remember: It should operate in O(1) time */
if (q) {
return q->size;
}
return 0;
}
```
### q_reverse
:::info
:bell: q_reverse 是要以反向順序重新排列鏈結串列,這邊我嘗試使用 pointer to pointer 從 head 開始依序指向 NULL 遍歷之後把 head 更新就完成了
:::
```c
void q_reverse(queue_t *q)
{
if (q) {
list_ele_t **head = &q->head;
list_ele_t *cursor = NULL;
q->tail = q->head;
while (*head) {
list_ele_t *tmp = (*head)->next;
(*head)->next = cursor;
cursor = *head;
*head = tmp;
}
(*head) = cursor;
}
}
```
:::info
:bell: I implemented the qsort part with merge sort, and I didn't use very complicated techniques for the divide part, just traverse and then divide it into two parts and recurse. The abort condition for recursion is size == 1.
:::
### q_sort
```c
void q_sort(queue_t *q)
{
/* TODO: You need to write the code for this function */
/* TODO: Remove the above comment when you are about to implement. */
if (!q || !q->head || q->size == 1)
return;
queue_t left, right;
left.size = (q->size >> 1);
right.size = (q->size >> 1) + (q->size & 1);
list_ele_t *cur = left.head = q->head;
right.tail = q->tail;
for (size_t i = 0; i < left.size - 1; i++)
cur = cur->next;
left.tail = cur;
right.head = cur->next;
left.tail->next = NULL;
q_sort(&left);
q_sort(&right);
MergeSort(&left, &right, q);
}
```
:::info
On the Merge side, I tried to use the pointer to pointer technique to connect the two linked lists together. What you can pay attention to here is the last q->tail position. I would update the q->tail position every time I loop. , and finally changed to use pointer calculation to find the position of indirect and one element size ahead to determine q->tail.
:::
```c
void MergeSort(queue_t *left, queue_t *right, queue_t *q)
{
q->size = left->size + right->size;
list_ele_t **indirect = &q->head;
for (int i = 0; i < q->size; i++) {
if (!right->head ||
(left->head && strcmp(right->head->value, left->head->value) > 0)) {
(*indirect) = left->head;
left->head = left->head->next;
} else {
(*indirect) = right->head;
right->head = right->head->next;
}
indirect = &(*indirect)->next;
}
q->tail =
(list_ele_t *) ((char *) indirect - (long) &((list_ele_t *) 0)->next);
}
```
## Address Sanitizer
Execute ==qtest== after make SANITIZER=1
After entering help in cmd, the following error will occur
```c
==15537==ERROR: AddressSanitizer: global-buffer-overflow on address 0x564b12314420 at pc 0x564b120fec6b bp 0x7fff1950d740 sp 0x7fff1950d730
READ of size 4 at 0x564b12314420 thread T0
#0 0x564b120fec6a in do_help_cmd /home/jhan1998/linux2021/lab0-c/console.c:307
#1 0x564b120fed64 in interpret_cmda /home/jhan1998/linux2021/lab0-c/console.c:221
#2 0x564b120ff506 in interpret_cmd /home/jhan1998/linux2021/lab0-c/console.c:244
#3 0x564b12100c28 in run_console /home/jhan1998/linux2021/lab0-c/console.c:660
#4 0x564b120fd9ea in main /home/jhan1998/linux2021/lab0-c/qtest.c:788
#5 0x7f5625c55bf6 in __libc_start_main (/lib/x86_64-linux-gnu/libc.so.6+0x21bf6)
#6 0x564b120fafc9 in _start (/home/jhan1998/linux2021/lab0-c/qtest+0x7fc9)
0x564b12314421 is located 0 bytes to the right of global variable 'echo' defined in 'console.c:59:13' (0x564b12314420) of size 1
SUMMARY: AddressSanitizer: global-buffer-overflow /home/jhan1998/linux2021/lab0-c/console.c:307 in do_help_cmd
Shadow bytes around the buggy address:
0x0ac9e245a830: 04 f9 f9 f9 f9 f9 f9 f9 04 f9 f9 f9 f9 f9 f9 f9
0x0ac9e245a840: 00 f9 f9 f9 f9 f9 f9 f9 00 f9 f9 f9 f9 f9 f9 f9
0x0ac9e245a850: 00 f9 f9 f9 f9 f9 f9 f9 00 00 00 00 04 f9 f9 f9
0x0ac9e245a860: f9 f9 f9 f9 00 00 00 00 00 00 00 00 00 00 f9 f9
0x0ac9e245a870: f9 f9 f9 f9 01 f9 f9 f9 f9 f9 f9 f9 01 f9 f9 f9
=>0x0ac9e245a880: f9 f9 f9 f9[01]f9 f9 f9 f9 f9 f9 f9 04 f9 f9 f9
0x0ac9e245a890: f9 f9 f9 f9 04 f9 f9 f9 f9 f9 f9 f9 00 00 00 00
0x0ac9e245a8a0: 00 00 00 00 00 00 00 00 00 00 00 00 00 00 00 00
0x0ac9e245a8b0: 00 00 00 00 00 00 00 00 00 00 00 00 00 00 00 00
0x0ac9e245a8c0: 00 00 00 00 00 00 00 00 00 00 00 00 00 00 00 00
0x0ac9e245a8d0: 00 00 00 00 00 00 00 00 00 00 00 00 00 00 00 00
Shadow byte legend (one shadow byte represents 8 application bytes):
Addressable: 00
Partially addressable: 01 02 03 04 05 06 07
Heap left redzone: fa
Freed heap region: fd
Stack left redzone: f1
Stack mid redzone: f2
Stack right redzone: f3
Stack after return: f5
Stack use after scope: f8
Global redzone: f9
Global init order: f6
Poisoned by user: f7
Container overflow: fc
Array cookie: ac
Intra object redzone: bb
ASan internal: fe
Left alloca redzone: ca
Right alloca redzone: cb
==15537==ABORTING
```
we can see here that the problem is mainly in the global variable of ==echo==
```c
0x564b12314421 is located 0 bytes to the right of global variable 'echo' defined in 'console.c:59:13' (0x564b12314420) of size 1
```
Next, let's see which parts have traces of using ==echo==.
A total of two parts are transmitted or changed after searching and filtering ==echo==
Respectively
```c
add_param("echo", (int *) &echo, "Do/don't echo commands", NULL);
```
and
```c
void set_echo(bool on)
{
echo = on ? 1 : 0;
}
```
Among them from the error message, we should be able to remove the possibility of the option below.
:::info
I guess that an error may occurred after echo was forced to change lines in `add_param()`.
:::
Thus, let's first observe the description in `add_param()`
```c
void add_param(char *name,
int *valp,
char *documentation,
setter_function setter)
{
param_ptr next_param = param_list;
param_ptr *last_loc = ¶m_list;
while (next_param && strcmp(name, next_param->name) > 0) {
last_loc = &next_param->next;
next_param = next_param->next;
}
param_ptr ele = (param_ptr) malloc_or_fail(sizeof(param_ele), "add_param");
ele->name = name;
ele->valp = valp;
ele->documentation = documentation;
ele->setter = setter;
ele->next = next_param;
*last_loc = ele;
}
```
It can be seen that echo is endowed with ==ele->valp== , so we can first observe ele (type is param_ptr)
In `console.h` you can find
```c
typedef struct PELE param_ele, *param_ptr;
struct PELE {
char *name;
int *valp;
char *documentation;
/* Function that gets called whenever parameter changes */
setter_function setter;
param_ptr next;
};
```
However, the type of `valp` is `int *` but the type of echo is bool, which leads to overflow when seeing memory segments that do not belong to echo in subsequent use.
Then, first return to the original error line 307 to see
```c
static bool do_help_cmd(int argc, char *argv[])
{
cmd_ptr clist = cmd_list;
report(1, "Commands:", argv[0]);
while (clist) {
report(1, "\t%s\t%s", clist->name, clist->documentation);
clist = clist->next;
}
param_ptr plist = param_list;
report(1, "Options:");
while (plist) {
report(1, "\t%s\t%d\t%s", plist->name, *plist->valp,
plist->documentation); //<= 307
plist = plist->next;
}
return true;
}
```
At this time, the section of his dereference has exceeded the scope of the original echo, so he decided to change line 307 to the following
:::success
```c=
(int)*(bool *)plist->valp
```
Let it be converted into pointer to bool first, and then converted into int after dereference.
:::
Next execute the `qtest` test
```c
jhan1998@jhan1998-MacBookPro:~/linux2021/lab0-c$ make SANITIZER=1
CC console.o
LD qtest
jhan1998@jhan1998-MacBookPro:~/linux2021/lab0-c$ ./qtest
cmd> help
Commands:
# ... | Display comment
free | Delete queue
help | Show documentation
ih str [n] | Insert string str at head of queue n times. Generate random string(s) if str equals RAND. (default: n == 1)
it str [n] | Insert string str at tail of queue n times. Generate random string(s) if str equals RAND. (default: n == 1)
log file | Copy output to file
new | Create new queue
option [name val] | Display or set options
quit | Exit program
reverse | Reverse queue
rh [str] | Remove from head of queue. Optionally compare to expected value str
rhq | Remove from head of queue without reporting value.
show | Show queue contents
size [n] | Compute queue size n times (default: n == 1)
sort | Sort queue in ascending order
source file | Read commands from source file
time cmd arg ... | Time command execution
Options:
echo 1 Do/don't echo commands
error 5 Number of errors until exit
fail 30 Number of times allow queue operations to return false
length 0 Maximum length of displayed string
malloc 0 Malloc failure probability percent
simulation 0 Start/Stop simulation mode
verbose 4 Verbosity level
cmd>
Freeing queue
```
succeeded
However, the same situation occurs when re-executing make test
```c
==17124==ERROR: AddressSanitizer: global-buffer-overflow on address 0x55c1c9f51640 at pc 0x55c1c9d3aee4 bp 0x7ffc6fa053f0 sp 0x7ffc6fa053e0
READ of size 4 at 0x55c1c9f51640 thread T0
#0 0x55c1c9d3aee3 in do_option_cmd /home/jhan1998/linux2021/lab0-c/console.c:369
#1 0x55c1c9d39d62 in interpret_cmda /home/jhan1998/linux2021/lab0-c/console.c:221
#2 0x55c1c9d3a504 in interpret_cmd /home/jhan1998/linux2021/lab0-c/console.c:244
#3 0x55c1c9d3b77c in cmd_select /home/jhan1998/linux2021/lab0-c/console.c:594
#4 0x55c1c9d3bc79 in run_console /home/jhan1998/linux2021/lab0-c/console.c:667
#5 0x55c1c9d389ea in main /home/jhan1998/linux2021/lab0-c/qtest.c:788
#6 0x7f5cebb0cbf6 in __libc_start_main (/lib/x86_64-linux-gnu/libc.so.6+0x21bf6)
#7 0x55c1c9d35fc9 in _start (/home/jhan1998/linux2021/lab0-c/qtest+0x7fc9)
0x55c1c9f51641 is located 0 bytes to the right of global variable 'simulation' defined in 'console.c:21:6' (0x55c1c9f51640) of size 1
'simulation' is ascii string ''
SUMMARY: AddressSanitizer: global-buffer-overflow /home/jhan1998/linux2021/lab0-c/console.c:369 in do_option_cmd
Shadow bytes around the buggy address:
0x0ab8b93e2270: 00 00 00 00 00 00 00 00 00 00 00 00 00 00 00 00
0x0ab8b93e2280: 00 00 00 00 00 00 00 00 00 00 00 00 00 00 00 00
0x0ab8b93e2290: 00 00 00 00 00 00 00 00 00 00 00 00 f9 f9 f9 f9
0x0ab8b93e22a0: 00 f9 f9 f9 f9 f9 f9 f9 00 f9 f9 f9 f9 f9 f9 f9
0x0ab8b93e22b0: 00 f9 f9 f9 f9 f9 f9 f9 00 f9 f9 f9 f9 f9 f9 f9
=>0x0ab8b93e22c0: 00 f9 f9 f9 f9 f9 f9 f9[01]f9 f9 f9 f9 f9 f9 f9
0x0ab8b93e22d0: 00 00 00 00 01 f9 f9 f9 f9 f9 f9 f9 04 f9 f9 f9
0x0ab8b93e22e0: f9 f9 f9 f9 00 00 00 00 00 00 00 00 00 00 00 00
0x0ab8b93e22f0: 00 00 00 00 00 00 00 00 00 00 00 00 00 f9 f9 f9
0x0ab8b93e2300: f9 f9 f9 f9 01 f9 f9 f9 f9 f9 f9 f9 01 f9 f9 f9
0x0ab8b93e2310: f9 f9 f9 f9 04 f9 f9 f9 f9 f9 f9 f9 00 f9 f9 f9
Shadow byte legend (one shadow byte represents 8 application bytes):
Addressable: 00
Partially addressable: 01 02 03 04 05 06 07
Heap left redzone: fa
Freed heap region: fd
Stack left redzone: f1
Stack mid redzone: f2
Stack right redzone: f3
Stack after return: f5
Stack use after scope: f8
Global redzone: f9
Global init order: f6
Poisoned by user: f7
Container overflow: fc
Array cookie: ac
Intra object redzone: bb
ASan internal: fe
Left alloca redzone: ca
Right alloca redzone: cb
==17124==ABORTING
```
This time we can see that there is a problem with the variable simulation, so let’s look for it first to see where it is useful
```c=
add_param("simulation", (int *) &simulation, "Start/Stop simulation mode",
NULL);
```
The same is seen in `add_param()`, it should be the problem of transformation, and the 369th line of the problem should be seen first
```c
param_ptr plist = param_list;
while (!found && plist) {
if (strcmp(plist->name, name) == 0) {
int oldval = *plist->valp; //<=369
*plist->valp = value;
if (plist->setter)
plist->setter(oldval);
found = true;
} else
plist = plist->next;
}
```
We can that this is the samw problem of transformation, so I will change it according to the above
```c
int oldval = (int)*(bool*)plist->valp;
```
But at this time, new errors will appear when `make test` is restarted
```c
=================================================================
==17633==ERROR: AddressSanitizer: global-buffer-overflow on address 0x557044740640 at pc 0x557044529ef4 bp 0x7fffaad33e30 sp 0x7fffaad33e20
WRITE of size 4 at 0x557044740640 thread T0
#0 0x557044529ef3 in do_option_cmd /home/jhan1998/linux2021/lab0-c/console.c:370
#1 0x557044528d62 in interpret_cmda /home/jhan1998/linux2021/lab0-c/console.c:221
#2 0x557044529504 in interpret_cmd /home/jhan1998/linux2021/lab0-c/console.c:244
#3 0x55704452a7a5 in cmd_select /home/jhan1998/linux2021/lab0-c/console.c:594
#4 0x55704452aca2 in run_console /home/jhan1998/linux2021/lab0-c/console.c:667
#5 0x5570445279ea in main /home/jhan1998/linux2021/lab0-c/qtest.c:788
#6 0x7fd967799bf6 in __libc_start_main (/lib/x86_64-linux-gnu/libc.so.6+0x21bf6)
#7 0x557044524fc9 in _start (/home/jhan1998/linux2021/lab0-c/qtest+0x7fc9)
0x557044740641 is located 0 bytes to the right of global variable 'simulation' defined in 'console.c:21:6' (0x557044740640) of size 1
'simulation' is ascii string ''
SUMMARY: AddressSanitizer: global-buffer-overflow /home/jhan1998/linux2021/lab0-c/console.c:370 in do_option_cmd
Shadow bytes around the buggy address:
0x0aae888e0070: 00 00 00 00 00 00 00 00 00 00 00 00 00 00 00 00
0x0aae888e0080: 00 00 00 00 00 00 00 00 00 00 00 00 00 00 00 00
0x0aae888e0090: 00 00 00 00 00 00 00 00 00 00 00 00 f9 f9 f9 f9
0x0aae888e00a0: 00 f9 f9 f9 f9 f9 f9 f9 00 f9 f9 f9 f9 f9 f9 f9
0x0aae888e00b0: 00 f9 f9 f9 f9 f9 f9 f9 00 f9 f9 f9 f9 f9 f9 f9
=>0x0aae888e00c0: 00 f9 f9 f9 f9 f9 f9 f9[01]f9 f9 f9 f9 f9 f9 f9
0x0aae888e00d0: 00 00 00 00 01 f9 f9 f9 f9 f9 f9 f9 04 f9 f9 f9
0x0aae888e00e0: f9 f9 f9 f9 00 00 00 00 00 00 00 00 00 00 00 00
0x0aae888e00f0: 00 00 00 00 00 00 00 00 00 00 00 00 00 f9 f9 f9
0x0aae888e0100: f9 f9 f9 f9 01 f9 f9 f9 f9 f9 f9 f9 01 f9 f9 f9
0x0aae888e0110: f9 f9 f9 f9 04 f9 f9 f9 f9 f9 f9 f9 00 f9 f9 f9
Shadow byte legend (one shadow byte represents 8 application bytes):
Addressable: 00
Partially addressable: 01 02 03 04 05 06 07
Heap left redzone: fa
Freed heap region: fd
Stack left redzone: f1
Stack mid redzone: f2
Stack right redzone: f3
Stack after return: f5
Stack use after scope: f8
Global redzone: f9
Global init order: f6
Poisoned by user: f7
Container overflow: fc
Array cookie: ac
Intra object redzone: bb
ASan internal: fe
Left alloca redzone: ca
Right alloca redzone: cb
==17633==ABORTING
--- trace-17-complexity 0/5
--- TOTAL 95/100
```
Looked at line 370 of the error
```c=
*plist->valp = value;
```
I found that this solution does not seem to be applicable to the simulation, so I decided to directly change the type of simulation
in `console.c`
```c
bool simulation; => int simulation;
```
in `console.h`
```c
extern bool simulation; => extern int simulation
```
Finally re-run `make test`
```c
jhan1998@jhan1998-MacBookPro:~/linux2021/lab0-c$ make test
scripts/driver.py -c
--- Trace Points
+++ TESTING trace trace-01-ops:
# Test of insert_head and remove_head
--- trace-01-ops 6/6
+++ TESTING trace trace-02-ops:
# Test of insert_head, insert_tail, and remove_head
--- trace-02-ops 6/6
+++ TESTING trace trace-03-ops:
# Test of insert_head, insert_tail, reverse, and remove_head
--- trace-03-ops 6/6
+++ TESTING trace trace-04-ops:
# Test of insert_head, insert_tail, size, and sort
--- trace-04-ops 6/6
+++ TESTING trace trace-05-ops:
# Test of insert_head, insert_tail, remove_head, reverse, size, and sort
--- trace-05-ops 5/5
+++ TESTING trace trace-06-string:
# Test of truncated strings
--- trace-06-string 6/6
+++ TESTING trace trace-07-robust:
# Test operations on NULL queue
--- trace-07-robust 6/6
+++ TESTING trace trace-08-robust:
# Test operations on empty queue
--- trace-08-robust 6/6
+++ TESTING trace trace-09-robust:
# Test remove_head with NULL argument
--- trace-09-robust 6/6
+++ TESTING trace trace-10-malloc:
# Test of malloc failure on new
--- trace-10-malloc 6/6
+++ TESTING trace trace-11-malloc:
# Test of malloc failure on insert_head
--- trace-11-malloc 6/6
+++ TESTING trace trace-12-malloc:
# Test of malloc failure on insert_tail
--- trace-12-malloc 6/6
+++ TESTING trace trace-13-perf:
# Test performance of insert_tail
--- trace-13-perf 6/6
+++ TESTING trace trace-14-perf:
# Test performance of size
--- trace-14-perf 6/6
+++ TESTING trace trace-15-perf:
# Test performance of insert_tail, size, reverse, and sort
--- trace-15-perf 6/6
+++ TESTING trace trace-16-perf:
# Test performance of sort with random and descending orders
# 10000: all correct sorting algorithms are expected pass
# 50000: sorting algorithms with O(n^2) time complexity are expected failed
# 100000: sorting algorithms with O(nlogn) time complexity are expected pass
--- trace-16-perf 6/6
+++ TESTING trace trace-17-complexity:
# Test if q_insert_tail and q_size is constant time complexity
Probably constant time
Probably constant time
--- trace-17-complexity 5/5
--- TOTAL 100/100
```
It worked. I then tried the cmd help again, and it was also successful. The problem of Address Sanitizer was solved :+1:! ! !
:::warning
In fact, echo should be solved by changing the type, but I think it is a bad idea to change the type it originally predicted, so it can be solved by pointer transformation, which I think is enough.
:::
## Valgrind
Let's use Valgrind to eliminate memory errors implemented by qtest
Let’s start with the error message first. When we execute `make valgrind`, the following error will be generated:
```c
jhan1998@jhan1998-MacBookPro:~/linux2021/lab0-c$ make valgrind
# Explicitly disable sanitizer(s)
make clean SANITIZER=0 qtest
make[1]: Entering directory '/home/jhan1998/linux2021/lab0-c'
rm -f qtest.o report.o console.o harness.o queue.o random.o dudect/constant.o dudect/fixture.o dudect/ttest.o linenoise.o .qtest.o.d .report.o.d .console.o.d .harness.o.d .queue.o.d .random.o.d .dudect/constant.o.d .dudect/fixture.o.d .dudect/ttest.o.d .linenoise.o.d *~ qtest /tmp/qtest.*
rm -rf .dudect
rm -rf *.dSYM
(cd traces; rm -f *~)
CC qtest.o
CC report.o
CC console.o
CC harness.o
CC queue.o
CC random.o
CC dudect/constant.o
CC dudect/fixture.o
CC dudect/ttest.o
CC linenoise.o
LD qtest
make[1]: Leaving directory '/home/jhan1998/linux2021/lab0-c'
cp qtest /tmp/qtest.PBYzxa
chmod u+x /tmp/qtest.PBYzxa
sed -i "s/alarm/isnan/g" /tmp/qtest.PBYzxa
scripts/driver.py -p /tmp/qtest.PBYzxa --valgrind
--- Trace Points
+++ TESTING trace trace-01-ops:
# Test of insert_head and remove_head
==6970== 5 bytes in 1 blocks are still reachable in loss record 1 of 3
==6970== at 0x4C31B0F: malloc (in /usr/lib/valgrind/vgpreload_memcheck-amd64-linux.so)
==6970== by 0x5279AF9: strdup (strdup.c:42)
==6970== by 0x10F20B: linenoiseHistoryAdd (linenoise.c:1236)
==6970== by 0x10FDC1: linenoiseHistoryLoad (linenoise.c:1325)
==6970== by 0x10B4EB: main (qtest.c:776)
==6970==
==6970== 116 bytes in 19 blocks are still reachable in loss record 2 of 3
==6970== at 0x4C31B0F: malloc (in /usr/lib/valgrind/vgpreload_memcheck-amd64-linux.so)
==6970== by 0x5279AF9: strdup (strdup.c:42)
==6970== by 0x10F184: linenoiseHistoryAdd (linenoise.c:1236)
==6970== by 0x10FDC1: linenoiseHistoryLoad (linenoise.c:1325)
==6970== by 0x10B4EB: main (qtest.c:776)
==6970==
==6970== 160 bytes in 1 blocks are still reachable in loss record 3 of 3
==6970== at 0x4C31B0F: malloc (in /usr/lib/valgrind/vgpreload_memcheck-amd64-linux.so)
==6970== by 0x10F1D0: linenoiseHistoryAdd (linenoise.c:1224)
==6970== by 0x10FDC1: linenoiseHistoryLoad (linenoise.c:1325)
==6970== by 0x10B4EB: main (qtest.c:776)
==6970==
--- trace-01-ops 6/6
+++ TESTING trace trace-02-ops:
# Test of insert_head, insert_tail, and remove_head
==6971== 5 bytes in 1 blocks are still reachable in loss record 1 of 3
==6971== at 0x4C31B0F: malloc (in /usr/lib/valgrind/vgpreload_memcheck-amd64-linux.so)
==6971== by 0x5279AF9: strdup (strdup.c:42)
==6971== by 0x10F20B: linenoiseHistoryAdd (linenoise.c:1236)
==6971== by 0x10FDC1: linenoiseHistoryLoad (linenoise.c:1325)
==6971== by 0x10B4EB: main (qtest.c:776)
==6971==
==6971== 116 bytes in 19 blocks are still reachable in loss record 2 of 3
==6971== at 0x4C31B0F: malloc (in /usr/lib/valgrind/vgpreload_memcheck-amd64-linux.so)
==6971== by 0x5279AF9: strdup (strdup.c:42)
==6971== by 0x10F184: linenoiseHistoryAdd (linenoise.c:1236)
==6971== by 0x10FDC1: linenoiseHistoryLoad (linenoise.c:1325)
==6971== by 0x10B4EB: main (qtest.c:776)
==6971==
==6971== 160 bytes in 1 blocks are still reachable in loss record 3 of 3
==6971== at 0x4C31B0F: malloc (in /usr/lib/valgrind/vgpreload_memcheck-amd64-linux.so)
==6971== by 0x10F1D0: linenoiseHistoryAdd (linenoise.c:1224)
==6971== by 0x10FDC1: linenoiseHistoryLoad (linenoise.c:1325)
==6971== by 0x10B4EB: main (qtest.c:776)
==6971==
--- trace-02-ops 6/6
+++ TESTING trace trace-03-ops:
# Test of insert_head, insert_tail, reverse, and remove_head
==6972== 5 bytes in 1 blocks are still reachable in loss record 1 of 3
==6972== at 0x4C31B0F: malloc (in /usr/lib/valgrind/vgpreload_memcheck-amd64-linux.so)
==6972== by 0x5279AF9: strdup (strdup.c:42)
==6972== by 0x10F20B: linenoiseHistoryAdd (linenoise.c:1236)
==6972== by 0x10FDC1: linenoiseHistoryLoad (linenoise.c:1325)
==6972== by 0x10B4EB: main (qtest.c:776)
==6972==
==6972== 116 bytes in 19 blocks are still reachable in loss record 2 of 3
==6972== at 0x4C31B0F: malloc (in /usr/lib/valgrind/vgpreload_memcheck-amd64-linux.so)
==6972== by 0x5279AF9: strdup (strdup.c:42)
==6972== by 0x10F184: linenoiseHistoryAdd (linenoise.c:1236)
==6972== by 0x10FDC1: linenoiseHistoryLoad (linenoise.c:1325)
==6972== by 0x10B4EB: main (qtest.c:776)
==6972==
==6972== 160 bytes in 1 blocks are still reachable in loss record 3 of 3
==6972== at 0x4C31B0F: malloc (in /usr/lib/valgrind/vgpreload_memcheck-amd64-linux.so)
==6972== by 0x10F1D0: linenoiseHistoryAdd (linenoise.c:1224)
==6972== by 0x10FDC1: linenoiseHistoryLoad (linenoise.c:1325)
==6972== by 0x10B4EB: main (qtest.c:776)
==6972==
--- trace-03-ops 6/6
+++ TESTING trace trace-04-ops:
# Test of insert_head, insert_tail, size, and sort
==6975== 5 bytes in 1 blocks are still reachable in loss record 1 of 3
==6975== at 0x4C31B0F: malloc (in /usr/lib/valgrind/vgpreload_memcheck-amd64-linux.so)
==6975== by 0x5279AF9: strdup (strdup.c:42)
==6975== by 0x10F20B: linenoiseHistoryAdd (linenoise.c:1236)
==6975== by 0x10FDC1: linenoiseHistoryLoad (linenoise.c:1325)
==6975== by 0x10B4EB: main (qtest.c:776)
==6975==
==6975== 116 bytes in 19 blocks are still reachable in loss record 2 of 3
==6975== at 0x4C31B0F: malloc (in /usr/lib/valgrind/vgpreload_memcheck-amd64-linux.so)
==6975== by 0x5279AF9: strdup (strdup.c:42)
==6975== by 0x10F184: linenoiseHistoryAdd (linenoise.c:1236)
==6975== by 0x10FDC1: linenoiseHistoryLoad (linenoise.c:1325)
==6975== by 0x10B4EB: main (qtest.c:776)
==6975==
==6975== 160 bytes in 1 blocks are still reachable in loss record 3 of 3
==6975== at 0x4C31B0F: malloc (in /usr/lib/valgrind/vgpreload_memcheck-amd64-linux.so)
==6975== by 0x10F1D0: linenoiseHistoryAdd (linenoise.c:1224)
==6975== by 0x10FDC1: linenoiseHistoryLoad (linenoise.c:1325)
==6975== by 0x10B4EB: main (qtest.c:776)
==6975==
--- trace-04-ops 6/6
+++ TESTING trace trace-05-ops:
# Test of insert_head, insert_tail, remove_head, reverse, size, and sort
==6976== 5 bytes in 1 blocks are still reachable in loss record 1 of 3
==6976== at 0x4C31B0F: malloc (in /usr/lib/valgrind/vgpreload_memcheck-amd64-linux.so)
==6976== by 0x5279AF9: strdup (strdup.c:42)
==6976== by 0x10F20B: linenoiseHistoryAdd (linenoise.c:1236)
==6976== by 0x10FDC1: linenoiseHistoryLoad (linenoise.c:1325)
==6976== by 0x10B4EB: main (qtest.c:776)
==6976==
==6976== 116 bytes in 19 blocks are still reachable in loss record 2 of 3
==6976== at 0x4C31B0F: malloc (in /usr/lib/valgrind/vgpreload_memcheck-amd64-linux.so)
==6976== by 0x5279AF9: strdup (strdup.c:42)
==6976== by 0x10F184: linenoiseHistoryAdd (linenoise.c:1236)
==6976== by 0x10FDC1: linenoiseHistoryLoad (linenoise.c:1325)
==6976== by 0x10B4EB: main (qtest.c:776)
==6976==
==6976== 160 bytes in 1 blocks are still reachable in loss record 3 of 3
==6976== at 0x4C31B0F: malloc (in /usr/lib/valgrind/vgpreload_memcheck-amd64-linux.so)
==6976== by 0x10F1D0: linenoiseHistoryAdd (linenoise.c:1224)
==6976== by 0x10FDC1: linenoiseHistoryLoad (linenoise.c:1325)
==6976== by 0x10B4EB: main (qtest.c:776)
==6976==
--- trace-05-ops 5/5
+++ TESTING trace trace-06-string:
# Test of truncated strings
==6977== 5 bytes in 1 blocks are still reachable in loss record 1 of 3
==6977== at 0x4C31B0F: malloc (in /usr/lib/valgrind/vgpreload_memcheck-amd64-linux.so)
==6977== by 0x5279AF9: strdup (strdup.c:42)
==6977== by 0x10F20B: linenoiseHistoryAdd (linenoise.c:1236)
==6977== by 0x10FDC1: linenoiseHistoryLoad (linenoise.c:1325)
==6977== by 0x10B4EB: main (qtest.c:776)
==6977==
==6977== 116 bytes in 19 blocks are still reachable in loss record 2 of 3
==6977== at 0x4C31B0F: malloc (in /usr/lib/valgrind/vgpreload_memcheck-amd64-linux.so)
==6977== by 0x5279AF9: strdup (strdup.c:42)
==6977== by 0x10F184: linenoiseHistoryAdd (linenoise.c:1236)
==6977== by 0x10FDC1: linenoiseHistoryLoad (linenoise.c:1325)
==6977== by 0x10B4EB: main (qtest.c:776)
==6977==
==6977== 160 bytes in 1 blocks are still reachable in loss record 3 of 3
==6977== at 0x4C31B0F: malloc (in /usr/lib/valgrind/vgpreload_memcheck-amd64-linux.so)
==6977== by 0x10F1D0: linenoiseHistoryAdd (linenoise.c:1224)
==6977== by 0x10FDC1: linenoiseHistoryLoad (linenoise.c:1325)
==6977== by 0x10B4EB: main (qtest.c:776)
==6977==
--- trace-06-string 6/6
+++ TESTING trace trace-07-robust:
# Test operations on NULL queue
==6978== 5 bytes in 1 blocks are still reachable in loss record 1 of 3
==6978== at 0x4C31B0F: malloc (in /usr/lib/valgrind/vgpreload_memcheck-amd64-linux.so)
==6978== by 0x5279AF9: strdup (strdup.c:42)
==6978== by 0x10F20B: linenoiseHistoryAdd (linenoise.c:1236)
==6978== by 0x10FDC1: linenoiseHistoryLoad (linenoise.c:1325)
==6978== by 0x10B4EB: main (qtest.c:776)
==6978==
==6978== 116 bytes in 19 blocks are still reachable in loss record 2 of 3
==6978== at 0x4C31B0F: malloc (in /usr/lib/valgrind/vgpreload_memcheck-amd64-linux.so)
==6978== by 0x5279AF9: strdup (strdup.c:42)
==6978== by 0x10F184: linenoiseHistoryAdd (linenoise.c:1236)
==6978== by 0x10FDC1: linenoiseHistoryLoad (linenoise.c:1325)
==6978== by 0x10B4EB: main (qtest.c:776)
==6978==
==6978== 160 bytes in 1 blocks are still reachable in loss record 3 of 3
==6978== at 0x4C31B0F: malloc (in /usr/lib/valgrind/vgpreload_memcheck-amd64-linux.so)
==6978== by 0x10F1D0: linenoiseHistoryAdd (linenoise.c:1224)
==6978== by 0x10FDC1: linenoiseHistoryLoad (linenoise.c:1325)
==6978== by 0x10B4EB: main (qtest.c:776)
==6978==
--- trace-07-robust 6/6
+++ TESTING trace trace-08-robust:
# Test operations on empty queue
==6979== 5 bytes in 1 blocks are still reachable in loss record 1 of 3
==6979== at 0x4C31B0F: malloc (in /usr/lib/valgrind/vgpreload_memcheck-amd64-linux.so)
==6979== by 0x5279AF9: strdup (strdup.c:42)
==6979== by 0x10F20B: linenoiseHistoryAdd (linenoise.c:1236)
==6979== by 0x10FDC1: linenoiseHistoryLoad (linenoise.c:1325)
==6979== by 0x10B4EB: main (qtest.c:776)
==6979==
==6979== 116 bytes in 19 blocks are still reachable in loss record 2 of 3
==6979== at 0x4C31B0F: malloc (in /usr/lib/valgrind/vgpreload_memcheck-amd64-linux.so)
==6979== by 0x5279AF9: strdup (strdup.c:42)
==6979== by 0x10F184: linenoiseHistoryAdd (linenoise.c:1236)
==6979== by 0x10FDC1: linenoiseHistoryLoad (linenoise.c:1325)
==6979== by 0x10B4EB: main (qtest.c:776)
==6979==
==6979== 160 bytes in 1 blocks are still reachable in loss record 3 of 3
==6979== at 0x4C31B0F: malloc (in /usr/lib/valgrind/vgpreload_memcheck-amd64-linux.so)
==6979== by 0x10F1D0: linenoiseHistoryAdd (linenoise.c:1224)
==6979== by 0x10FDC1: linenoiseHistoryLoad (linenoise.c:1325)
==6979== by 0x10B4EB: main (qtest.c:776)
==6979==
--- trace-08-robust 6/6
+++ TESTING trace trace-09-robust:
# Test remove_head with NULL argument
==6986== 5 bytes in 1 blocks are still reachable in loss record 1 of 3
==6986== at 0x4C31B0F: malloc (in /usr/lib/valgrind/vgpreload_memcheck-amd64-linux.so)
==6986== by 0x5279AF9: strdup (strdup.c:42)
==6986== by 0x10F20B: linenoiseHistoryAdd (linenoise.c:1236)
==6986== by 0x10FDC1: linenoiseHistoryLoad (linenoise.c:1325)
==6986== by 0x10B4EB: main (qtest.c:776)
==6986==
==6986== 116 bytes in 19 blocks are still reachable in loss record 2 of 3
==6986== at 0x4C31B0F: malloc (in /usr/lib/valgrind/vgpreload_memcheck-amd64-linux.so)
==6986== by 0x5279AF9: strdup (strdup.c:42)
==6986== by 0x10F184: linenoiseHistoryAdd (linenoise.c:1236)
==6986== by 0x10FDC1: linenoiseHistoryLoad (linenoise.c:1325)
==6986== by 0x10B4EB: main (qtest.c:776)
==6986==
==6986== 160 bytes in 1 blocks are still reachable in loss record 3 of 3
==6986== at 0x4C31B0F: malloc (in /usr/lib/valgrind/vgpreload_memcheck-amd64-linux.so)
==6986== by 0x10F1D0: linenoiseHistoryAdd (linenoise.c:1224)
==6986== by 0x10FDC1: linenoiseHistoryLoad (linenoise.c:1325)
==6986== by 0x10B4EB: main (qtest.c:776)
==6986==
--- trace-09-robust 6/6
+++ TESTING trace trace-10-malloc:
# Test of malloc failure on new
==6987== 5 bytes in 1 blocks are still reachable in loss record 1 of 3
==6987== at 0x4C31B0F: malloc (in /usr/lib/valgrind/vgpreload_memcheck-amd64-linux.so)
==6987== by 0x5279AF9: strdup (strdup.c:42)
==6987== by 0x10F20B: linenoiseHistoryAdd (linenoise.c:1236)
==6987== by 0x10FDC1: linenoiseHistoryLoad (linenoise.c:1325)
==6987== by 0x10B4EB: main (qtest.c:776)
==6987==
==6987== 116 bytes in 19 blocks are still reachable in loss record 2 of 3
==6987== at 0x4C31B0F: malloc (in /usr/lib/valgrind/vgpreload_memcheck-amd64-linux.so)
==6987== by 0x5279AF9: strdup (strdup.c:42)
==6987== by 0x10F184: linenoiseHistoryAdd (linenoise.c:1236)
==6987== by 0x10FDC1: linenoiseHistoryLoad (linenoise.c:1325)
==6987== by 0x10B4EB: main (qtest.c:776)
==6987==
==6987== 160 bytes in 1 blocks are still reachable in loss record 3 of 3
==6987== at 0x4C31B0F: malloc (in /usr/lib/valgrind/vgpreload_memcheck-amd64-linux.so)
==6987== by 0x10F1D0: linenoiseHistoryAdd (linenoise.c:1224)
==6987== by 0x10FDC1: linenoiseHistoryLoad (linenoise.c:1325)
==6987== by 0x10B4EB: main (qtest.c:776)
==6987==
--- trace-10-malloc 6/6
+++ TESTING trace trace-11-malloc:
# Test of malloc failure on insert_head
==6988== 5 bytes in 1 blocks are still reachable in loss record 1 of 3
==6988== at 0x4C31B0F: malloc (in /usr/lib/valgrind/vgpreload_memcheck-amd64-linux.so)
==6988== by 0x5279AF9: strdup (strdup.c:42)
==6988== by 0x10F20B: linenoiseHistoryAdd (linenoise.c:1236)
==6988== by 0x10FDC1: linenoiseHistoryLoad (linenoise.c:1325)
==6988== by 0x10B4EB: main (qtest.c:776)
==6988==
==6988== 116 bytes in 19 blocks are still reachable in loss record 2 of 3
==6988== at 0x4C31B0F: malloc (in /usr/lib/valgrind/vgpreload_memcheck-amd64-linux.so)
==6988== by 0x5279AF9: strdup (strdup.c:42)
==6988== by 0x10F184: linenoiseHistoryAdd (linenoise.c:1236)
==6988== by 0x10FDC1: linenoiseHistoryLoad (linenoise.c:1325)
==6988== by 0x10B4EB: main (qtest.c:776)
==6988==
==6988== 160 bytes in 1 blocks are still reachable in loss record 3 of 3
==6988== at 0x4C31B0F: malloc (in /usr/lib/valgrind/vgpreload_memcheck-amd64-linux.so)
==6988== by 0x10F1D0: linenoiseHistoryAdd (linenoise.c:1224)
==6988== by 0x10FDC1: linenoiseHistoryLoad (linenoise.c:1325)
==6988== by 0x10B4EB: main (qtest.c:776)
==6988==
--- trace-11-malloc 6/6
+++ TESTING trace trace-12-malloc:
# Test of malloc failure on insert_tail
==6989== 5 bytes in 1 blocks are still reachable in loss record 1 of 3
==6989== at 0x4C31B0F: malloc (in /usr/lib/valgrind/vgpreload_memcheck-amd64-linux.so)
==6989== by 0x5279AF9: strdup (strdup.c:42)
==6989== by 0x10F20B: linenoiseHistoryAdd (linenoise.c:1236)
==6989== by 0x10FDC1: linenoiseHistoryLoad (linenoise.c:1325)
==6989== by 0x10B4EB: main (qtest.c:776)
==6989==
==6989== 116 bytes in 19 blocks are still reachable in loss record 2 of 3
==6989== at 0x4C31B0F: malloc (in /usr/lib/valgrind/vgpreload_memcheck-amd64-linux.so)
==6989== by 0x5279AF9: strdup (strdup.c:42)
==6989== by 0x10F184: linenoiseHistoryAdd (linenoise.c:1236)
==6989== by 0x10FDC1: linenoiseHistoryLoad (linenoise.c:1325)
==6989== by 0x10B4EB: main (qtest.c:776)
==6989==
==6989== 160 bytes in 1 blocks are still reachable in loss record 3 of 3
==6989== at 0x4C31B0F: malloc (in /usr/lib/valgrind/vgpreload_memcheck-amd64-linux.so)
==6989== by 0x10F1D0: linenoiseHistoryAdd (linenoise.c:1224)
==6989== by 0x10FDC1: linenoiseHistoryLoad (linenoise.c:1325)
==6989== by 0x10B4EB: main (qtest.c:776)
==6989==
--- trace-12-malloc 6/6
+++ TESTING trace trace-13-perf:
# Test performance of insert_tail
==6990== 5 bytes in 1 blocks are still reachable in loss record 1 of 3
==6990== at 0x4C31B0F: malloc (in /usr/lib/valgrind/vgpreload_memcheck-amd64-linux.so)
==6990== by 0x5279AF9: strdup (strdup.c:42)
==6990== by 0x10F20B: linenoiseHistoryAdd (linenoise.c:1236)
==6990== by 0x10FDC1: linenoiseHistoryLoad (linenoise.c:1325)
==6990== by 0x10B4EB: main (qtest.c:776)
==6990==
==6990== 116 bytes in 19 blocks are still reachable in loss record 2 of 3
==6990== at 0x4C31B0F: malloc (in /usr/lib/valgrind/vgpreload_memcheck-amd64-linux.so)
==6990== by 0x5279AF9: strdup (strdup.c:42)
==6990== by 0x10F184: linenoiseHistoryAdd (linenoise.c:1236)
==6990== by 0x10FDC1: linenoiseHistoryLoad (linenoise.c:1325)
==6990== by 0x10B4EB: main (qtest.c:776)
==6990==
==6990== 160 bytes in 1 blocks are still reachable in loss record 3 of 3
==6990== at 0x4C31B0F: malloc (in /usr/lib/valgrind/vgpreload_memcheck-amd64-linux.so)
==6990== by 0x10F1D0: linenoiseHistoryAdd (linenoise.c:1224)
==6990== by 0x10FDC1: linenoiseHistoryLoad (linenoise.c:1325)
==6990== by 0x10B4EB: main (qtest.c:776)
==6990==
--- trace-13-perf 6/6
+++ TESTING trace trace-14-perf:
# Test performance of size
==6996== 5 bytes in 1 blocks are still reachable in loss record 1 of 3
==6996== at 0x4C31B0F: malloc (in /usr/lib/valgrind/vgpreload_memcheck-amd64-linux.so)
==6996== by 0x5279AF9: strdup (strdup.c:42)
==6996== by 0x10F20B: linenoiseHistoryAdd (linenoise.c:1236)
==6996== by 0x10FDC1: linenoiseHistoryLoad (linenoise.c:1325)
==6996== by 0x10B4EB: main (qtest.c:776)
==6996==
==6996== 116 bytes in 19 blocks are still reachable in loss record 2 of 3
==6996== at 0x4C31B0F: malloc (in /usr/lib/valgrind/vgpreload_memcheck-amd64-linux.so)
==6996== by 0x5279AF9: strdup (strdup.c:42)
==6996== by 0x10F184: linenoiseHistoryAdd (linenoise.c:1236)
==6996== by 0x10FDC1: linenoiseHistoryLoad (linenoise.c:1325)
==6996== by 0x10B4EB: main (qtest.c:776)
==6996==
==6996== 160 bytes in 1 blocks are still reachable in loss record 3 of 3
==6996== at 0x4C31B0F: malloc (in /usr/lib/valgrind/vgpreload_memcheck-amd64-linux.so)
==6996== by 0x10F1D0: linenoiseHistoryAdd (linenoise.c:1224)
==6996== by 0x10FDC1: linenoiseHistoryLoad (linenoise.c:1325)
==6996== by 0x10B4EB: main (qtest.c:776)
==6996==
--- trace-14-perf 6/6
+++ TESTING trace trace-15-perf:
# Test performance of insert_tail, size, reverse, and sort
==6998== 5 bytes in 1 blocks are still reachable in loss record 1 of 3
==6998== at 0x4C31B0F: malloc (in /usr/lib/valgrind/vgpreload_memcheck-amd64-linux.so)
==6998== by 0x5279AF9: strdup (strdup.c:42)
==6998== by 0x10F20B: linenoiseHistoryAdd (linenoise.c:1236)
==6998== by 0x10FDC1: linenoiseHistoryLoad (linenoise.c:1325)
==6998== by 0x10B4EB: main (qtest.c:776)
==6998==
==6998== 116 bytes in 19 blocks are still reachable in loss record 2 of 3
==6998== at 0x4C31B0F: malloc (in /usr/lib/valgrind/vgpreload_memcheck-amd64-linux.so)
==6998== by 0x5279AF9: strdup (strdup.c:42)
==6998== by 0x10F184: linenoiseHistoryAdd (linenoise.c:1236)
==6998== by 0x10FDC1: linenoiseHistoryLoad (linenoise.c:1325)
==6998== by 0x10B4EB: main (qtest.c:776)
==6998==
==6998== 160 bytes in 1 blocks are still reachable in loss record 3 of 3
==6998== at 0x4C31B0F: malloc (in /usr/lib/valgrind/vgpreload_memcheck-amd64-linux.so)
==6998== by 0x10F1D0: linenoiseHistoryAdd (linenoise.c:1224)
==6998== by 0x10FDC1: linenoiseHistoryLoad (linenoise.c:1325)
==6998== by 0x10B4EB: main (qtest.c:776)
==6998==
--- trace-15-perf 6/6
+++ TESTING trace trace-16-perf:
# Test performance of sort with random and descending orders
# 10000: all correct sorting algorithms are expected pass
# 50000: sorting algorithms with O(n^2) time complexity are expected failed
# 100000: sorting algorithms with O(nlogn) time complexity are expected pass
==7012== 5 bytes in 1 blocks are still reachable in loss record 1 of 3
==7012== at 0x4C31B0F: malloc (in /usr/lib/valgrind/vgpreload_memcheck-amd64-linux.so)
==7012== by 0x5279AF9: strdup (strdup.c:42)
==7012== by 0x10F20B: linenoiseHistoryAdd (linenoise.c:1236)
==7012== by 0x10FDC1: linenoiseHistoryLoad (linenoise.c:1325)
==7012== by 0x10B4EB: main (qtest.c:776)
==7012==
==7012== 116 bytes in 19 blocks are still reachable in loss record 2 of 3
==7012== at 0x4C31B0F: malloc (in /usr/lib/valgrind/vgpreload_memcheck-amd64-linux.so)
==7012== by 0x5279AF9: strdup (strdup.c:42)
==7012== by 0x10F184: linenoiseHistoryAdd (linenoise.c:1236)
==7012== by 0x10FDC1: linenoiseHistoryLoad (linenoise.c:1325)
==7012== by 0x10B4EB: main (qtest.c:776)
==7012==
==7012== 160 bytes in 1 blocks are still reachable in loss record 3 of 3
==7012== at 0x4C31B0F: malloc (in /usr/lib/valgrind/vgpreload_memcheck-amd64-linux.so)
==7012== by 0x10F1D0: linenoiseHistoryAdd (linenoise.c:1224)
==7012== by 0x10FDC1: linenoiseHistoryLoad (linenoise.c:1325)
==7012== by 0x10B4EB: main (qtest.c:776)
==7012==
--- trace-16-perf 6/6
+++ TESTING trace trace-17-complexity:
# Test if q_insert_tail and q_size is constant time complexity
Probably constant time
Probably constant time
==7014== 5 bytes in 1 blocks are still reachable in loss record 1 of 3
==7014== at 0x4C31B0F: malloc (in /usr/lib/valgrind/vgpreload_memcheck-amd64-linux.so)
==7014== by 0x5279AF9: strdup (strdup.c:42)
==7014== by 0x10F20B: linenoiseHistoryAdd (linenoise.c:1236)
==7014== by 0x10FDC1: linenoiseHistoryLoad (linenoise.c:1325)
==7014== by 0x10B4EB: main (qtest.c:776)
==7014==
==7014== 116 bytes in 19 blocks are still reachable in loss record 2 of 3
==7014== at 0x4C31B0F: malloc (in /usr/lib/valgrind/vgpreload_memcheck-amd64-linux.so)
==7014== by 0x5279AF9: strdup (strdup.c:42)
==7014== by 0x10F184: linenoiseHistoryAdd (linenoise.c:1236)
==7014== by 0x10FDC1: linenoiseHistoryLoad (linenoise.c:1325)
==7014== by 0x10B4EB: main (qtest.c:776)
==7014==
==7014== 160 bytes in 1 blocks are still reachable in loss record 3 of 3
==7014== at 0x4C31B0F: malloc (in /usr/lib/valgrind/vgpreload_memcheck-amd64-linux.so)
==7014== by 0x10F1D0: linenoiseHistoryAdd (linenoise.c:1224)
==7014== by 0x10FDC1: linenoiseHistoryLoad (linenoise.c:1325)
==7014== by 0x10B4EB: main (qtest.c:776)
==7014==
--- trace-17-complexity 5/5
--- TOTAL 100/100
Test with specific case by running command:
scripts/driver.py -p /tmp/qtest.PBYzxa --valgrind -t <tid>
```
We can see this part first:
```c
==7014== 5 bytes in 1 blocks are still reachable in loss record 1 of 3
==7014== at 0x4C31B0F: malloc (in /usr/lib/valgrind/vgpreload_memcheck-amd64-linux.so)
==7014== by 0x5279AF9: strdup (strdup.c:42)
==7014== by 0x10F20B: linenoiseHistoryAdd (linenoise.c:1236)
==7014== by 0x10FDC1: linenoiseHistoryLoad (linenoise.c:1325)
==7014== by 0x10B4EB: main (qtest.c:776)
==7014==
```
We can see that there will be `still reachable` problems, so I think it is caused by some memory not being freed before the end of the program.
So let's first observe where the problem is.
Respectively:
* main.c:776
```c
/* Trigger call back function(auto completion) */
linenoiseSetCompletionCallback(completion);
linenoiseHistorySetMaxLen(HISTORY_LEN);
linenoiseHistoryLoad(HISTORY_FILE); /* Load the history at startup */ //776
```
* linenoise.c:1325
```c
while (fgets(buf, LINENOISE_MAX_LINE, fp) != NULL) {
char *p;
p = strchr(buf, '\r');
if (!p)
p = strchr(buf, '\n');
if (p)
*p = '\0';
linenoiseHistoryAdd(buf); //1325
}
```
* linenoise.c:1236
```c
if (history_len && !strcmp(history[history_len - 1], line))
return 0;
/* Add an heap allocated copy of the line in the history.
* If we reached the max length, remove the older line. */
linecopy = strdup(line); //1236
if (!linecopy)
return 0;
```
It can be found that the problem lies in the load hystory file. When I continued to observe `main.c`, I found that in `run_console()`, manual input and file reading are different.
`run_console()`
```c
bool run_console(char *infile_name)
{
if (!push_file(infile_name)) {
report(1, "ERROR: Could not open source file '%s'", infile_name);
return false;
}
if (!has_infile) {
char *cmdline;
while ((cmdline = linenoise(prompt)) != NULL) {
interpret_cmd(cmdline);
linenoiseHistoryAdd(cmdline); /* Add to the history. */
linenoiseHistorySave(HISTORY_FILE); /* Save the history on disk. */
linenoiseFree(cmdline);
}
} else {
while (!cmd_done())
cmd_select(0, NULL, NULL, NULL, NULL);
}
return err_cnt == 0;
}
```
We can see that if the file is read, there will be no `linenoiseFree()` action, so it may happen that the history file is not free after being loaded, so the direct solution is not to let the program do it when reading the file. Initialization of the history file.
So change `main.c:776` to:
```c
if (!infile_name) {
linenoiseSetCompletionCallback(completion);
linenoiseHistorySetMaxLen(HISTORY_LEN);
linenoiseHistoryLoad(HISTORY_FILE); /* Load the history at startup */
}
```
`make valgrind` again
```c
jhan1998@jhan1998-MacBookPro:~/linux2021/lab0-c$ make valgrind
# Explicitly disable sanitizer(s)
make clean SANITIZER=0 qtest
make[1]: Entering directory '/home/jhan1998/linux2021/lab0-c'
rm -f qtest.o report.o console.o harness.o queue.o random.o dudect/constant.o dudect/fixture.o dudect/ttest.o linenoise.o .qtest.o.d .report.o.d .console.o.d .harness.o.d .queue.o.d .random.o.d .dudect/constant.o.d .dudect/fixture.o.d .dudect/ttest.o.d .linenoise.o.d *~ qtest /tmp/qtest.*
rm -rf .dudect
rm -rf *.dSYM
(cd traces; rm -f *~)
CC qtest.o
CC report.o
CC console.o
CC harness.o
CC queue.o
CC random.o
CC dudect/constant.o
CC dudect/fixture.o
CC dudect/ttest.o
CC linenoise.o
LD qtest
make[1]: Leaving directory '/home/jhan1998/linux2021/lab0-c'
cp qtest /tmp/qtest.os8YUw
chmod u+x /tmp/qtest.os8YUw
sed -i "s/alarm/isnan/g" /tmp/qtest.os8YUw
scripts/driver.py -p /tmp/qtest.os8YUw --valgrind
--- Trace Points
+++ TESTING trace trace-01-ops:
# Test of insert_head and remove_head
--- trace-01-ops 6/6
+++ TESTING trace trace-02-ops:
# Test of insert_head, insert_tail, and remove_head
--- trace-02-ops 6/6
+++ TESTING trace trace-03-ops:
# Test of insert_head, insert_tail, reverse, and remove_head
--- trace-03-ops 6/6
+++ TESTING trace trace-04-ops:
# Test of insert_head, insert_tail, size, and sort
--- trace-04-ops 6/6
+++ TESTING trace trace-05-ops:
# Test of insert_head, insert_tail, remove_head, reverse, size, and sort
--- trace-05-ops 5/5
+++ TESTING trace trace-06-string:
# Test of truncated strings
--- trace-06-string 6/6
+++ TESTING trace trace-07-robust:
# Test operations on NULL queue
--- trace-07-robust 6/6
+++ TESTING trace trace-08-robust:
# Test operations on empty queue
--- trace-08-robust 6/6
+++ TESTING trace trace-09-robust:
# Test remove_head with NULL argument
--- trace-09-robust 6/6
+++ TESTING trace trace-10-malloc:
# Test of malloc failure on new
--- trace-10-malloc 6/6
+++ TESTING trace trace-11-malloc:
# Test of malloc failure on insert_head
--- trace-11-malloc 6/6
+++ TESTING trace trace-12-malloc:
# Test of malloc failure on insert_tail
--- trace-12-malloc 6/6
+++ TESTING trace trace-13-perf:
# Test performance of insert_tail
--- trace-13-perf 6/6
+++ TESTING trace trace-14-perf:
# Test performance of size
--- trace-14-perf 6/6
+++ TESTING trace trace-15-perf:
# Test performance of insert_tail, size, reverse, and sort
--- trace-15-perf 6/6
+++ TESTING trace trace-16-perf:
# Test performance of sort with random and descending orders
# 10000: all correct sorting algorithms are expected pass
# 50000: sorting algorithms with O(n^2) time complexity are expected failed
# 100000: sorting algorithms with O(nlogn) time complexity are expected pass
--- trace-16-perf 6/6
+++ TESTING trace trace-17-complexity:
# Test if q_insert_tail and q_size is constant time complexity
Probably constant time
Probably constant time
--- trace-17-complexity 5/5
--- TOTAL 100/100
Test with specific case by running command:
scripts/driver.py -p /tmp/qtest.os8YUw --valgrind -t <tid>
```
It can be executed smoothly.
But then I found out that if I enter an unknown command `e.g., q, i, eqwerwqre` or `Unknown command` when executing `./qtest`, a series of errors will occur at the end, as follows:
```c
jhan1998@jhan1998-MacBookPro:~/linux2021/lab0-c$ valgrind --leak-check=yes ./qtest
cmd> q
Unknown command 'q'
cmd>
==13181== 32 bytes in 1 blocks are still reachable in loss record 1 of 24
==13181== at 0x4C31B0F: malloc (in /usr/lib/valgrind/vgpreload_memcheck-amd64-linux.so)
==13181== by 0x10BB84: malloc_or_fail (report.c:189)
==13181== by 0x10C5A9: add_cmd (console.c:125)
==13181== by 0x10C68A: init_cmd (console.c:95)
==13181== by 0x10B368: main (qtest.c:770)
==13181==
==13181== 32 bytes in 1 blocks are still reachable in loss record 2 of 24
==13181== at 0x4C31B0F: malloc (in /usr/lib/valgrind/vgpreload_memcheck-amd64-linux.so)
==13181== by 0x10BB84: malloc_or_fail (report.c:189)
==13181== by 0x10C5A9: add_cmd (console.c:125)
==13181== by 0x10C6A4: init_cmd (console.c:96)
==13181== by 0x10B368: main (qtest.c:770)
==13181==
==13181== 32 bytes in 1 blocks are still reachable in loss record 3 of 24
==13181== at 0x4C31B0F: malloc (in /usr/lib/valgrind/vgpreload_memcheck-amd64-linux.so)
==13181== by 0x10BB84: malloc_or_fail (report.c:189)
==13181== by 0x10C5A9: add_cmd (console.c:125)
==13181== by 0x10C6BE: init_cmd (console.c:98)
==13181== by 0x10B368: main (qtest.c:770)
==13181==
==13181== 32 bytes in 1 blocks are still reachable in loss record 4 of 24
==13181== at 0x4C31B0F: malloc (in /usr/lib/valgrind/vgpreload_memcheck-amd64-linux.so)
==13181== by 0x10BB84: malloc_or_fail (report.c:189)
==13181== by 0x10C5A9: add_cmd (console.c:125)
==13181== by 0x10C6D8: init_cmd (console.c:99)
==13181== by 0x10B368: main (qtest.c:770)
==13181==
==13181== 32 bytes in 1 blocks are still reachable in loss record 5 of 24
==13181== at 0x4C31B0F: malloc (in /usr/lib/valgrind/vgpreload_memcheck-amd64-linux.so)
==13181== by 0x10BB84: malloc_or_fail (report.c:189)
==13181== by 0x10C5A9: add_cmd (console.c:125)
==13181== by 0x10C6F2: init_cmd (console.c:101)
==13181== by 0x10B368: main (qtest.c:770)
==13181==
==13181== 32 bytes in 1 blocks are still reachable in loss record 6 of 24
==13181== at 0x4C31B0F: malloc (in /usr/lib/valgrind/vgpreload_memcheck-amd64-linux.so)
==13181== by 0x10BB84: malloc_or_fail (report.c:189)
==13181== by 0x10C5A9: add_cmd (console.c:125)
==13181== by 0x10C70C: init_cmd (console.c:102)
==13181== by 0x10B368: main (qtest.c:770)
==13181==
==13181== 32 bytes in 1 blocks are still reachable in loss record 7 of 24
==13181== at 0x4C31B0F: malloc (in /usr/lib/valgrind/vgpreload_memcheck-amd64-linux.so)
==13181== by 0x10BB84: malloc_or_fail (report.c:189)
==13181== by 0x10C5A9: add_cmd (console.c:125)
==13181== by 0x10C726: init_cmd (console.c:103)
==13181== by 0x10B368: main (qtest.c:770)
==13181==
==13181== 32 bytes in 1 blocks are still reachable in loss record 8 of 24
==13181== at 0x4C31B0F: malloc (in /usr/lib/valgrind/vgpreload_memcheck-amd64-linux.so)
==13181== by 0x10BB84: malloc_or_fail (report.c:189)
==13181== by 0x10C5A9: add_cmd (console.c:125)
==13181== by 0x10B382: console_init (qtest.c:85)
==13181== by 0x10B382: main (qtest.c:771)
==13181==
==13181== 32 bytes in 1 blocks are still reachable in loss record 9 of 24
==13181== at 0x4C31B0F: malloc (in /usr/lib/valgrind/vgpreload_memcheck-amd64-linux.so)
==13181== by 0x10BB84: malloc_or_fail (report.c:189)
==13181== by 0x10C5A9: add_cmd (console.c:125)
==13181== by 0x10B39C: console_init (qtest.c:86)
==13181== by 0x10B39C: main (qtest.c:771)
==13181==
==13181== 32 bytes in 1 blocks are still reachable in loss record 10 of 24
==13181== at 0x4C31B0F: malloc (in /usr/lib/valgrind/vgpreload_memcheck-amd64-linux.so)
==13181== by 0x10BB84: malloc_or_fail (report.c:189)
==13181== by 0x10C5A9: add_cmd (console.c:125)
==13181== by 0x10B3B6: console_init (qtest.c:87)
==13181== by 0x10B3B6: main (qtest.c:771)
==13181==
==13181== 32 bytes in 1 blocks are still reachable in loss record 11 of 24
==13181== at 0x4C31B0F: malloc (in /usr/lib/valgrind/vgpreload_memcheck-amd64-linux.so)
==13181== by 0x10BB84: malloc_or_fail (report.c:189)
==13181== by 0x10C5A9: add_cmd (console.c:125)
==13181== by 0x10B3D0: console_init (qtest.c:90)
==13181== by 0x10B3D0: main (qtest.c:771)
==13181==
==13181== 32 bytes in 1 blocks are still reachable in loss record 12 of 24
==13181== at 0x4C31B0F: malloc (in /usr/lib/valgrind/vgpreload_memcheck-amd64-linux.so)
==13181== by 0x10BB84: malloc_or_fail (report.c:189)
==13181== by 0x10C5A9: add_cmd (console.c:125)
==13181== by 0x10B3EA: console_init (qtest.c:93)
==13181== by 0x10B3EA: main (qtest.c:771)
==13181==
==13181== 32 bytes in 1 blocks are still reachable in loss record 13 of 24
==13181== at 0x4C31B0F: malloc (in /usr/lib/valgrind/vgpreload_memcheck-amd64-linux.so)
==13181== by 0x10BB84: malloc_or_fail (report.c:189)
==13181== by 0x10C5A9: add_cmd (console.c:125)
==13181== by 0x10B404: console_init (qtest.c:96)
==13181== by 0x10B404: main (qtest.c:771)
==13181==
==13181== 32 bytes in 1 blocks are still reachable in loss record 14 of 24
==13181== at 0x4C31B0F: malloc (in /usr/lib/valgrind/vgpreload_memcheck-amd64-linux.so)
==13181== by 0x10BB84: malloc_or_fail (report.c:189)
==13181== by 0x10C5A9: add_cmd (console.c:125)
==13181== by 0x10B41E: console_init (qtest.c:99)
==13181== by 0x10B41E: main (qtest.c:771)
==13181==
==13181== 32 bytes in 1 blocks are still reachable in loss record 15 of 24
==13181== at 0x4C31B0F: malloc (in /usr/lib/valgrind/vgpreload_memcheck-amd64-linux.so)
==13181== by 0x10BB84: malloc_or_fail (report.c:189)
==13181== by 0x10C5A9: add_cmd (console.c:125)
==13181== by 0x10B438: console_init (qtest.c:100)
==13181== by 0x10B438: main (qtest.c:771)
==13181==
==13181== 32 bytes in 1 blocks are still reachable in loss record 16 of 24
==13181== at 0x4C31B0F: malloc (in /usr/lib/valgrind/vgpreload_memcheck-amd64-linux.so)
==13181== by 0x10BB84: malloc_or_fail (report.c:189)
==13181== by 0x10C5A9: add_cmd (console.c:125)
==13181== by 0x10B452: console_init (qtest.c:101)
==13181== by 0x10B452: main (qtest.c:771)
==13181==
==13181== 32 bytes in 1 blocks are still reachable in loss record 17 of 24
==13181== at 0x4C31B0F: malloc (in /usr/lib/valgrind/vgpreload_memcheck-amd64-linux.so)
==13181== by 0x10BB84: malloc_or_fail (report.c:189)
==13181== by 0x10C5A9: add_cmd (console.c:125)
==13181== by 0x10B46C: console_init (qtest.c:103)
==13181== by 0x10B46C: main (qtest.c:771)
==13181==
==13181== 40 bytes in 1 blocks are still reachable in loss record 18 of 24
==13181== at 0x4C31B0F: malloc (in /usr/lib/valgrind/vgpreload_memcheck-amd64-linux.so)
==13181== by 0x10BB84: malloc_or_fail (report.c:189)
==13181== by 0x10C61F: add_param (console.c:146)
==13181== by 0x10C745: init_cmd (console.c:104)
==13181== by 0x10B368: main (qtest.c:770)
==13181==
==13181== 40 bytes in 1 blocks are still reachable in loss record 19 of 24
==13181== at 0x4C31B0F: malloc (in /usr/lib/valgrind/vgpreload_memcheck-amd64-linux.so)
==13181== by 0x10BB84: malloc_or_fail (report.c:189)
==13181== by 0x10C61F: add_param (console.c:146)
==13181== by 0x10C764: init_cmd (console.c:106)
==13181== by 0x10B368: main (qtest.c:770)
==13181==
==13181== 40 bytes in 1 blocks are still reachable in loss record 20 of 24
==13181== at 0x4C31B0F: malloc (in /usr/lib/valgrind/vgpreload_memcheck-amd64-linux.so)
==13181== by 0x10BB84: malloc_or_fail (report.c:189)
==13181== by 0x10C61F: add_param (console.c:146)
==13181== by 0x10C783: init_cmd (console.c:107)
==13181== by 0x10B368: main (qtest.c:770)
==13181==
==13181== 40 bytes in 1 blocks are still reachable in loss record 21 of 24
==13181== at 0x4C31B0F: malloc (in /usr/lib/valgrind/vgpreload_memcheck-amd64-linux.so)
==13181== by 0x10BB84: malloc_or_fail (report.c:189)
==13181== by 0x10C61F: add_param (console.c:146)
==13181== by 0x10C7A2: init_cmd (console.c:108)
==13181== by 0x10B368: main (qtest.c:770)
==13181==
==13181== 40 bytes in 1 blocks are still reachable in loss record 22 of 24
==13181== at 0x4C31B0F: malloc (in /usr/lib/valgrind/vgpreload_memcheck-amd64-linux.so)
==13181== by 0x10BB84: malloc_or_fail (report.c:189)
==13181== by 0x10C61F: add_param (console.c:146)
==13181== by 0x10B48B: console_init (qtest.c:104)
==13181== by 0x10B48B: main (qtest.c:771)
==13181==
==13181== 40 bytes in 1 blocks are still reachable in loss record 23 of 24
==13181== at 0x4C31B0F: malloc (in /usr/lib/valgrind/vgpreload_memcheck-amd64-linux.so)
==13181== by 0x10BB84: malloc_or_fail (report.c:189)
==13181== by 0x10C61F: add_param (console.c:146)
==13181== by 0x10B4AA: console_init (qtest.c:106)
==13181== by 0x10B4AA: main (qtest.c:771)
==13181==
==13181== 40 bytes in 1 blocks are still reachable in loss record 24 of 24
==13181== at 0x4C31B0F: malloc (in /usr/lib/valgrind/vgpreload_memcheck-amd64-linux.so)
==13181== by 0x10BB84: malloc_or_fail (report.c:189)
==13181== by 0x10C61F: add_param (console.c:146)
==13181== by 0x10B4C9: console_init (qtest.c:108)
==13181== by 0x10B4C9: main (qtest.c:771)
==13181==
```
After observing the location and type of the error, it should be that the command and parameter were not cleared as expected, so we can focus on the observation at the back of `main()`.
In order to find out the reason, I observed whether there was an error when there was no error:
```c
jhan1998@jhan1998-MacBookPro:~/linux2021/lab0-c$ valgrind --leak-check=yes ./qtest
cmd> help
Commands:
# ... | Display comment
free | Delete queue
help | Show documentation
ih str [n] | Insert string str at head of queue n times. Generate random string(s) if str equals RAND. (default: n == 1)
it str [n] | Insert string str at tail of queue n times. Generate random string(s) if str equals RAND. (default: n == 1)
log file | Copy output to file
new | Create new queue
option [name val] | Display or set options
quit | Exit program
reverse | Reverse queue
rh [str] | Remove from head of queue. Optionally compare to expected value str
rhq | Remove from head of queue without reporting value.
show | Show queue contents
size [n] | Compute queue size n times (default: n == 1)
sort | Sort queue in ascending order
source file | Read commands from source file
time cmd arg ... | Time command execution
Options:
echo 1 Do/don't echo commands
error 5 Number of errors until exit
fail 30 Number of times allow queue operations to return false
length 0 Maximum length of displayed string
malloc 0 Malloc failure probability percent
simulation 0 Start/Stop simulation mode
verbose 4 Verbosity level
cmd>
Freeing queue
```
As a result, no error occurred. Comparing the difference between the two cases, I found that `record_error()` will be triggered when `Unknown command` is entered. At this time, the global variable `err_cnt` will be incremented by one, and the return value of `run_console()` It is `err_cnt == 0`, so when the program finish
```c
bool ok = true;
ok = ok && run_console(infile_name);
ok = ok && finish_cmd();
return ok ? 0 : 1;
```
`run_console` will return `false`, so when `ok` is `false`, `&&` will not execute `finish_cmd()` and cause the above error.
Therefore, in order to solve the problem I reversed the positions of `ok` and `finsig_cmd()`
```c
ok = finish_cmd() && ok;
```
Run it again and it will work normally
```c
jhan1998@jhan1998-MacBookPro:~/linux2021/lab0-c$ make
CC qtest.o
LD qtest
jhan1998@jhan1998-MacBookPro:~/linux2021/lab0-c$ valgrind --leak-check=yes ./qtest
cmd> q
Unknown command 'q'
cmd> q
Unknown command 'q'
cmd>
Freeing queue
```
## Massif
First practice using the `Massif` tool, for which I wrote a new `.cmd` file.
```c
option simulation 1
it
option simulation 0
```
Then let's simulate it immediately, first execute the following command
```
valgrind --tool=massif ./qtest -f traces/trace-18-exp.cmd
```
After the simulation is completed, we will get the `massif.out.xxxx` file. At this time, we need to download `massif-visualizer` to help us run the chart, so download it first
```
sudo apt-get install massif-visualizer
```
and then execute
```
massif-visualizer massif.out.14727
```
Then, we can get the picture.
This is the picture.

:::info
The deafult of total snap-shot is 50
:::
Analyzing this picture, we can find that each snap-shot will have its own peak value, and we can see it with the code
```c
void measure(int64_t *before_ticks,
int64_t *after_ticks,
uint8_t *input_data,
int mode)
{
assert(mode == test_insert_tail || mode == test_size);
if (mode == test_insert_tail) {
for (size_t i = drop_size; i < number_measurements - drop_size; i++) {
char *s = get_random_string();
dut_new();
dut_insert_head(
get_random_string(),
*(uint16_t *) (input_data + i * chunk_size) % 10000);
before_ticks[i] = cpucycles();
dut_insert_tail(s, 1);
after_ticks[i] = cpucycles();
dut_free();
}
} else {
for (size_t i = drop_size; i < number_measurements - drop_size; i++) {
dut_new();
dut_insert_head(
get_random_string(),
*(uint16_t *) (input_data + i * chunk_size) % 10000);
before_ticks[i] = cpucycles();
dut_size(1);
after_ticks[i] = cpucycles();
dut_free();
}
}
}
```
We will know that during `simulation`, a large amount of memory will be allocated and then freed after measuring the time. In this case, the peak value should be more than expected, so I speculate that it should be in a `snap-shot`, which may contain multiple times peak, so I decided to increase `max-sanpshots` to 1000, and set `depth` to 200 in order to observe the difference between peaks.
do it again
```c
valgrind --tool=massif --max-snapshots=1000 --depth=200 ./qtest -f traces/trace-18-exp.cmd
```
After executing, the picture looks like this

It can be seen that the number of peaks has increased significantly, but the height of each peak is significantly different. This may be because the memory configured each time is different, which can be found from the code
```c
dut_insert_head(
get_random_string(),
*(uint16_t *) (input_data + i * chunk_size) % 10000);
```
The number of strings generated each time will be from 0 to 10000, so in order to verify my idea, I decided to change it to 100 uniformly.
```c
for (size_t i = drop_size; i < number_measurements - drop_size; i++) {
char *s = get_random_string();
dut_new();
dut_insert_head(
get_random_string(),
100);
before_ticks[i] = cpucycles();
dut_insert_tail(s, 1);
after_ticks[i] = cpucycles();
dut_free();
}
```
Execute it as shown below

In order to better identify, I only left the part of `Total Memory Heap Consumption`. You can see that the peak value is almost the same, but there are still some differences. I think it is the difference generated by `get_random_string()` to generate random strings. Therefore I changed `get_random_string()` to `hello` and observed again.

We can see that the peaks are slightly more consistent.
## Select system call
Referring to [select man page](https://man7.org/linux/man-pages/man2/select.2.html) and [select() - Beej's Guide to Network Programming](https://beej-zhtw-gitbook.netdpi.net/man_shi_yong_shou_ce/select)
```c
int select(int nfds, fd_set *readfds, fd_set *writefds,
fd_set *exceptfds, struct timeval *timeout);
```
`select()` allows users to check multiple `file descriptors` synchronously to check whether there is data to receive, or an exception occurs.
The only place where `select()` is used in `console.c` is `cmd_select()`. From `run_console()`, we can know that `cmd_select()` will be called when using file input to determine whether the file is can be read in.
```c
if (!block_flag) {
/* Process any commands in input buffer */
if (!readfds)
readfds = &local_readset;
/* Add input fd to readset for select */
infd = buf_stack->fd;
FD_SET(infd, readfds);
if (infd == STDIN_FILENO && prompt_flag) {
printf("%s", prompt);
fflush(stdout);
prompt_flag = true;
}
}
```
The rest of `cmd_select()` works as described above.
```
if (!readfds)
readfds = &local_readset;
```
Points to `local_readset` if `readfds` is `NULL`.
```c
infd = buf_stack->fd;
FD_SET(infd, readfds);
```
Then add the file descriptor of the file in buf_stack to readfds.
After that is the part of `select()`
```c
int result = select(nfds, readfds, writefds, exceptfds, timeout);
if (result <= 0)
return result;
infd = buf_stack->fd;
if (readfds && FD_ISSET(infd, readfds)) {
/* Commandline input available */
FD_CLR(infd, readfds);
result--;
if (has_infile) {
char *cmdline;
cmdline = readline();
if (cmdline)
interpret_cmd(cmdline);
}
}
```
After select, if the file in readfds is readable, result will be >0. After that, the command in the file will be read and the corresponding operation will be parsed. Finally, the file will be removed from the readset, and the number of `result` will also follow -1.
## CS:APP RIO Kit
### Principles and Considerations
In `console.c`, the place where `RIO Suite` is used is `read_line()`, the program reads commands from `file descriptor`, and each time it first obtains a piece of data from `kernel` and stores it in `buffer` Inside, if it is not enough, it will continue to ask `kernel` for data, so that each read will be executed in `user space`, and the `overhead` of calling `kernel` will be greatly reduced to make file reading more efficient.
## Dude, is my code constant time?
### intro
The experiment is basically to do Timing Leakage Detection on the execution tiom, measure two different t input data classes, and check whether they are statistically different. This method is not bound by some specific CPU hardware.
It is mainly divided into three steps:
1. Repeatedly measure execution time
At this stage, the `execution time` of two different `class`s will be repeatedly measured. The paper mentions different `leakeage detection`. Most of the difference will be the difference of `class define`. The `fix-vs-random` mentioned in the paper is to obtain a large range of `potential leakages`, and the use of `fixed-size` is to trigger the `“special” corner-case`.
2. Apply post-processing
Mainly divided into:
* cropping
Mainly responsible for dealing with some extreme values
* Higher-order preprocessing
3. Apply statistical test
This stage is to use a `statistical test` to refute the `null hypothesis`, if rejected, it means that it is not in constant time.
### Student’s t-distribution
#### Definition
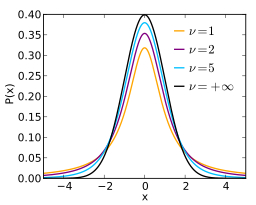
Student’s T Distribution can also be referred to as T Distribution for short. It is a normal distribution under sampling. When the number of samples is larger (the higher the degree of freedom), it will be closer to the normal distribution.
#### Purpose
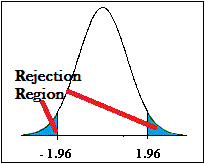
T Distribution is often used in hypothesis testing. When you want to judge whether two sets of data are the same, the figure below is `two-tailed test`, the closer to 0, the closer the two sets of data are, and the two sides are `Rejection Region` .
### Analyze code
In order to understand the usage of the code, we must understand the principle and operation of Welch's t-test, you can go to [lab-0](https://hackmd.io/@sysprog/linux2021-lab0#Welch%E2%80%99s -t-test) for a full description.
To put it simply, it is to use the time measured by two different classes, calculate the average and variance, and use the following formula to calculate the t value. The closer t is to 0, the closer the two samples are, which also means that the program is constant time.
$$
\large t = \frac{\bar{X_0} - \bar{X_1}}{\sqrt{\frac{s^2_1}{N_1} + \frac{s^2_2}{N_2}}}
$$
Next, we need to analyze the place where `dudect` is used in the program. It can be observed that in `is_insert_tail_const()` and `is_size_const()`, the structure `t` type is `t_ctx`, and the time data is stored in it. :
```c
typedef struct {
double mean[2];
double m2[2];
double n[2];
} t_ctx;
```
Among them, `mean` is the mean value, `m2` is n*variance, and `n` is the number of samples of different classes.
Then it will try `test_tries` times, each time it will judge whether it is `constant time`, if it is, it will be judged immediately, if it is not in the end, it will be judged that it is not `constant time`, and then it will enter the main processing data and calculation time The function `doit()`
```c
static bool doit(int mode)
{
int64_t *before_ticks = calloc(number_measurements + 1, sizeof(int64_t));
int64_t *after_ticks = calloc(number_measurements + 1, sizeof(int64_t));
int64_t *exec_times = calloc(number_measurements, sizeof(int64_t));
uint8_t *classes = calloc(number_measurements, sizeof(uint8_t));
uint8_t *input_data =
calloc(number_measurements * chunk_size, sizeof(uint8_t));
if (!before_ticks || !after_ticks || !exec_times || !classes ||
!input_data) {
die();
}
prepare_inputs(input_data, classes);
measure(before_ticks, after_ticks, input_data, mode);
differentiate(exec_times, before_ticks, after_ticks);
update_statistics(exec_times, classes);
bool ret = report();
free(before_ticks);
free(after_ticks);
free(exec_times);
free(classes);
free(input_data);
return ret;
}
```
In `doit()`, I think `prepare_inputs` needs more attention. Look closely at the code inside:
```c
void prepare_inputs(uint8_t *input_data, uint8_t *classes)
{
randombytes(input_data, number_measurements * chunk_size);
for (size_t i = 0; i < number_measurements; i++) {
classes[i] = randombit();
if (classes[i] == 0)
memset(input_data + (size_t) i * chunk_size, 0, chunk_size);
}
for (size_t i = 0; i < NR_MEASURE; ++i) {
/* Generate random string */
randombytes((uint8_t *) random_string[i], 7);
random_string[i][7] = 0;
}
}
```
It can be known that it is doing data pre-processing. First, random_bytes will give a random number to the input_data dynamic array, which will be used as the workload to be assigned to the queue. You can see that the classes array is divided into `class 1` and `class 2' ` Here just corresponds to `fix class` and `random class` in the paper, if it is `class 0`, then clear the value of that section.
Going back to `doit()`, the remaining parts are easier to understand, namely:
* measure
The main purpose is to calculate the time. Here, the data of `drop_size` will be shaved off for filtering. In the paper, it should be the part corresponding to `cropping`.
*differentiate
Use the result of `measure` to get the time difference.
* update_statistics
Import the time difference, then filter out the value of overflow.
* report
Calculate the `t` value, and then judge whether it is `constant time`.