---
tags: notes
---
# Log of Meetings
(in reverse order)
## 20211123
Tica led us through an [Airtable-to-Unity tutorial](https://github.com/ticahere/ll_Airtable-in-Unity), showing us how to create a virtual gallery using data from an Airtable.
## 20211116
Zane did a [D3 tutorial](/JDifXR_fT--uRVrSNa3F6Q?both)!
## 20211109
@marlon will do a little blender tutorial!
## 20211102
Hey gang! Today we're doing more sketching! Last week we did some intro to encoding basics, and this week we're building upon that with the SEAS project data. Here are two data sets: [SEAS Faculty and Research Interests](https://github.com/SEASVis/SEASVis.github.io/blob/main/data/Final%20Visualization%20Data_People.csv) and [SEAS Faculty and Centers](https://github.com/SEASVis/SEASVis.github.io/blob/main/data/Visualization%20Data_Centers.csv). You're welcome to focus on just one, or try to sketch a figure/graph/visualization that combines both. We're going to be working through the Map, Sketch, and Decide workflow, and hopefully at the end of the workshop today, everyone should have their own hackmd file where they describe the data, jot down questions, and upload pictures of their sketches. (This file, with the documentation of the workflow, is called a process book.)
If you weren't able to come last week, give this hackmd [document](https://hackmd.io/ia25si6HTD2_MBiwwdjGCQ) a quick read, maybe do one or two of the activities if you can, and join us anyway!
## 20211026
Outline
1. Introduce the SEAS project
2. Go through the document quickly and do activities 1 - 3
3. Activity 4
[Data Visualizaton Part 1: Encoding Data](https://hackmd.io/@cluster-1/ByfEtrNIK)
Tica and Zane led today's cluster meeting, part one of two on datavis!
## 20211019
[Intro to mapBox](https://hackmd.io/JrzTNK-FSqKUOrbD1deeog)
## 20211005
first cluster 1 meeting!!
### agenda
* how many labs are there here, really?
* relatedly, can we come up with a better name than "cluster 1"
* examples of what you want to do and make--let's share them
* Kagni shared [this site](https://new.shuge.org/) that's backed by a database of books/illustrations. No English equivalent that she knows of, but she's interested in doing something along these lines.
* 
* Eduarda shared two maps of Rio that make polemical/critical arguments about the city, maps that are "intervened up and reworked"
* 
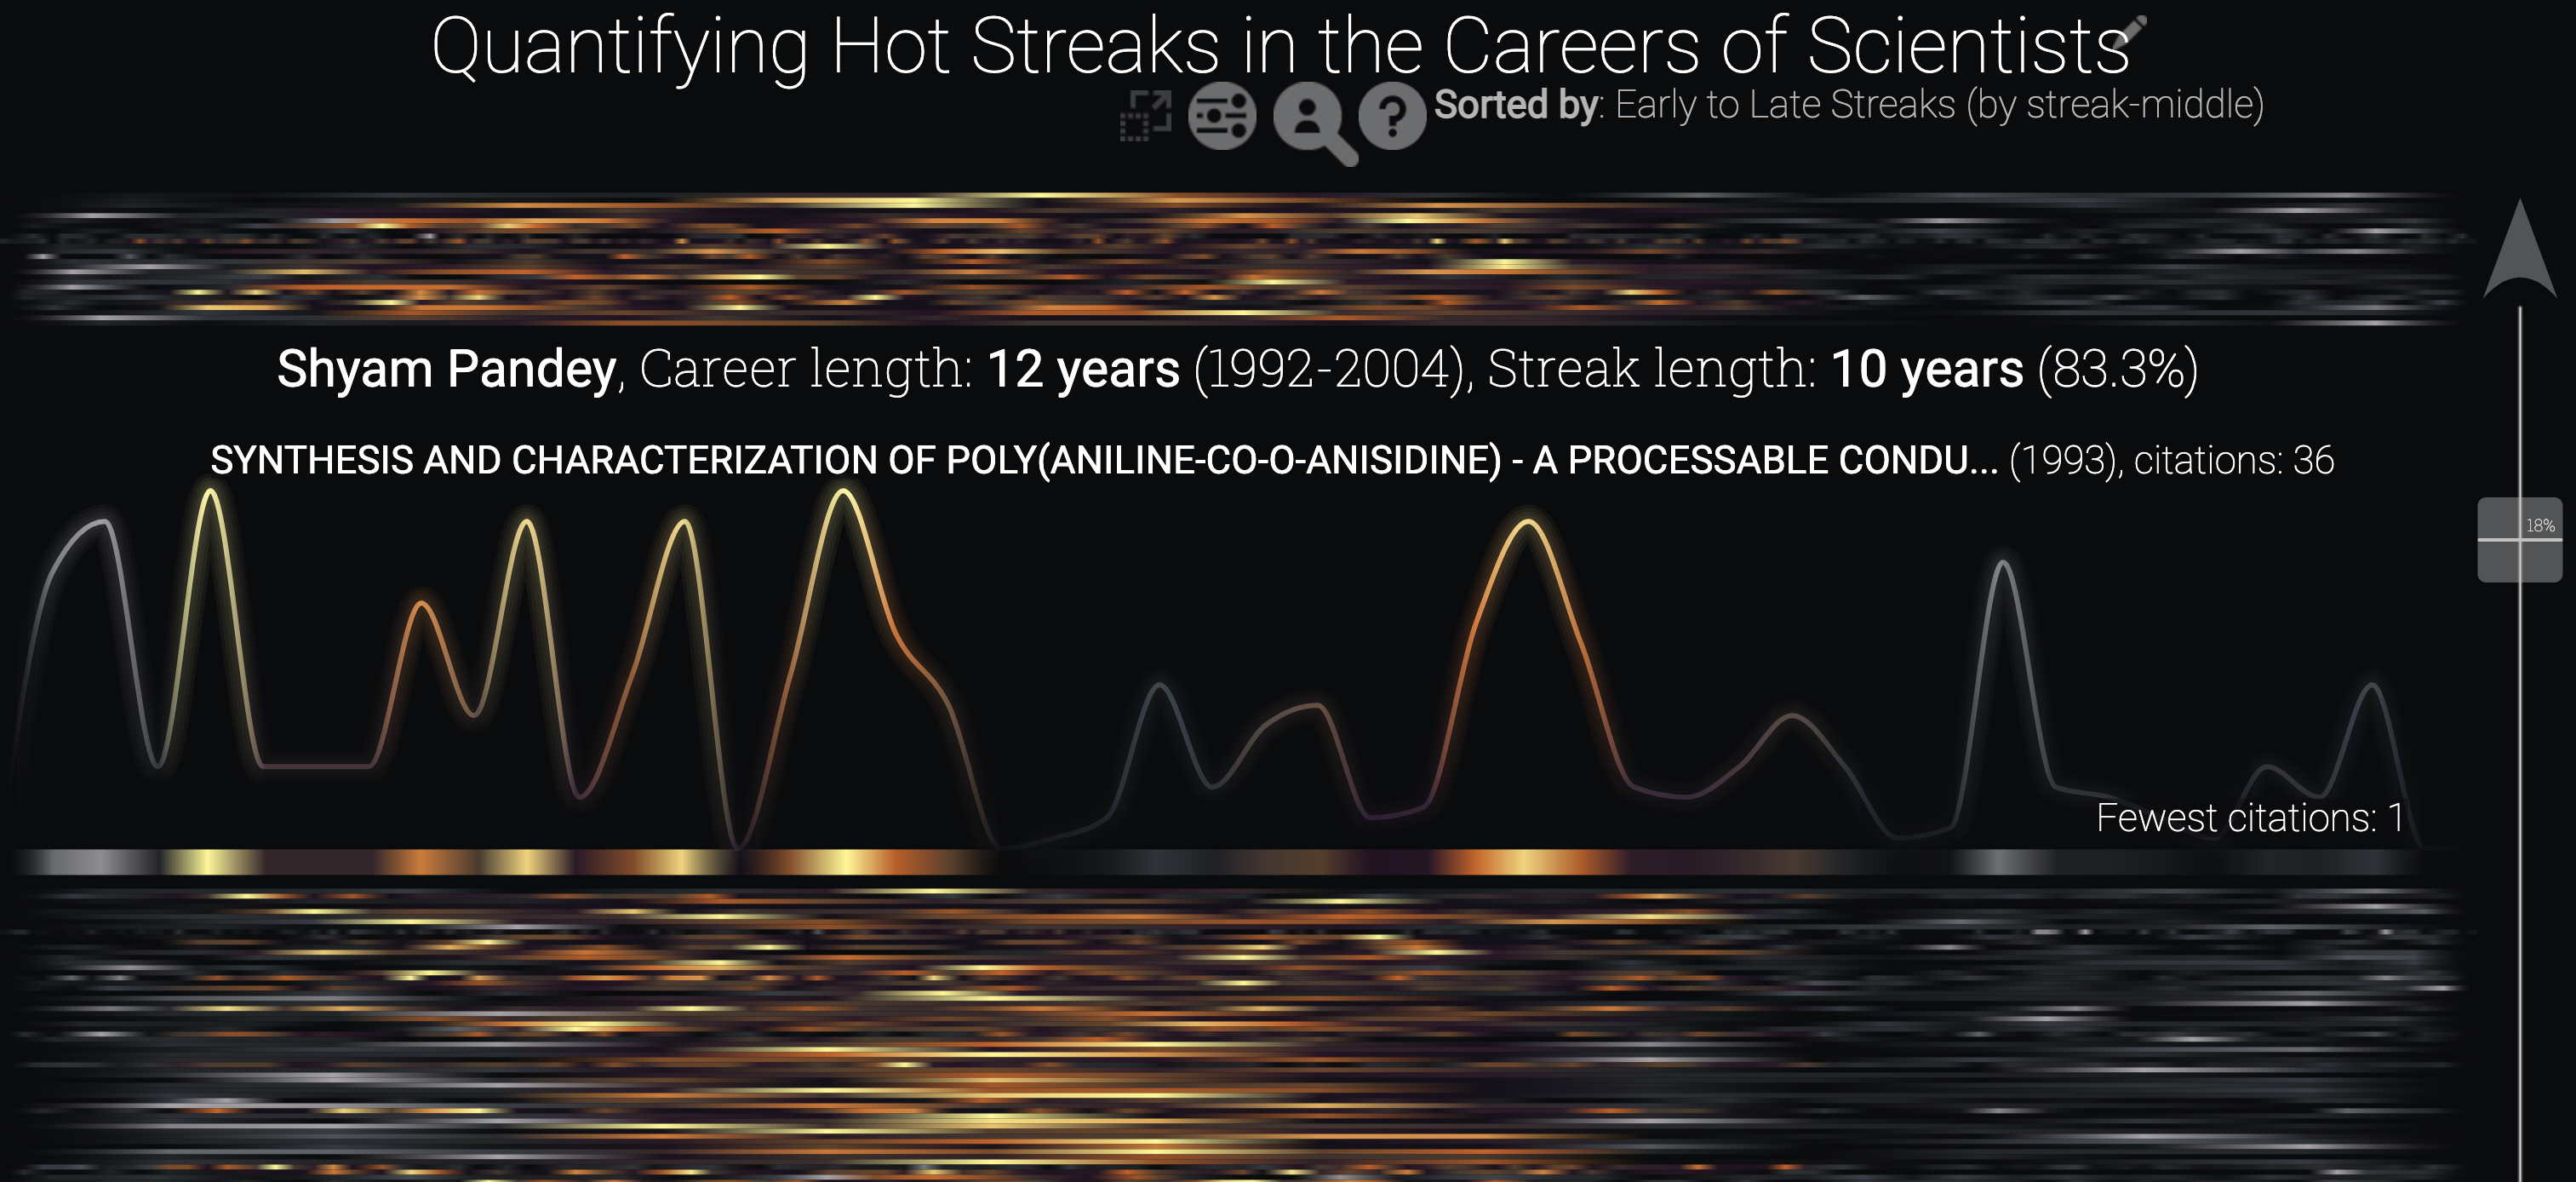
* Zane shared [this link](https://nuitrcs.github.io/kellogg-insight-hot-streaks/?dataset=scientists&sorting=streak_middle) to "Hot Streaks" in scientists' careers. And an [article](https://insight.kellogg.northwestern.edu/article/career-hot-streaks) discussing both the research project and the visualization.
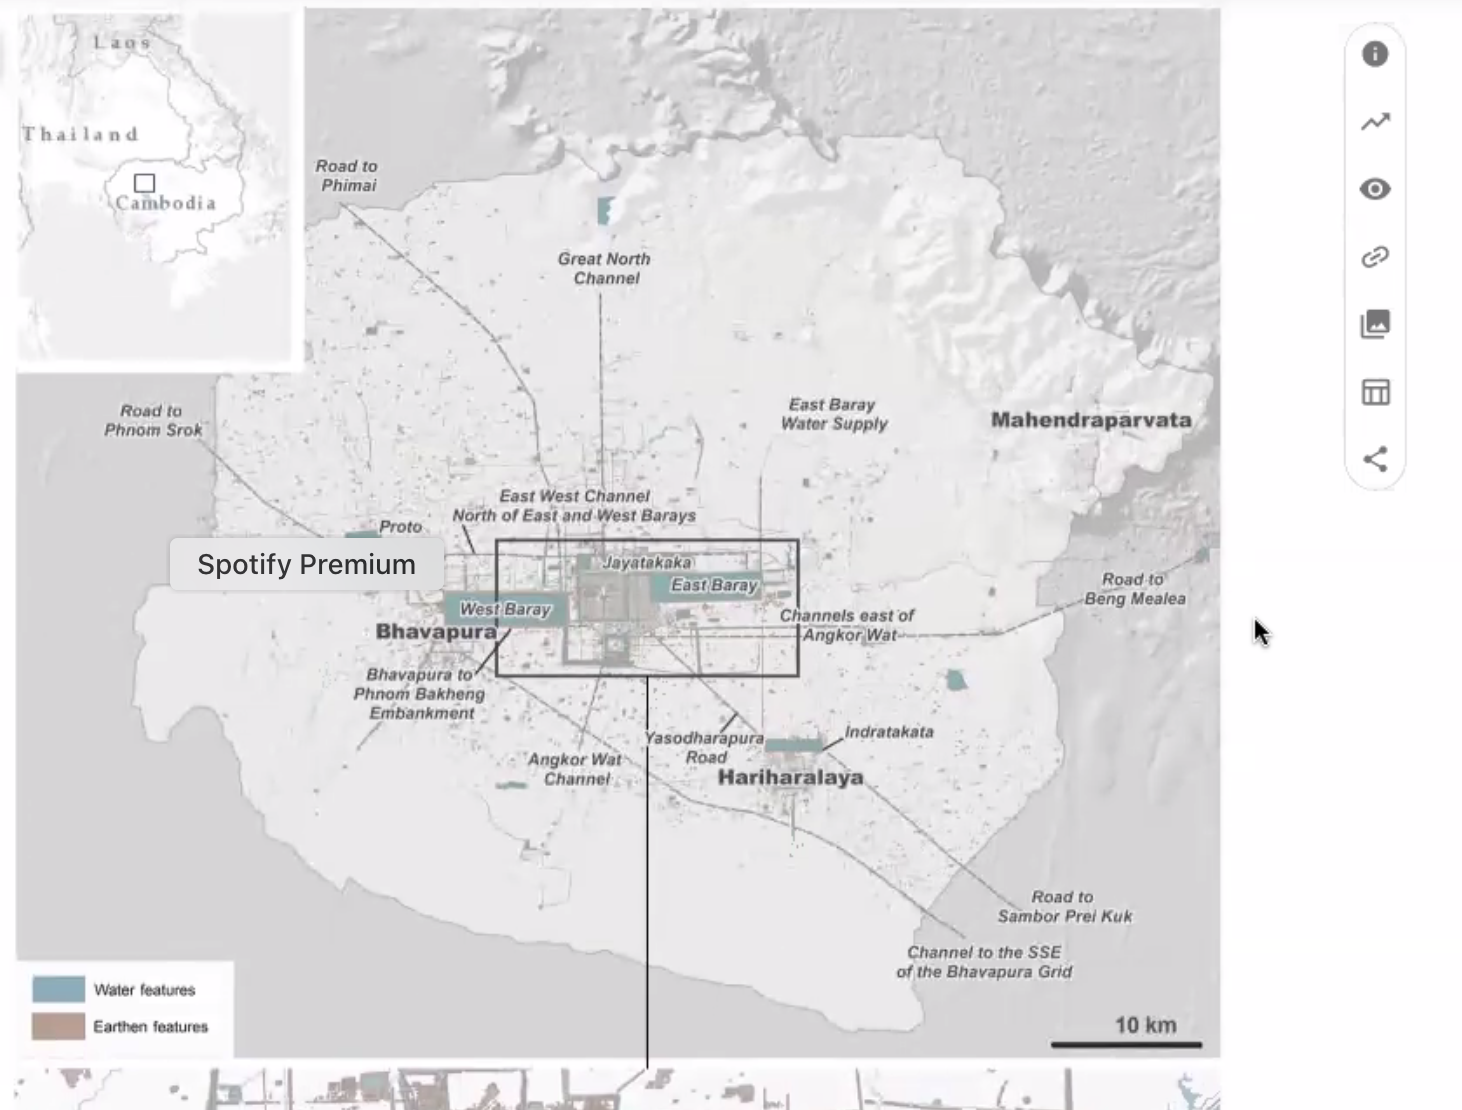
* Claire shared [a map showing pop growth within an archaeological site](https://www.science.org/doi/10.1126/sciadv.abf8441), to show a transformation through time
* Juhee shared a recreation of a 19c English public health official who traced cholera outbreak to find the origin being the sewage system if the city. base map is current london. 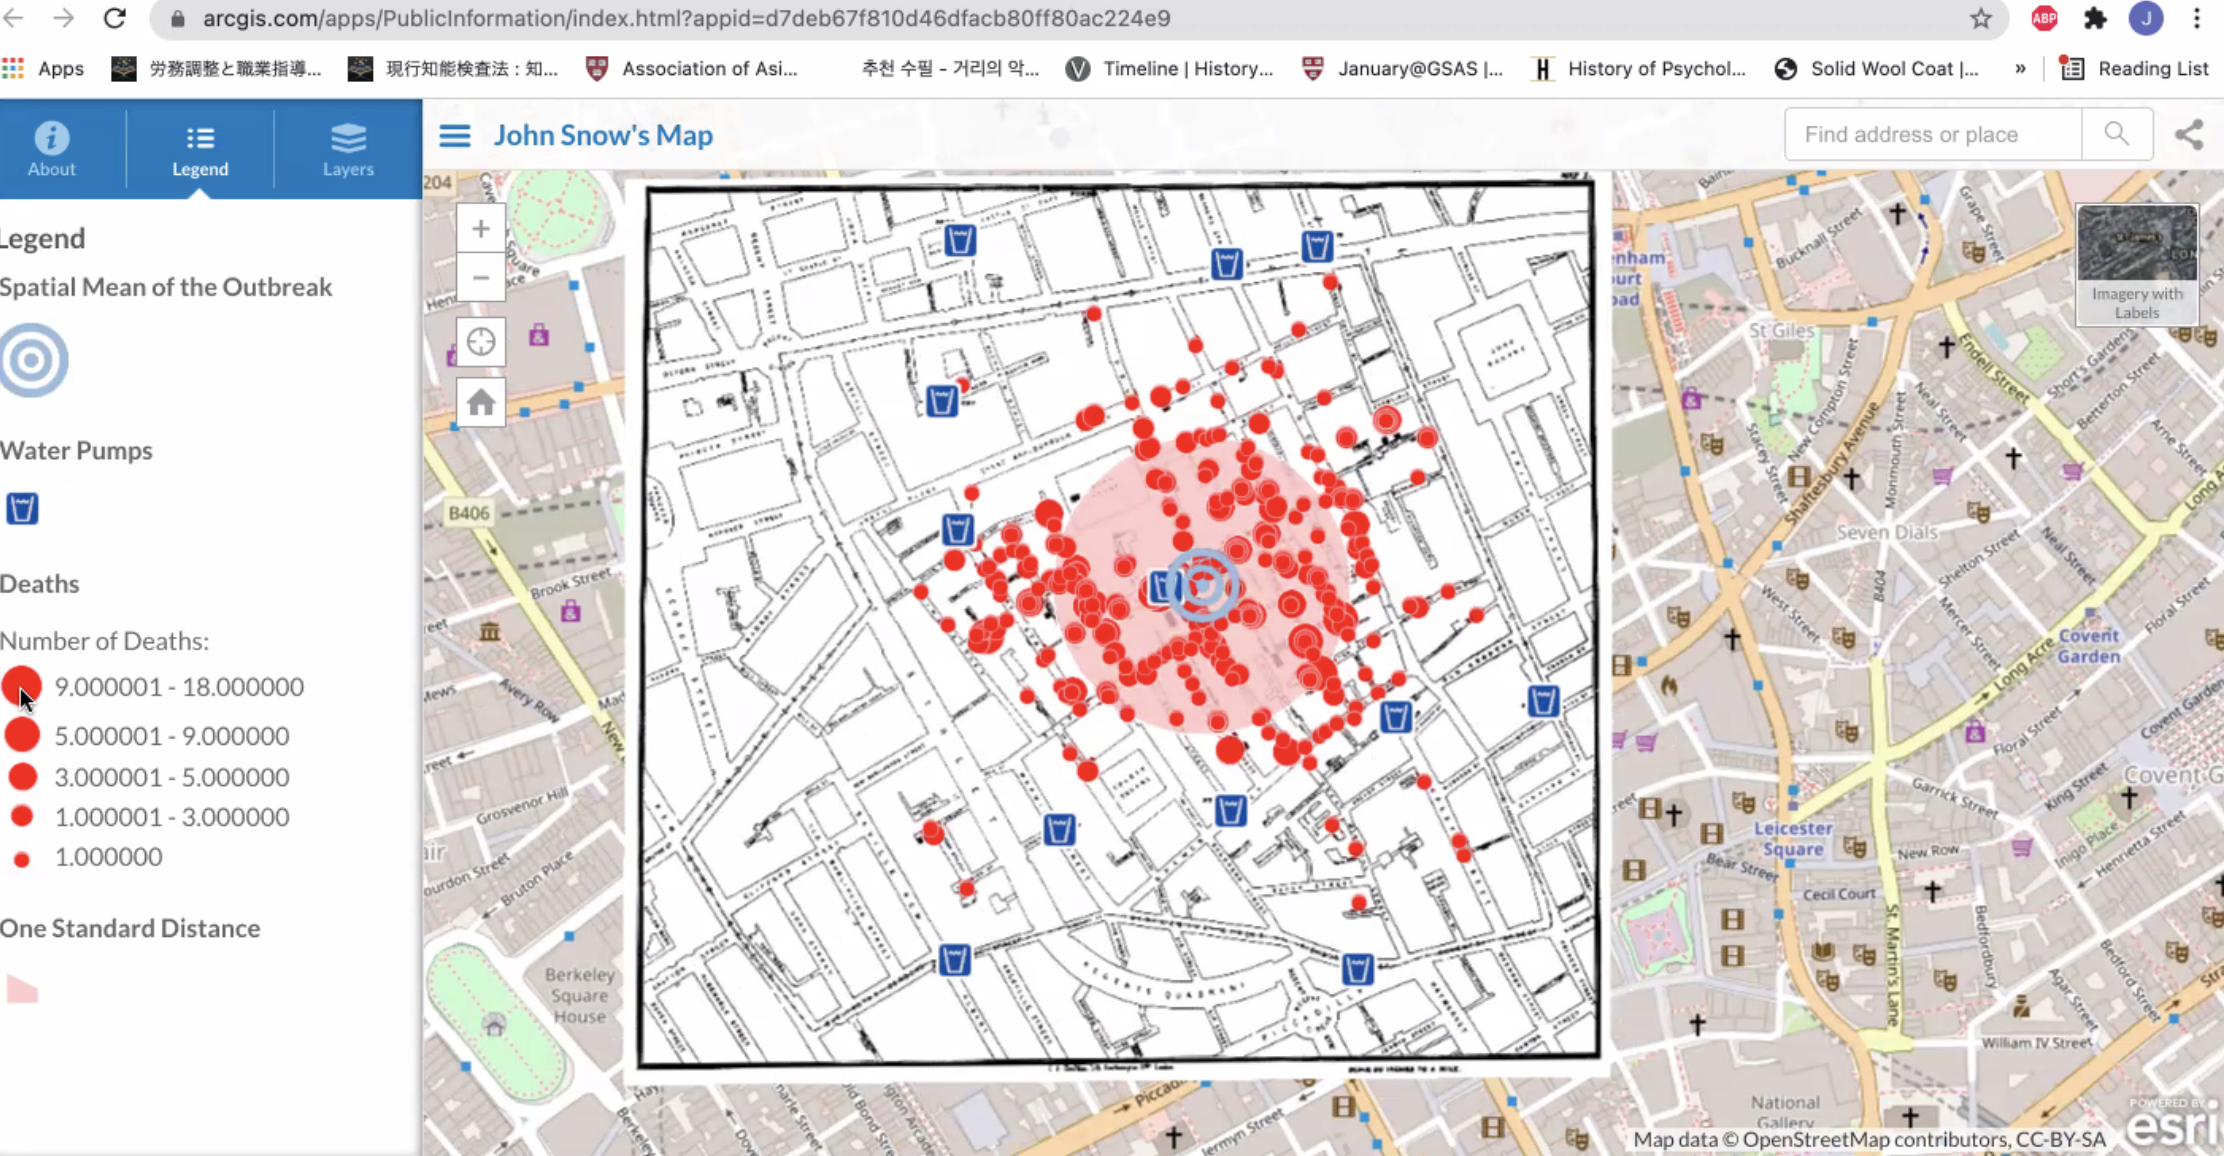
* Taylor has been cataloguing some options on pinterest of simple but creative ways of representing different forms of data 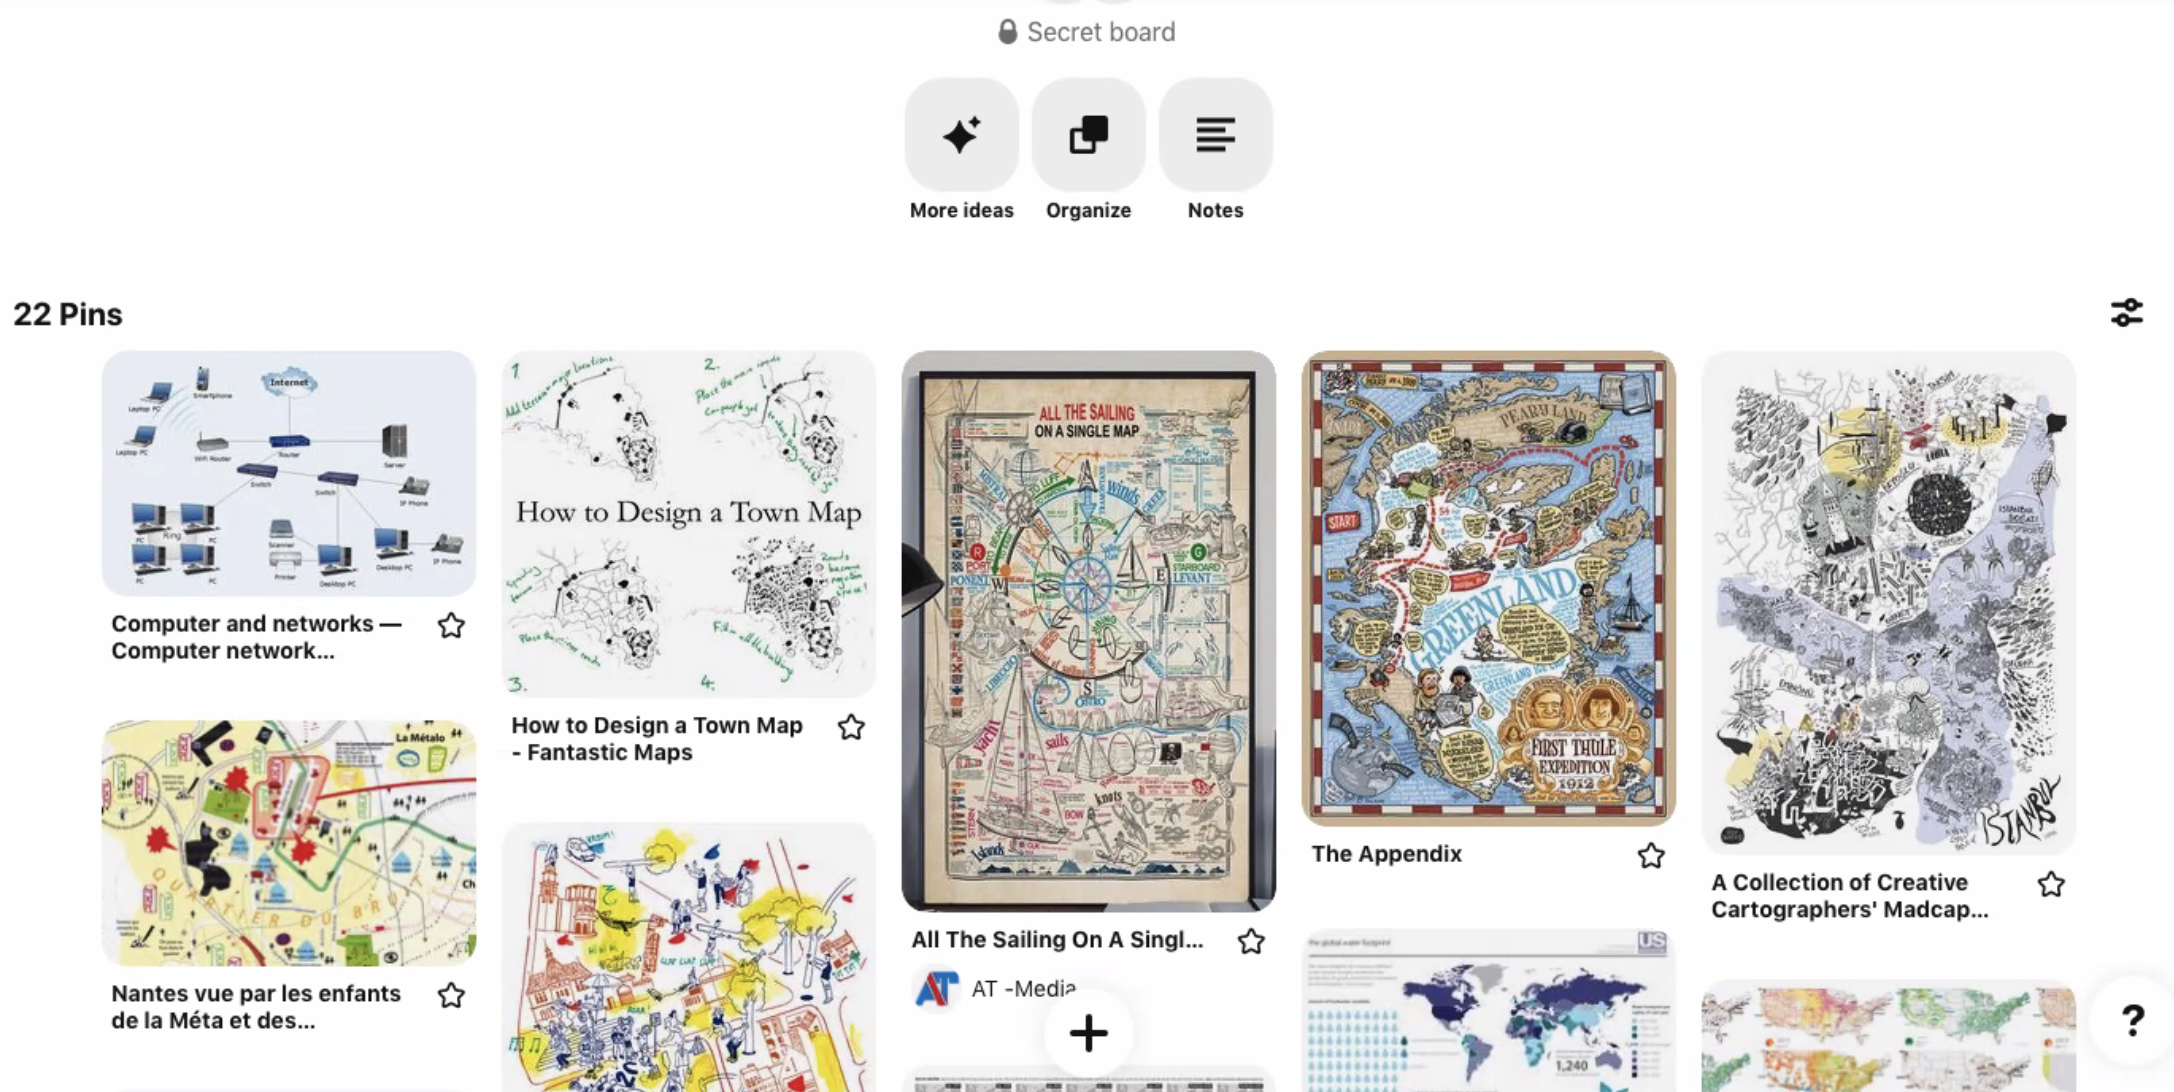
* Tica shared [mapbox](https://www.mapbox.com/mapbox-gljs) which helps give geographic tours with annotation for guided narratives, 3D visualizations, etc. 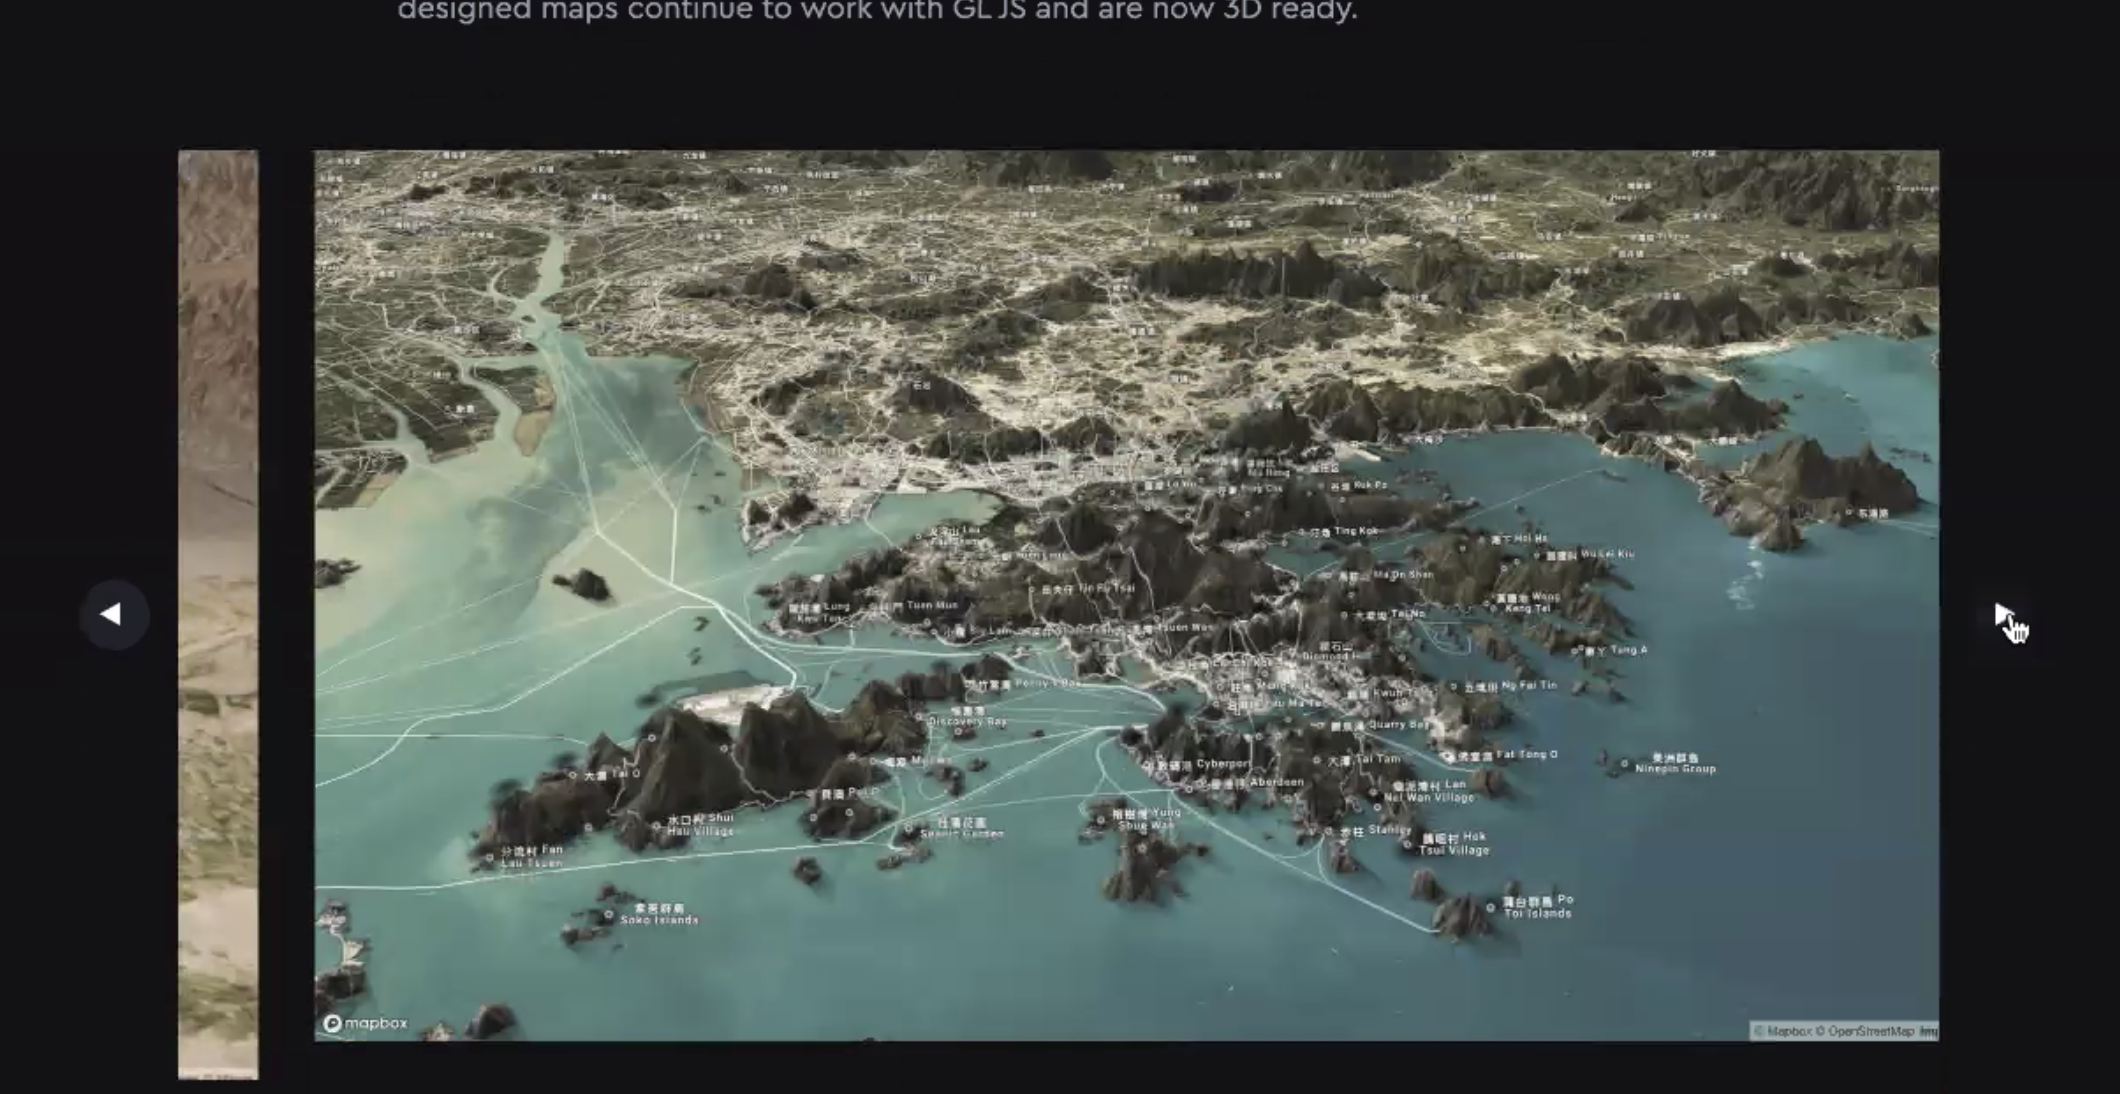 Also interested in Harvard campus tour and using blender to import google map 3D models into it, and then bring into vr to see how it works. Could add location markers, or annotations. 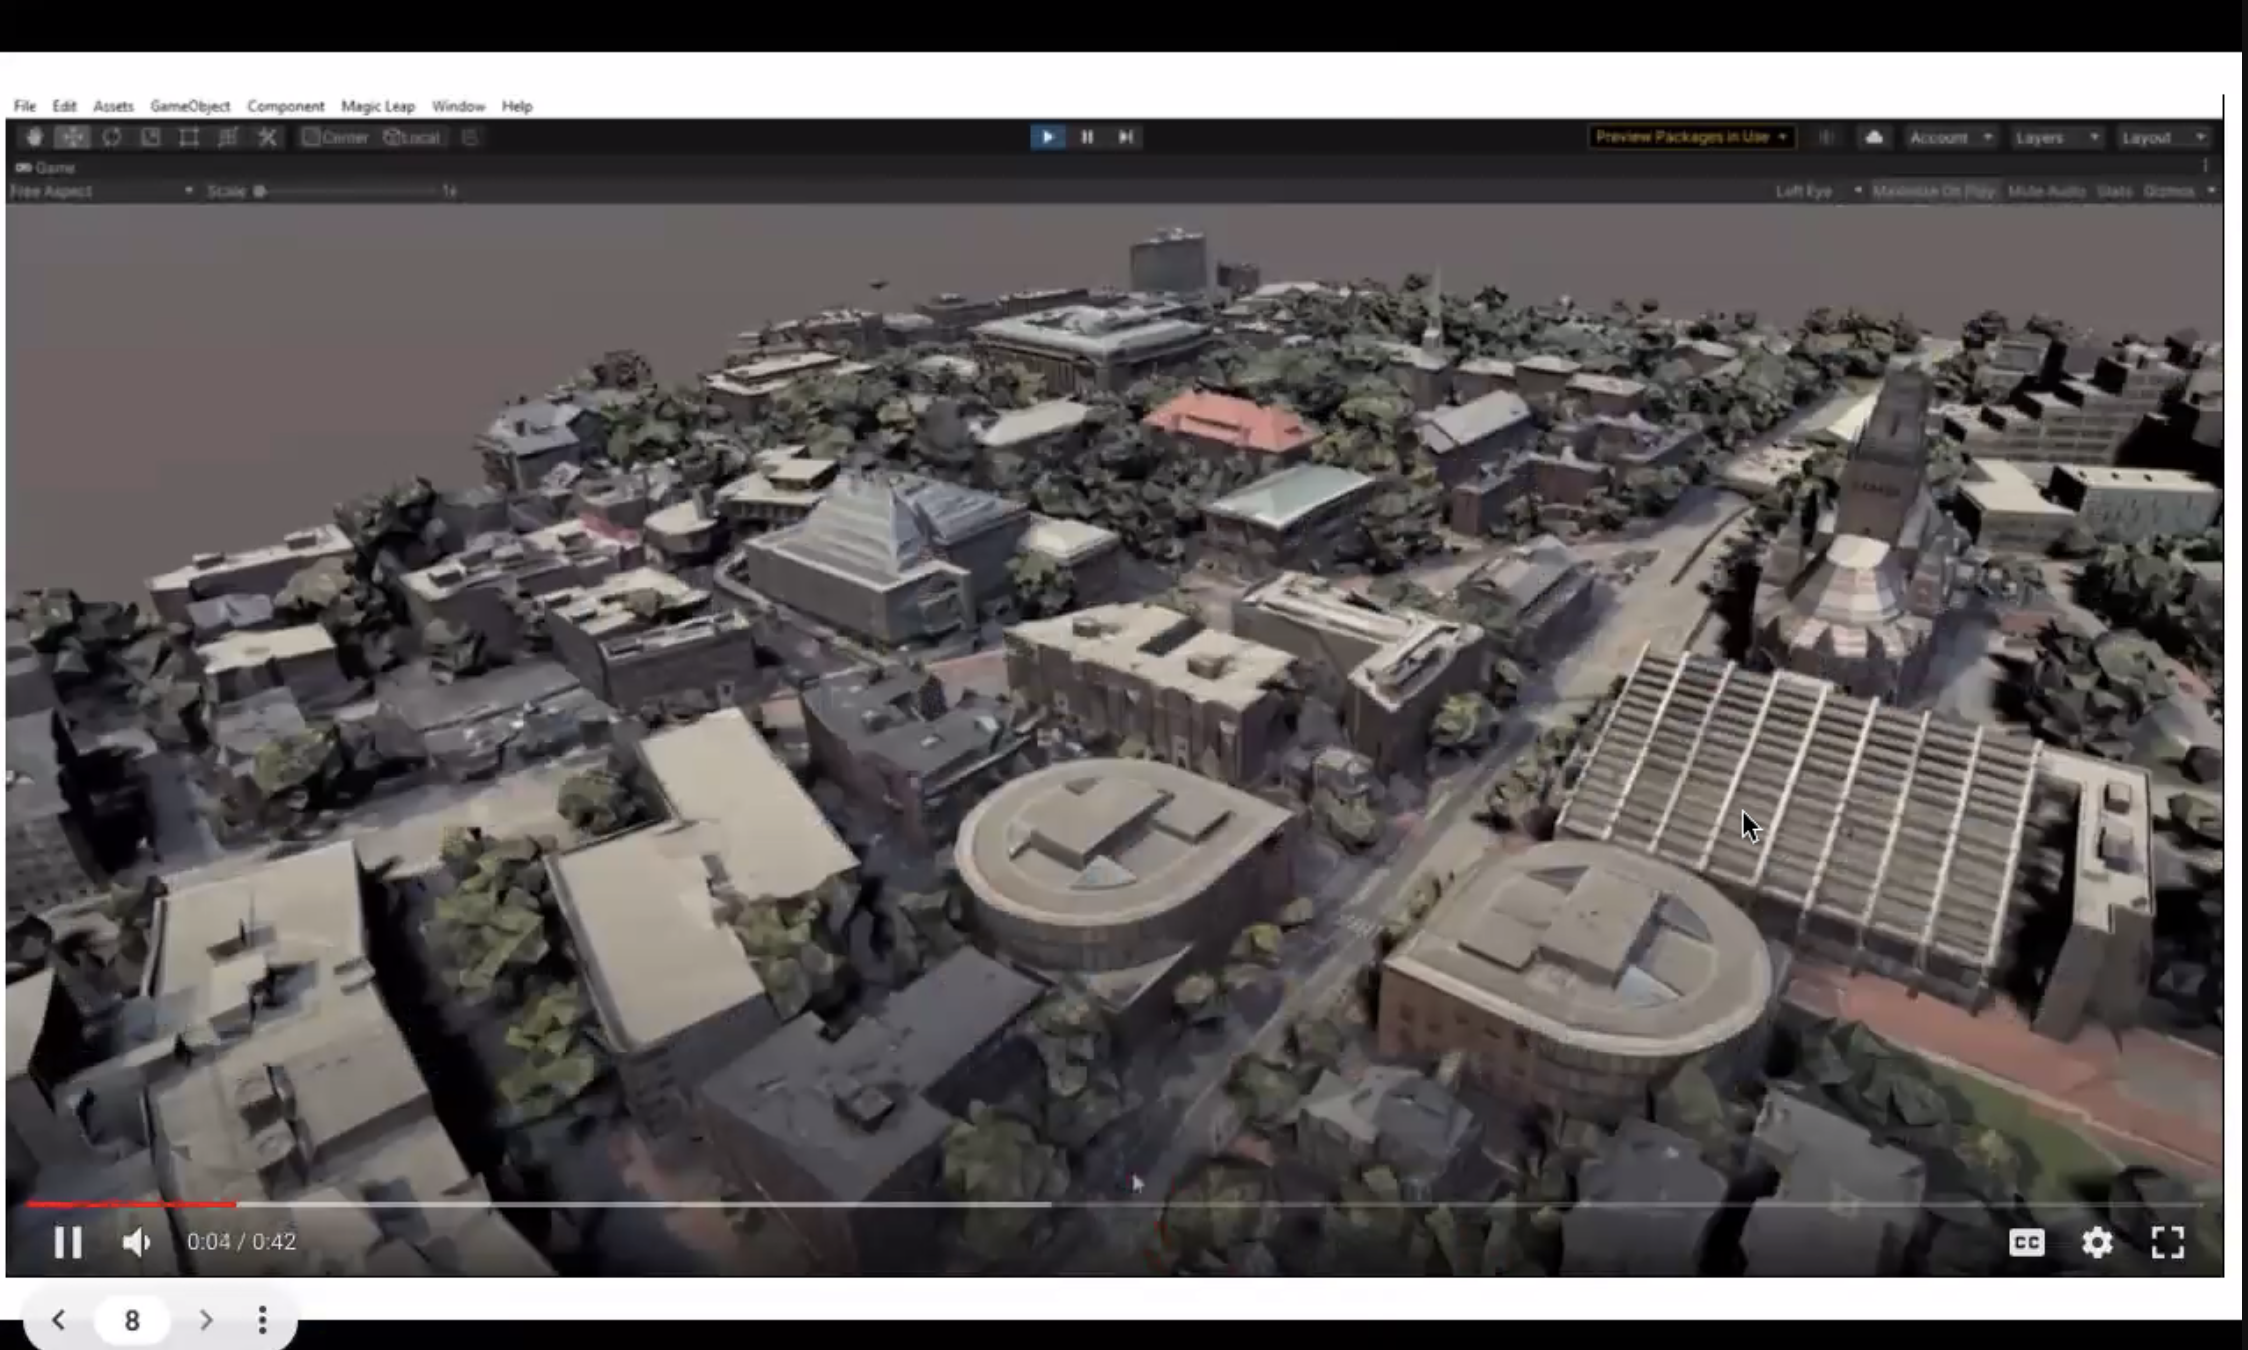 and here is a youtube video walkthrough: <iframe width="560" height="315" src="https://www.youtube.com/embed/F_XsmoZJmG8" title="YouTube video player" frameborder="0" allow="accelerometer; autoplay; clipboard-write; encrypted-media; gyroscope; picture-in-picture" allowfullscreen></iframe>
Here is [the plugin](https://github.com/eliemichel/MapsModelsImporter) Tica currently uses to create a 3D model from another set of maps and topographies, which supports google earth and google maps. You can also explore Mapbox because they seem to provide 3D building model & terrain model as well.
* Zane shared [a repo](https://github.com/zanewolf/dataDesigner) that houses her collection of data visualizations that are not made using code, but Affinity Designer.
* Here is the doc from our [Summer 2021 seminar on Maps of Time & Space](https://hackmd.io/QeFHvgg5RU-io4rD0ejJjQ), which has even more links, resources, etc.
* what do we all have to learn? let's design (realistic) learning pathways
* tentative plan of who might do some initial tutorials or show and tells first?
* Juhee: two separate projects for classes
* post-war Japanese history
* students create one slide on the map and create something like the arcgis story
* lit faculty wants a database of instances of humanities scholars using maps in their scholarship
* Zane shared a link to [a tutorial for learning mapbox custom map in under 30 mintues!](https://dataviztoday.com/mapbox?rq=mapbox)
* Claire is willing to do a tutorial on QGIS or arcGIS potentially as a field trip to the library
* what we are excited to learn:
* Kangni: GIS would be great! Would also be interested in learning Mapbox
* Claire: I would be interested in a Blender/Mapbox tutorial, but I am an extreme beginner at all coding.
* Juhee: second both Kangni and Claire
## 20211001
we talked a bit about cluster 1 in the MDF meeting. Note follow!
### collective project ideas
- a resourceBase for ways of visualizing data and visualization?
- compare and contrast tools for mapping and datavis and telling datastories, beginner AR
- would this maybe be "the basics?"
- what types are there beyond the basic quantitative tables and graphs that students are used to already
- would this be "beyond the basics" then?
- what are the OTHER possibilities?
- to represent quantitative data in a research context
- spatial representation of data
- interacting with data, seeing in many ways
- how to visualize narrative
- interested in annotations?
- [Talkies by Flourish ](https://flourish.studio/2019/02/07/audio-talkie-visualisation-data-stories/)
## 20210924
### mapLab
Taylor and Marlon had a great chat about **mapLab**, zeroing in on a potential assignment sequence that would take students from sketching out maps with paper and pencil to using digital tools for a capstone project. Taylor will be making [the notes Marlon took here](https://hackmd.io/Rc39uMt1SeWF2qTo0LPW1w?view) much better over the coming week!
MAP IDEAS!!!
- map as game-board
- map as interpretive illustration of a fictional world
- Students can "map out" a story (or connecting multiple stories) they read as a final project
- map an article (with layers)
- map as an illustration of network and of object/people movement
- map, if overlay-able and recorded as a video, to show changes over time
- map for assignment
- e.g. history of social medicine and epidemics: give students John Snow's cholera outbreak statistics and London city map, and come up with the mapped analysis themselves
- map as digital humanities analysis
- map as an interpretive tool for character development
- map as moral decision-making tool (mattering maps)
- How can we use maps as a tool to track important narratives and values when there is no “right” answer?
- History — lots of maps! Historical maps in 19th century. Maps and narratives. 19th century map of a region of Brazil—a narrative of empire, what the colonial govt would like for that region…the maps were sort of aspirational.
- Contesting maps. Take a historical map and then discuss the theoretical and historical context and change the map to reflect their conversation/historical evidence of what was going on at the time.
- More from Eduarda: I think it could really go well with the example you guys showed of the physical model of the Boston Common, and could be used in the Harvard map idea Marlon was discussing. I think contesting already-existing maps by doodling, tweaking, cutting-up, or pasting ideas into a physical model of them could be a good way for students to 1) think more critically about map-making, and 2) imagine new, creative ways of making maps and representing contested narratives. As a social historian, I was thinking for instance of how the maps I consult in my research do not take into consideration the historical subjects I study the most - common citizens, enslaved workers, indigenous subjects, street workers, religious practitioners, etc. What would it look like if I visually contested a known map as a social historian that centers these subjects' worldviews? What do we do with borders, with streets, mountains, rivers, oceans? There are some interesting articles I have read on that a while ago:
- Benton, Lauren. A Search for Sovereignty: Law and Geography in European Empires, 1400-1900. Cambridge University Press, 2010.
- [Bonilla, Yarimar and Max Hantel, "Visualizing Sovereignty: Cartographic Queries for the Digital Age," sx archipelagos 1, 2016.](https://drive.google.com/file/d/1goZhKU5_yzoS4tHda8ecQh1Tu1TNw5-9/view?usp=sharing)
- This article could give us some food for thought, I think. And it includes lots of visual representation of data.
- [Johnson, Walter, “What do we mean when we say, ‘Structural Racism’? A Walk down Florissant Avenue, Ferguson, Missouri” Kalfou 3, 1, Spring 2016.](https://scholar.harvard.edu/files/wjohnson/files/ferguson_kalfou_published.pdf)
- This one, by Walter Johnson, from the History Dept, is to me a written, contested map of Ferguson. May be interesting to take a look at as well. What would a visual map-version of this article look like?
- Celtic - Mapping folklore and stories, migration and political changes and how they change folklore
More map inspo:
- Jessi's favorite map...[map of Christopher Robin's Hundred Acre Wood] (https://www.pinterest.com/pin/38069559328497850/)
- [LL curated **medium-maps** board on Pinterest](https://www.pinterest.com/learninglabpins/mediummaps/)
### realityLab
Marlon met with Tica, MDF for Computer Science, to brainstorm activities for this year's realityLab (which is all about AR/VR):
* let's think of an array of activities and projects for the Fall term
* it would be great if interested undergraduates could proceed through an array of 4-7 activities that "level up" their skills in tools like Unity, Blender, etc. over the course of the term
* they are, in a sense "testing" the tutorials you might create for a course
* they are ALSO learning to contribute assets to your projects (and maybe even code in certain circumstances)
* great ideas for deliverables include
* proofs of concept of things we can imagine a Harvard course wanting
* AR-enriched experiences of Harvard's campus (where we encounter location-specific stories, images, 3d models that align with a given discipline's content (like History))
* prototypes of things we can imagine doing in museums (virtual tours, AR maps overlain on top of the physical museum, annotations on top of artifacts and paintings)
* examples of potential student AR assignments. If I, as a student were to MAKE an AR installation or world for a course, what might this look like and what would the steps be?
* projects that make the LL Studio better in any way
* AR data on top of LL walls that tells the story of LL projects and people
* the ability to show the results of students' 3D work in the physical studio (i.e. if we run a Blender workshop, how quickly can we get their work "visible" in the physical space)
* game mechanics in the physical space
 Sign in with Wallet
Connect another wallet
Sign in with Wallet
Connect another wallet