---
title: 'smartfarmingdata.com Product Requirements'
disqus: hackmd
---
smartfarmingdata.com Product Requirements Document
===


# Welcome to smartfarmingdata.com PRD.
If you are used to only PPTs then [click here](https://docs.google.com/presentation/d/1pDjcUWRNFp2w-4fFH31fRCEurqSGNQ6B7RiqC4G0YmY/edit?usp=sharing), but you love reading? then scroll down
## Table of Contents
[TOC]
### Team smartfarmingdata.com
This team is on a mission to solve a massive global problem that is troubling Agriculture - Global Warming. Farmers are at the fore-front of this change and it needs immediate solving. We are missionaries of SmartFarming using Data. This product will battle food security, yield reduction due to climate change, risk due to environmental changes and more and our weapon is DATA
1. Plantation specialist (product & design) - Ramya & Maitreyi
2. Sourcing and sowing of seeds (data & research) - Research - Alok & Muz data - Veer anna, Nithin + Pareekshith
3. Ploughing (development) - Pradeep Don Rathod, Nidhin, Giriraj, Pareekshith + Tinu + Chandu
4. Fertilizers (AI & ML model building) - Nithin, Veer, Pareekshith + Chandu
5. Harvest quality check (QA QC) - One and only Shruti UK
6. Farm management - Ramya, Arun, Jaideep and Akshay
We will take a research approach to problem solving to build smartfarmingdata.
Hence research is our strategy to build this product. The following describes at brief what this product is all about, however, we will be writing a full paper around the various problems and the areas that this product will solve.
Here is what we are motivated about:
> “We need teams of missionaries, not teams of mercenaries.” ― Marty Cagan, INSPIRED: How to Create Tech Products Customers
## What is smartfarmingdata.com, why are we building
smartfarmingdata.com is a suite of APIs for natural integration of satellite images, remote sensing data, data driven analytics and forecasts to agricultural applications and machine learning
It is important to have deep clarity about why we are building this, because:
> "Clarity breeds mastery" - Robin Sharma
Attention: This product document an MVP. Because:
> “Keep the focus on minimal product. Your job as a product manager is not to define the ultimate product, it’s to define the smallest possible product that will meet your goals.” ― Marty Cagan, Inspired: How To Create Products Customers Love
Problem
---
(Biggest solvable problem, for smallest possible product that will meet our goals)
* Reduced soil productivity due to mismanaged water supply, fertilization and climate change
* Importance to learn about the capacity of soil to promote the growth of plants; protect watersheds by regulating the infiltration and partitioning of precipitation
* Reduced yield due to various reasons related to soil nutrition, quality, etc.,
* Loss of quality and income
* Climate change
Soils have important direct and indirect impacts on agricultural productivity, water quality, and the global climate. Soils make it possible for plants to grow by mediating the biological, chemical, and physical processes that supply plants with nutrients, water, and other elements there are lot more problems we address
Solution
---

Product Features - Big Plan
---
It all boils down to basically 3 main parts.
1. Satellite imagery API
Through a very simple API, users can get panchromatic multi-spectrum images of the crop for the most recent day or any day / days in history that applies NDVI, EVI, UVI, True color, false color, thermal and other data to power any data / AI driven technology to agriculture applications
2. Agro Weather API
This is repackaged Weather + Soil moisture + min max, average, solar radiance and other agri useful data from Ambee APIs
Combining the power of weather parameters like Temperature, Precipitation (rainfall), humidity and others along with a near real time volumetric soil moisture and surface temperature it can improve yield predictions, automate irrigation to fostering better management of water table, improved soil quality and lots more.
3. Live Visualization, Analysis & Forecast tool
Visualise your land on a simple drawable, interactive map that applies the latest high resolution of your farms satellite image over a polygon and see data on soil, soil moisture, crop condition, pest, weather parameters, forecast of weather, and plenty more. We combine multiple satellite images to help solve most of farming decision making and make daily tasks more effective.
Product Features - V1
---
**Release: Sept 2021**
**Main features:**
1. Satellite Imagery
Draw a polygon and get satellite image for the enclosed region. This would be an image with NDVI, EVI, UVI, True color, false color, thermal and other metadata applied.
Polygon bounds scope: 1 – 2000 acres
Time range: Upto 7 days history, current, and upto 72 hours forecast
2. Agro Weather API
This is repackaged Weather + Soil Ambee API’s + min, max, average, solar radiance and sun duration
Spatial resolution: 1 sqkm
Time range: Upto 7 days history, current, and upto 72 hours forecast
**Other features:**
Single Sign on, Get Support
User Input – collect primary data - prominent crops in the region
Error reporting/Suggestions input from users – whenever they find Ambee data amiss, give an option to report error; and suggest feature additions
How-to video
**Points to Remember:**
1. It is not about providing data. We are trying to solve a real problem in agriculture.
2. UI and Content play a big role in keeping the user engaged and get the best out of this. UI should be intuitive, easy to use, and minimalistic. Content should include topics like:
* Effects of climate change on agriculture and how they can be mitigated with satellite data.
* Case study of Tata coffee project
* Use cases where information from V1 product can benefit
-------------------------------------------------------------------------------------------------------------------------
Points taken from the discussion
for website
* landing screen (header, footer)
* subscription pricing
* dashboard
* single signon
* how to
* mark polygon
* satellite images
* soil+weather data/ API
* FAQ, support if user has any general queries (new support system)
for dashboard
* user data input - location
* create polygon
* additional user input (optional)- prominent crop
* display map selection and associated agro data
* option for user to suggest feature, report any error
### Role Based Access Control
---
RBAC functionalities
* * The main stage for the RBAC is a company
* * The user with the role Admin/Manager who is registered with the company Id forms the primary actor in the stage
* * The manager has control over the addition of users to the company and control of plans and payments
* * There are two scenarios for the creation of sub-users
a. A manager creates a sub-user and shares a common plan
In this scenario, a manager may choose to share a plan owned by him/company with the sub-users which means now the sub-users with whom he shares the plan all have a common plan
So if the company/manager has a plan for allowing 3 polygons and now he creates 2 sub-users and shares the plan. In this case, the 2 sub-users and managers together can create a max of 3 polygons.
If the manager shares a polygon he created with the sub-users he created in the above step, the image history of data for the polygon and the polygon itself is shared
b. A manager creates a sub-user and creates a different plan
In this scenario, a manager creates a separate plan for the sub-users which means now the sub-users have different plans and a whole different set of limits
So if the company/manager has a plan for allowing 3 polygons and now he creates 2 sub-users and creates individual plans with a max of 3 polygons per plan for them. In this case, each sub-user with an individual plan can create 3 polygons each.
If the manager shares a polygon he created with the sub-users he created in the above step, only the copy of polygon specifications is made to the sub-users, and the image history, etc of the polygon is not shared. We can discuss if this needs to be changed or history also needs to be copied.
#### Testing requirements
List of features to test regarding backend
1. Testing creation of user key and assigning to plan
2. Testing payments and invoice
3. Testing creation, Updation, and removal of polygon
4. Testing limits on the number of polygons that can be created per plan
5. Testing limits on the total area that can be covered per plan
6. Testing limits on the total area covered by a polygon per plan
7. Testing of fetching latest, history, and forecast for soil for a polygon
8. Testing of fetching latest, history, and forecast for weather for a polygon
9. Testing fetch of latest ndvi satellite image per polygon
10.Testing fetch of historical ndvi satellite image per polygon which is not in the database
11.Testing fetch of historical ndvi satellite image per polygon which is in database
RBAC related testing
1. Creation of sub-user by a user/company
2. Creation of separate plan per user
3. Sharing of existing plan with user or basically a common plan for multiple users
4. Handling of polygon limits in cases 2 and 3
5. Sharing of polygon between users on the common plan in which case all the images pulled by any one user will be available to all the users with whom the polygon is shared
6. Sharing of polygon between users but on the different plan in which case only the new copy of polygon specs is made available to the shared user

Note: Onground Sensors are optional to the user. The initial versions will not have onground sensors outside of India to start with.
So basically it combines NDVI, eVI, UVI Sat images + Soil data + Weather data, gives it in the form of API or a dashboard. History (upto 40 years), latest + forecast (upto 12 months). Its all there! Really! This data alone can work magic.

---
APIs
---
#### Satellite Imagery API (historical + current + forecast)
https://docs.google.com/spreadsheets/d/1CLBy4gDaf-Pfyeru5XUGYZM31NA2n8W7zzOq6bxjBFk/edit#gid=126431645

#### NDVI + EVI (historical + current + forecast)
check - https://eos.com/blog/ndvi-faq-all-you-need-to-know-about-ndvi/
#### Soil Parameters (historical + current + forecast)
#### Weather Parameters (historical + current + forecast)
#### DESIGN Wireframes:
https://www.figma.com/file/PILGMY4tvoGXgVo6cw4pbd/SFD
Use Cases
---
* Monitoring of soil moisture behavior helps understand water supply, crop management, moisture consumption, correlation with weather etc.,
* Better Fertilizing will assist in high quality + uniform Yield
* Better water table management
* Monitoring the effects of farm, ranch, or forest activities on soil productivity
* Realtime conducting observations on soil stability, moisture retention or drainage, sustainability, and environmental impact
* Combining Soil + Weather, plenty of ways to improve yield
* Battle Climate change
* Improved soil productivity (avoid over fertilize, under fertilize, early yield, delayed yield etc.,)
Competition
---
https://agromonitoring.com/
https://up42.com/
https://www.greensat.in/commodity-trends
https://www.satsure.co
https://www.gramcover.com/
https://www.dvaraeregistry.com/
https://sima.ag/en
https://www.bharatkrushiseva.com/
https://farmonaut.com/

CropX
Arable
Ceres Imaging
Gamaya
AgriData
Agrowatcher
AgEagle
PrecisionHawk
Aker Technologies
How are we different
---
* More Satellites, more data
* Higher accuracy and granularity
* All in one place - API + Dashboard + Marketplace (future) + Carbon trading
* Option of IOT + Remote sensing (only ones to do both)
* Customizable APIs for specific farming needs
* New images every day | 500 TB usable images | 10 m resolution | On-the-fly processing and more
Marketsize
---
The global remote sensing technology market size was valued at USD 12.40 billion in 2019 and is expected to grow at a compound annual growth rate (CAGR) of 11.6% from 2020 to 2027. Remote sensing technology is used for acquiring information about the earth’s surface and to analyze its physical characteristics. It uses reflected and emitted light from aircraft and satellites without the need for physical contact with the surface area under study. The market is mainly driven by the increasing number of earth observation projects by numerous space agencies. For instance, the Indian Space Research Organisation (ISRO) has thirteen earth observation satellites to date and plans to launch ten earth observation satellites during 2020-2021. The outbreak of the COVID-19 pandemic led numerous countries to impose strict lockdown measures. This led to an increase in the adoption of remote sensing technology to monitor and curb the spread of viruses and document environmental changes.
For agriculture too this is a widely used technology sizing to $2B by 2024 and growing fast due to issues around food shortage, climate change and availability of usable data.

For instance, in June 2020, NASA, Japan Aerospace Exploration Agency (JAXA), and European Space Agency (ESA) partnered to create a new earth observation dashboard that documents changes in the environment and human lifestyle due to the COVID-19 virus. The dashboard integrates numerous satellite records to allow user-friendly tracking of changes in climate, agriculture, and economic activity. Increasing adoption in smart city projects is paving the way for market growth. The technology helps authorities in zoning and urban planning, infrastructure modeling, and security and law enforcement planning. Numerous countries are focusing on developing infrastructure and are investing heavily in their smart city projects. This is expected to propel the market growth over the forecast period.
The need for high initial investments in the manufacturing of numerous components is impeding the growth of the remote sensing technology market. The market players need to manufacture components and encrypt data content that meets the standards set by regulatory organizations. This limits the growth possibilities for companies in the market. However, increasing adoption in research and exploration applications is expected to drive the market in the next seven years.
The growing adoption of Internet of Things (IoT) technology in the agriculture sector is anticipated to drive the market growth over the forecast period. IoT in agriculture uses remote sensors, drones, robots, and computer imaging to monitor crops and provide data to farmers for effective farm management. IoT-based and remote sensing employs sensors placed on farms and collects data which is transmitted for analysis purpose. Farmers can monitor the crops from an analytical dashboard and act accordingly based on the insights.
Technology
---
Modules of Harvestify:
Satellite Data gathering Microservice
Machine learning microservice
IoT Sensor Network (optional)
Front end
MACHINE LEARNING MODULE
This module helps in achieving the following objectives:
Crop Recommendation
Fertilizer recommendation
Working:
```
Step 1:
Get real time data from the soil
Step 2:
Merge it with weather parameters of the soil obtained from Ambee’s APIs
Step 3:
Feed it to the Machine Learning model to give recommendations to the farmers
```
Input: Soil Data + Weather Data
Output: API response format ( JSON )
{
“crop” : “Jute” , “soil_moisture” : 55 }
Overview of the ML Module
IoT Sensor Network
This module helps in collecting the real time data from the soil to the main server via LoRa WAN.
Working:
Step 1:
Collect the soil data from the Satellites
Step 2:
Convert it int0 appropriate format
Step 3:
Send the data to the receiver module
Step 4:
Forward the received data to the cloud infrastructure.
### Overall Working of the Project
Which satellite imagery have near-infrared for NDVI?
As mentioned before, satellites like Sentinel-2, Landsat and SPOT produce red and near infrared images.
This ![list] https://gisgeography.com/free-satellite-imagery-data-list/ of 15 free satellite imagery data sources has data that we can download and create NDVI maps in ArcGIS or QGIS.
For example, we use NDVI in agriculture, forestry, and the environment.
User story
---
> I choose a lazy person to do a hard job. Because a lazy person will find an easy way to do it. [name=Bill Gates]
**Feature: Agri Weather Data**
**User Persona**: Agritech company product owner
"I need access to reliable latest farm related environment data because I want to visualise yield, analyze my farm health, activity and more. And I want to do it without any sensors. I want it NOW!
**Scenario**: User logs in to the Dashboard
Given I have subscribed to the app
When I see my farm location
And I click "Select my farm"
Then I can draw a polygon of the farm on my map
And I see soil moisture, weather, forecast, NDVI and analytics
And I can then download, export, monitor or be alerted about my farm
User Journey (Dashboard)
---
### How User starts working on the Dashboard
```sequence
User1->smartfarmingdata.com: Creates an account
Note left of User1: User signs in, sees free demo, subscribes/pays
User1->smartfarmingdata.com: Show Dashboard Home page
User1->smartfarmingdata.com: User1 selects polygon of his farm
Note left of User1: User1 interacts with dashboard
Note right of smartfarmingdata.com: API request of polygon with latlong is sent
User1->smartfarmingdata.com: Selects polygon of his farm
smartfarmingdata.com->User1: Analyzed farm data
```
User Journey (Agri Weather API)
---
```sequence
User1->smartfarmingdata.com: Creates an account
Note left of User1: User signs in; gets API Key
User1->smartfarmingdata.com: Can access Sat images
User1->smartfarmingdata.com: Can access Soil + Weather
User1->smartfarmingdata.com: Can access Forecast and others
User1->smartfarmingdata.com: User1 selects polygon of his farm
User1->smartfarmingdata.com: User1 makes an API call
Note right of smartfarmingdata.com: API request of polygon with latlong is sent
smartfarmingdata.com->User1: Gets Billed
smartfarmingdata.com->User1: User sees analyzed farm data
```
What is NDVI (Normalized Difference Vegetation Index)?
Normalized Difference Vegetation Index (NDVI) quantifies vegetation by measuring the difference between near-infrared (which vegetation strongly reflects) and red light (which vegetation absorbs).
#### How do we calculate NDVI?
As shown below, Normalized Difference Vegetation Index (NDVI) uses the NIR and red channels in its formula.

Healthy vegetation (chlorophyll) reflects more near-infrared (NIR) and green light compared to other wavelengths. But it absorbs more red and blue light.
This is why our eyes see vegetation as the color green. If you could see near-infrared, then it would be strong for vegetation too. Satellite sensors like Landsat and Sentinel-2 both have the necessary bands with NIR and red.

The result of this formula generates a value between -1 and +1. If you have low reflectance (or low values) in the red channel and high reflectance in the NIR channel, this will yield a high NDVI value. And vice versa.
Overall, NDVI is a standardized way to measure healthy vegetation. When you have high NDVI values, you have healthier vegetation. When you have low NDVI, you have less or no vegetation. Generally, if you want to see vegetation change over time, then you will have to perform atmospheric correction.
#### Example of NDVI in agriculture
Let’s examine NDVI for an agricultural area with center pivot irrigation. Pivot irrigation rotates on a point creating a circular crop pattern.
In true color, here’s how it looks for red, green, and blue bands. We say true color because it is the same as how our eyes see.

In the formula, you can see how NDVI leverages near-infrared (NIR). So when we put the NIR band to display as red, we get color infrared. We say color infrared because near-infrared is in the red channel. As you can see below, the pivot irrigation vegetation should already be shouting out at you in bright red!

When you apply the formula, bright green indicates high NDVI. Whereas red has low NDVI. So it’s quantifying vegetation by measuring the difference between near-infrared (which vegetation strongly reflects) and red light (which vegetation absorbs).

#### How will NDVI Help us?
Or lets ask - How do we use NDVI?
We see several sectors using NDVI. For example, in agriculture, farmers use NDVI for precision farming and to measure biomass.
Whereas, in forestry, foresters use NDVI to quantify forest supply and leaf area index.
Furthermore, NASA states that NDVI is a good indicator of drought. When water limits vegetation growth, it has a lower relative NDVI and density of vegetation.
In reality, there are hundreds of applications where NDVI and other remote sensing applications is being applied to in the real world.
Now combine that with soil moisture data, soil surface temperature, weather, you got what you need to solve the problem at hand.
#### What satellites will we use?
We will mostly use Sentinel-2, Landsat and SPOT produce red and near infrared images.
Front-end Deisgn Wireframes (Will be updated here soon)
---
> “Design: Design the optimal visual and user experience for the product. Engineering: Build the product. Suggest how the technical road map can drive product and vice versa. Product: Set the product vision and road map and ensure the company builds a product that the user needs. Make trade-offs and prioritize between design, engineering, and business concerns.” ― Elad Gil, High Growth Handbook
Project Timeline
---
```mermaid
gantt
title A Gantt Diagram
section The first steps
Design :a1, 2021-01-04, 60d
Data gathering : 2021-01-20 ,30d
Data modelling : 2021-02-20 ,30d
section Putting it all together
Product development :2021-03-07 , 45d
Test and deploy : 24d
```

## Meeting minutes
---
:::info
Latest meeting minutes: **10 August 2021**
:::
Attendees: Chandu, Tinu, Ramya
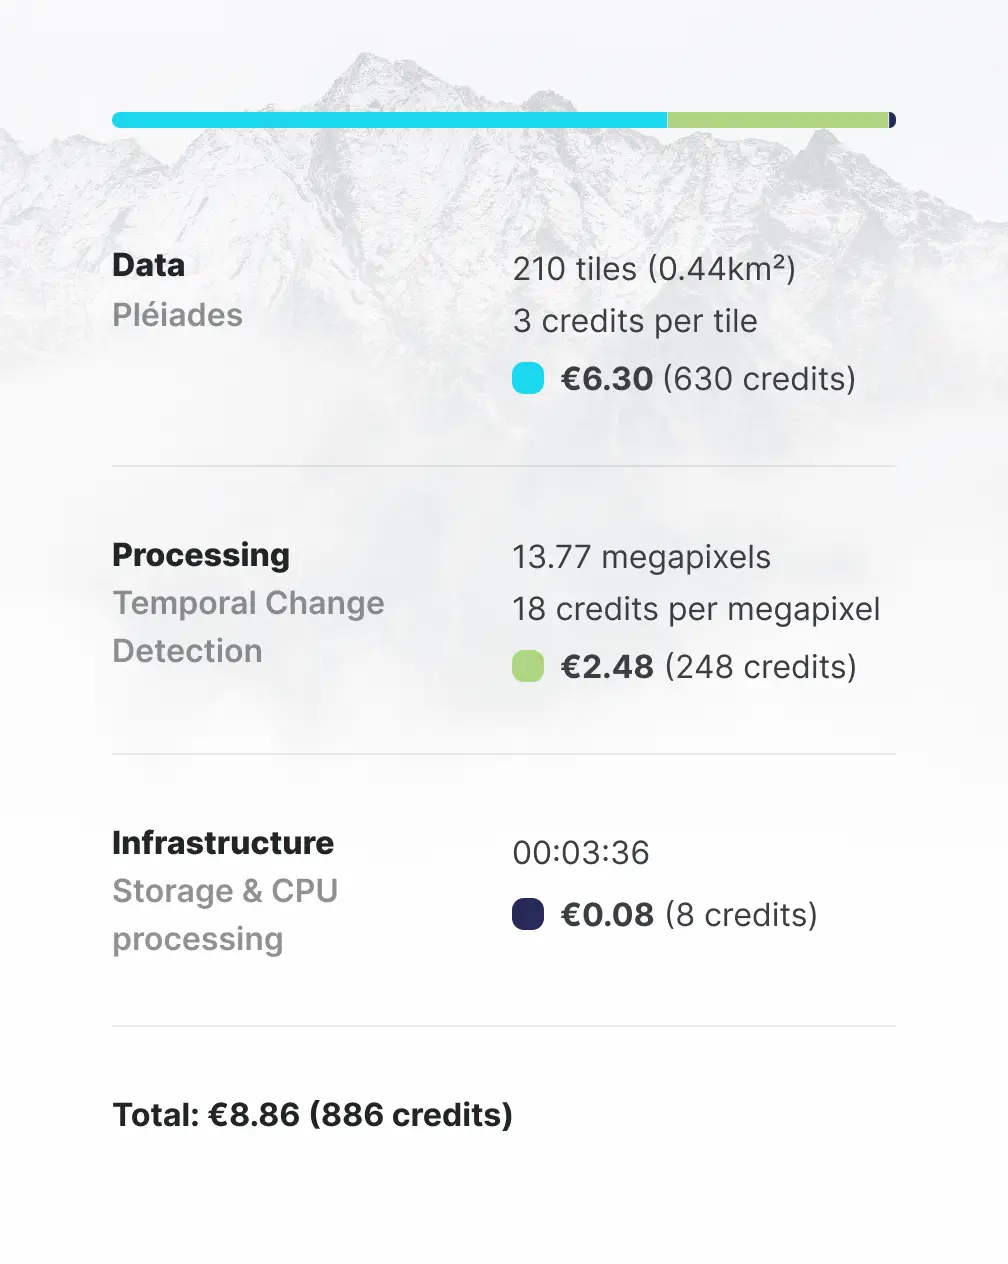
Agenda: Pricing model
1. It is based on pre-paid credits, just like in UP42
2. Determine number of tiles within a polygon of X sqkm and compute charges for:
1. Data charges - based on satellite charges
2. Processing - based on server charges
3. Infrastructure - based on AWS charges
4. API records - based on number of location points supported in the given area
3. Pricing should also consider that the image and data would be stored in our database for a period of **6** months from the date of purchase.
4. Number of tiles to be decided based on the zoom factor supported by sentinel and on what we decide to support.
5. Sentinel 2 resolution is fixed at 10m, so we are not offering the choice of resolution to user, hence no need to consider that in price calculation.
6. At the time of checkout, we should state the exact number of credits being deducted, and give split of charges.
7. [Pricing Sheet](https://docs.google.com/spreadsheets/d/1Sh144Zur3OGjGaDZc74x4ja-gSAFMYo6P5ZFWJLvk2Y/edit#gid=0)
8. Refer to UP42 example price: https://up42.com/pricing
AI: Chandu and Tinu to come up with estimation of charges as per above points
:::info
Meeting minutes: **03 August 2021**
:::
Attendees: Chandu, Maitreyi, Tinu, Pradeep, Ranjani, Maddy, Arun, Nidhin, ShruthiUK, Teju, Ramya
1. Satellite image to be placed at the center of the screen in dashboard.
2. Under My Polygons, UI should show option to Edit and Delete
3. Resources section to have: a. Use cases b. How-to videos c. New Updates d. FAQ
4. When owner adds users, email will be sent to them, with specific registration link. If user has already signed up, then the mail will have the option for user to "Accept". And then both of them would be linked.
6. Need to work on Pricing plans <Ramya>
7. Show upgrade option in Billing.
:::info
Meeting minutes: **29th July 2021**
:::
Attendees: Chandu, Maitreyi, Tinu, Ranjani, Ramya
Wireframes:
https://www.figma.com/file/PILGMY4tvoGXgVo6cw4pbd/SFD
We discussed the whole flow, features on dashboard, and Account and [RBAC management](https://hackmd.io/sw6-P1FFTLWBCu8psYJ0-Q#Role-Based-Access-Control).
:::info
Meeting minutes: **19th July 2021**
:::
Attendees: Chandu, Maitreyi, Pradeep, Ramya
1. User creates and saves polygons
2. User views a list of polygons and selects a polygon to fetch data for. It can be for the lastest time point or for a different date in history.
3. Console shows the estimated time for image to be ready.
4. Once, ready, user can view the image and all agro parameters.
5. Each fetch is tagged with the timestamp of the image, and will show the next refresh time point. User can view the previous fetches on a timeline.
Call flows and wireframes:
https://ambee.atlassian.net/l/c/kSux2mMh
Next steps:
Maitreyi to prepare call flows and wireframes for console covering above points.
:::info
Meeting minutes: **5th July 2021**
:::
1. Draw Polygon validation to include check for polygon size (limit to 2000 acre)
2. Polygon Id will be usable across Ambee API's
3. Scheduled refresh of user's data can be supported (V2)
4. **Open point**: how to handle a large polygon where weather parameters can change across different points. May be, in a tool tip, warn the user when it hits a certain acreage, suggest for marking of sub-polygons ...
So effectively, 1 user can have many polygons; each polygon can have many sub-polygons (child polygons) <**Chandu**>
5. Mandatory sign up with work email to be enforced.
6. Heat map for display of farm land (V2)
7. UI needs to Assert Brand value; display Blog and Use cases in a prominent manner; come up with call flows from user perspective <**Maitreyi**>
UI design to include:
> Developer page (API)
Pricing
Get Started with trial price for first 50 users; pay full price from Jan 2022 onwards
Account management, Billing management, Order history
Support option
:::info
Meeting minutes: **29th June 2021**
:::
1. Image resolution and interpretations with data.
2. Weather parameters agro monitoring what we can give the list
3. Soil parameters from the agro monitoring list
4. Refresh rate and first time study time.
5. We will choose a place and time for the above study.
6. Forecast of the images time window and max future.
7. Navigation for big farms where exactly he needs to give attention or compare.
8. Create irregular polygons and Save polygons (upto 10), each of range 1-2000 acres.
8. Save previously pulled data. Option for the user to view on a timeline and compare dashboards across 2 time points.
9. Subscription payment on a monthly basis. Option to redraw a saved polygon - once every 30 days.
10. Free plan to show low resolution images, limited API calls. Premium plan to show high res images and increased number of API calls.
## Appendix, References and FAQ
https://www.researchgate.net/publication/313448667_Big_Data_in_Smart_Farming_-_A_review
https://www.sciencedirect.com/science/article/pii/S0308521X16303754
:::info
**Find this document incomplete?** Leave a comment!
:::
###### tags: `smartfarmingdata.com` `Documentation`
Inspiration:
> “Your customers are the judge, jury, and executioner of your value proposition. They will be merciless if you don’t find fit!” ― Alexander Osterwalder, Value Proposition Design: How to Create Products and Services Customers Want
Close this if you are not from Ambee. This is copyright protected material!
 Sign in with Wallet


