# `cAdvisor`
###### tags: `ITRI`, `cAdvisor`, `K8s`
> Ref: Community of *8bitmen* > [What is cAdvisor? How Does it Work? Explained…](https://www.8bitmen.com/what-is-cadvisor-how-does-it-work-explained/)
***
## 1. What is `cAdvisor`?
It is **c**ontainer **advisor**. 從名字顯而易見:
- It provides resource usage, performance characteristics & related information about the containers running on the cloud.
- It is an open-source tool & runs as a daemon process in the background collecting, processing & aggregating useful DevOps information.
- native support for Docker
- enables us to track historical resource usage with histograms & stuff
|Where|Description|
|-|-|
|In Linux| <li>Where the official cAdvisor releases are built</li> <li>It has a small image size</li> |
|In K8s| <li>cAdvisor is ==integrated into the Kubelet binary==</li><ul><li>It is pretty intelligent to auto-discover all the containers running in the machine & collect CPU, memory, file system & network usage statistics.</li></ul> <li>It also provides a comprehensive overall machine usage by analyzing the root container.</li>|
簡而言之,*cAdvisor* 要能夠協助拿到 metadata 並藉由其它可視化工具顯示出來。抽象化來看 *cAdvisor* 想要解決的問題是:

> Now, what is a *Kubelet*? I’ve talked about it in the cAdvisor Kubernetes section up ahead in the article. So, stay tuned.
***
## 1-1. How Do I Access the Container Data Collected by `cAdvisor`?
*cAdvisor* 所收集的 data can be viewed with the help of:
- web-based UI which it exposes at its port.
- via a REST API
## 1-2. `cAdvisor` 可以收集怎麼樣的 data 呢?
- Container Information, typically
- container name
- list of sub-containers
- container-spec
- detailed usage statistics of the container for:
- the last N seconds,
- a histogram of resource usage, etc.
- Machine Information
- the number of schedulable logical core CPUs,
- memory capacity in bytes,
- maximum supported CPU frequency,
- available file systems, network devices,
- the machine topology – nodes, cores, threads etc.
## 1-3. The Author's Experrience with `cAdvisor`
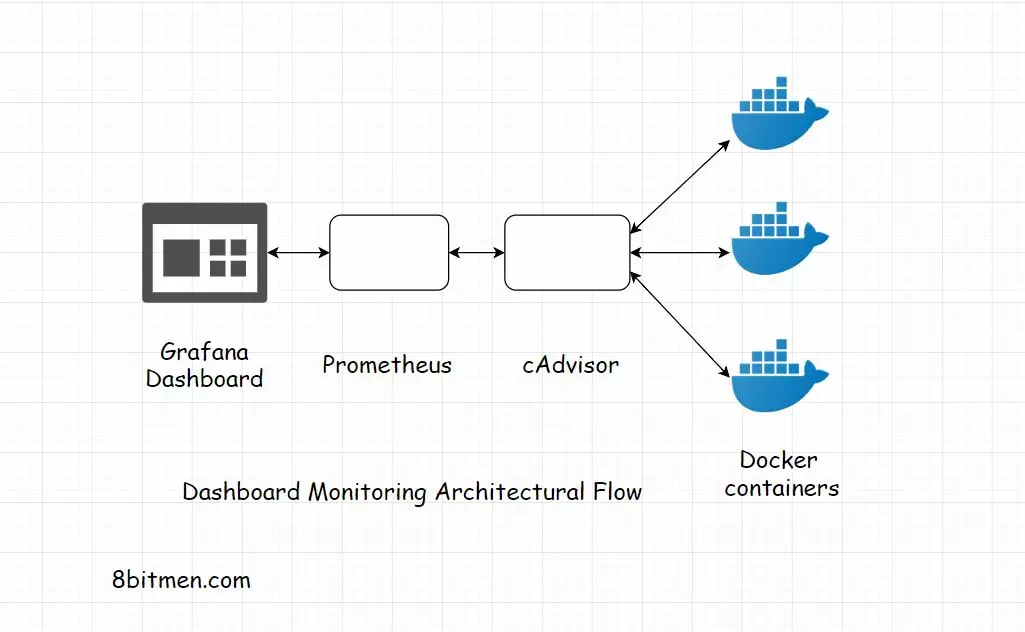
The author worked on a massive e-Comm project where we used Grafana, Prometheus & cAdvisor to set up a **dashboard monitoring system**.
- The dashboards were used to study the server instances, their uptime, exceptions, errors their contextual scenarios etc.
## 1-4. *Prometheus* + *Grafana* using dashboard to show the data
- All the data was displayed on custom *Grafana* dashboards.
- Queries were fired from the dashboard which hit *Prometheus*, which was plugged-in to *Grafana* as a data source.
Container information was [streamed into Prometheus from cAdvisor](https://prometheus.io/docs/guides/cadvisor/).
The below diagram shows the data flow between these open source tools, kind of a *Grafana*, *Prometheus*, *cAdvisor* based dashboard monitoring architectural flow.
***
## 2. How to Run cAdvisor With Docker?
> [Ref] [Quick Start: Running cAdvisor in a Docker Container](https://github.com/google/cadvisor)
>> [shows] A single cAdvisor can be run to monitor the whole machine.
Also, the tool is a static Go binary with no external dependencies. We can run it standalone if we wish to. The runtime behaviour can be controlled via [a series of flags](https://github.com/google/cadvisor/blob/master/docs/runtime_options.md).
*cAdvisor* also performs some housekeeping periodically. With these flags, we can control how & when the tool performs the task.
***
## 3. Running *cAdvisor* With *Prometheus*

> [Ref] [Services and resources monitoring with Prometheus and Grafana running on Docker](https://www.nexocode.com/blog/posts/services-and-resources-monitoring/)
就是一個數據分析 (data analytics) 和監控 (monitoring) 的組合。
- *cAdvisor* → *Prometheus* 兩者各自做了什麼事?
- *cAdvisor* exposes container statistics as *metrics*
- *Prometheus* needs to ==config *Job*== to connect with *cAdvisor*.
### *Prometheus* web-based UI
It is used to get a more comprehensive view of things.
### Other examples to practice
> - [Monitoring Docker Services with Prometheus](https://www.ctl.io/developers/blog/post/monitoring-docker-services-with-prometheus/)
> - [MONITORING DOCKER CONTAINER METRICS USING CADVISOR](https://prometheus.io/docs/guides/cadvisor/)
***
## 4. Running cAdvisor With Kubernetes by **Heapster**
Kubernetes uses a project known as **Heapster**.
- **Heapster** acts as a base monitoring platform. 也像其他的應用程式一樣在 k8s 上運行。
- **Heapster** runs in Kubernetes pods & pulls data from Kubelets.
- 它的 pod 能發現同一 cluster 下的所有 nodes.
- It collects cluster-wide monitoring & event data.
1. 然后從每一个 node 的 *kubelet* 中提取 metrics (一種度量標準)
2. 並通過 pod 和 *label* 將其聚合起来
3. 最後將其存儲到存儲系统或是監控服務中
> - [Heapster 的 API: Heapster Metric Model](https://github.com/kubernetes-retired/heapster/blob/master/docs/model.md)
> - [Heapster 中的監控數據:Metrics (with *Labels* + *InfluxDB*)](https://github.com/kubernetes-retired/heapster/blob/master/docs/storage-schema.md)

> [Ref] [k8s 监控部署](https://huanqiang.wang/2018/04/03/k8s-%E7%9B%91%E6%8E%A7%E9%83%A8%E7%BD%B2/)
***
## 5. What is Kubelet?
A Kubelet kind of manages things on the cluster.
- It manages the pods & the containers on a machine.
- It is responsible for fetching individual container usage statistics from *cAdvisor*.
- The collected data is exposed via `REST API`
- The entire data is saved in a data store such as *InfluxDB* & streamed to *Grafana* for visualization.
***
<center>**End**</center>
***
***
 Sign in with Wallet
Connect another wallet
Sign in with Wallet
Connect another wallet