# 1. Executive summary
## 1.0 Background
All major neurodegenerative diseases are characterized by substantial heritability and while recent large-scale genetic efforts have identified variants associated with disease, these often lie in non-coding, regulatory regions and cannot be linked to any functional outcomes. Recent work has repeatedly highlighted that the genetic risk for Alzheimer’s disease acts primarily via microglia - the resident macrophages of the central nervous system (Skene and Grant 2016). However, most of these variants do not directly affect protein function, instead they are suspected of influencing gene expression by altering genomic regulatory elements.
One of the main challenges is that gene regulatory mechanisms are highly cell-type specific. Genetic sequence variants which are associated with the function or activity of regulatory elements (known as quantitative trait loci or QTLs) will exert their effects in a cell-type specific manner. Mapping out molecular and regulatory QTLs comprehensively in disease-relevant cell-types would enable us to interpret functional outcomes of genetic variants on gene expression and regulation.
We propose to use these existing regulatory genomic data from peripheral immune cells to train machine learning algorithms to predict QTL-relationships, based on DNA sequence and cell-type specific epigenetic profiles. Genome-wide Association Studies (GWAS) have been conducted to statistically identify sequence variants, known as Single Nucleotide Polymorphisms (SNPs) which differ between controls and affected individuals. Millions of such variable loci have been identified, but only few are presumed to be causal QTLs.
Interpreting the effect of GWAS SNP associations is arguably the primary challenge in human disease biology at this moment. The underlying datasets have been the outcome of the most substantial investment made in biological research in history. While we are focused on understanding its impact on dementias, the impact of improving regulatory genomic predictions will affect research on all biological traits for which good genetic traits are available (approximately 2000 diseases/phenotypes). Specifically in the context of Alzheimers, it will enable us to test for genome-wide associations with particular regulatory factors (e.g. transcription factor proteins, TFs) which are directionally involved in disease. Detecting such an enrichment as a result of this challenge could give us important clues about the causality of the disease, and provide leads for drug target development.
## 1.1 Challenge overview
The goal of the analysis is to understand how the sequence of nucleotides in the DNA affects a cascade of interactions which result in a particular cellular phenotype, and how it differs across cell types. Current state-of-the-art models predict local (cis-acting) effects, usually taking a continuous fragment of DNA sequence as input, and predicting the chance that this sequence is locally bound by TFs, or that it contains epigenetic modifications. This is modelled by fitting experimentally measured DNA profiles as targets for multitask sequence classification (binary binding of each target), or regression (number of reads for each profile). As the input size to the model increases, the task is typically implemented as multichannel sequence-to-sequence prediction, with various levels of coarsening applied to the output (the experimental readings are rarely detailed to a level of single nucleotides). The response of a trained model is then analysed using a number of feature attribution methods such as mutagenesis (perturbing input to see the change in output), or integrated gradient analysis.
The sensitivity of a model is limited by its input span, and the receptive field, which for newest models (Enformer model, Avsec et al. 2021) can reach up to 100 kilobases (Kb), but is typically a few Kb from the predicted location. However, experimental QTL data shows that interactions can span much further (up to 1 mega base in our dataset), because of the way the genome is folded and compacted in the nucleus. We are interested in obtaining models which are able to predict the effects of input variation on targets located as far away as possible. Ultimately, we envision models that break the requirement of a single contiguous input sequence, and are able to predict from an arbitrary set of genome-wide interactions, learning functional 3D genome connectivity as a result.
Although genomic sequence is the primary factor for predicting binding of many TFs, a complete picture can only be obtained by analysing genetic and epigenetic data in concert. Studies show that a number of phenomena, such as chemical modifications to the DNA and histones which alter its shape and electric charge (measured by [H3K27ac](https://en.wikipedia.org/wiki/H3K27ac), [H3K4me1](https://en.wikipedia.org/wiki/H3K4me1) ChIP-seq), and downstream properties such as chromatin accessibility (measured by ATAC-seq, DNase-seq), are crucial for accurate prediction. These profiles describe the state of chromatin at given coordinates, and can be used as inputs (conditioning) or outputs (targets) for the model. If the right epigenetic signals could be used to condition model prediction alongside the sequence, it would allow for adaptation to new cell types, generalisation of knowledge to avoid costly experimentation and training, and better understanding of causal phenomena underpinning gene expression.
## 1.2 Data overview
The following data folder were provided:
- dna - one-hot encoded DNA bigWig files split by nucleotide: A, T, G, C. Used to train the model. One file per base.

- dnase - chromatin accessibilty data (dnase-seq/ATAC-seq) for all training samples.

- H3k27ac - specific chromatin mark data for training samples. Used as the training label. Mark of active enhancers.

- H3k4me1 - specific chromatin mark data for the training samples. Mark of distal enhancers.

- **(can ignore)** dnase_npy - Intermediatary file created by model_scripts/quant_norm_dnase.sh. Holds numpy objects of sampled values from the dnase data.

- dnase_qn - Quantile normalised dnase data for the training samples, created by model_scripts/quant_norm_dnase.sh

- **(can ignore)** qtl_tmp - Holds the raw, downloaded QTL data for the 3 Immune cells (CD14+ monocytes, CD16+ neutrophils, and naive CD4+ T cells). The QTL data downloaded is for SNP effect on H3K27ac and H3K4me1 separately.
- qtl - Holds the downloaded QTL data for the 3 Immune cells (CD14+ monocytes, CD16+ neutrophils, and naive CD4+ T cells). The QTL data downloaded is for SNP effect on H3K27ac and H3K4me1 separately. The data has been converted to parquet files.

- **(can ignore)** liftover - This folder holds reference files used to liftover data built on hg38 to hg19

- sldp - holds the reference files for the SLDP tool
- leopard - The average (avg.bigWig) is used within the Leopard training model to add the difference from the training cell type to the average and pass this as an input track. Leopard uses an avg.bigwig file which contains the avergae DNASE-seq values for the 13 cell lines used in training. Here we have 59 cell lines (55 from ENCODE + 4 immune cells) which is a substantially larger dataset upon which to create this average. Note that we create the average from the quantile normalised values.

For training the model, DNA sequence data and chromatin accessibility data from DNase I hypersensitive sites sequencing (DNase-seq) and Assay of Transposase Accessible Chromatin sequencing (ATAC-seq) was available.
There are 55+4 different samples (cell types) in total.
* The original data for the first 55 cell types is obtained mostly from ENCODE (Encyclopedia of DNA Elements) and curated by EpiMap.
* The data for the remaining 4 samples (immune cells) is from other sources. The additional 4 samples that are not included in the training of the baseline model but can be used to infer generalization. Data from **Mature Neutrophils, CD4+ CD16- Monocytes, CD4+ T-cells and Microglia**. No DNase-seq data is availble for Microglia and Neutrophils, instead ATAC-seq data is provided. Also note that the Neutrophils ATAC-Seq data was taken from a separate study to the rest.
#### DNA data
The DNA sequence data represents one-hot encoded DNA split by nucleotides A, T, G and C in the bigWig file format. This means that each nucleotide is encoded as a vector of all zeros except one in a specific position, A is encoded as (1,0,0,0), T as (0,0,0,1), C as (0,1,0,0), and G as (0,0,1,0). The GRCh38/hg38 assembly of the human genome was used as a reference sequence for encoding.
<details>
<summary>Background: BigWig files</summary>
> BigWig files represent an indexed binary data format and are used to represent dense, continuous data as graphs in a Genome Browser. (https://genome.ucsc.edu/goldenPath/help/bigWig.html)
>
>Ultimately, BigWig files are simply ways to represent data along a (genome) sequence in compresed form. The more verbose, human readable form of a BigWig is a wiggle file. The screenshot below gives you an idea of how the data is stored:
>
>
>
>For example, the following are equivalent:
>
>
>is equivalent to
>
> Both versions display a value of 12.5 at position 300701-300705 on chromosome 2. ([Reference](https://genome.ucsc.edu/goldenPath/help/wiggle.html))
</details>
<br>
##### Note:
Some of the DNA data seems to be unassigned (nucleotide not called)

#### Chromatin accesibility (DNase, ATAC data)
The bigwig chromatin acessibility data from ENCODE EpiMap is in 25 base pair intervals averaging the -log10 p-value track that is standard for the MACS 2.0 peak caller. There is no exact conversion to peaks, but what we have done internally is take intervals with signal above 2 (for ChromHMM for example, we average to the 200bp level and then do this). This is the recommended approach for peak calling.
The chromatin accessability data has information from two biological assays: DNase-seq and ATAC-seq whereby the majority of samples were generated from DNase-seq (n=52), only three samples originate from ATAC-seq (sample accession numbers: BSS00355,BSS00361, BSS00367).
* **NOTE** - For samples where DNase-Seq data was not available, ATAC-Seq data was used in its place. The samples in question are BSS00355, BSS00361, BSS00367, Microglia, Neutrophils. Also note that the neutrophils ATAC-Seq data was taken from a separate study to the rest.
#### Histone modification data (h4k4me1, h3k27ac)
All 55 samples have further results on the epigenetic state of the two histone marks, H3K27ac and H3K4me. H3K27ac refers to the acetylation of histone H3 at lysine residue 27 whereas H3K4me refers to the methylation of histone H3 at lysine 4. Both marks represent active enhancer marks and are characteristic for an actively transcribed region.
#### QTL data
QTL data is measured to identify SNP effects on the regulatory elements (H3K27ac, H3K4me1). The QTL files contain SNPs and their corresponding location.
column_number column_label
1 chr:pos_ref_alt
2 rsid
3 phenotypeID
4 p.value
5 beta
6 Bonferroni.p.value
7 FDR
8 alt_allele_frequency
9 std.error_of_beta
## 1.3 Main objectives
* Can epigenetics (ATAC-seq, DNase-seq) be used to define cell type?
* sampling of interactions
* graph model
* use regression instead of classification
* Visualisation of accessibility and epigenetic marks
## 1.4 Approach
In order to investigate whether epigenetics (ATAC-seq, DNase-seq) can be used to define cell type, we trained and compared four different models.
Model A was trained on DNA sequence data from three immune cell lines (Monocytes, T-cells and Neutrophils). Chromosomes 1, 8 and 21 were held out during training for validation purposes.
As for model architecture, model A used the default U-Net from Leopard. The output of the model are six tracks: for each of the three cell types the two epigenetic marks H3K27ac and H3K4me1 are predicted.
In addition to sequence data, Model B takes as input also DNA accessibility data as determined through DNAase-seq and ATAC-seq experiments. Thus, this model takes six input tracks (A, T, C, G, DNase, DNase_avg) and outputs two tracks for the epigenetic marks H3K27ac and H3Kme1.
To assess the performance of model A and model B precision-recall-curves were used.
Two further models were trained that are a mix of model A and model B. Model C takes as input sequence and accessibility data (same as model B) and outputs six tracks for epigentic marks of each cell type (model A).
Purpose: See how adding accessibility influences prediction of A.
Model D takes in DNA sequence data only (same as A) and output:s 2 tracks for the epigenetic marks (same as model B).
Purpose: validate that there is a drop in performance when no cell-type conditioning is given. The only way this should work well is if there’s no difference between cell types.
## 1.5 Main conclusions
## 1.6 Limitations
### Unassigned nucleotides in DNA sequence
TODO
### Mixing DNase and ATAC data
In the report we should discuss the differences beetween DNase and ATAC profile data. In our analysis we mix them (see note above). Figure taken from [Tsompana et al., Chromatin accessibility: a window into the genome. Epigenet Chromatin 7, 33 (2014)](https://epigeneticsandchromatin.biomedcentral.com/articles/10.1186/1756-8935-7-33).

Fortunately, DNase and ATAC data are at least highly correlated (~0.8+ correlation, ask @Alan) for the reference.
<!------>
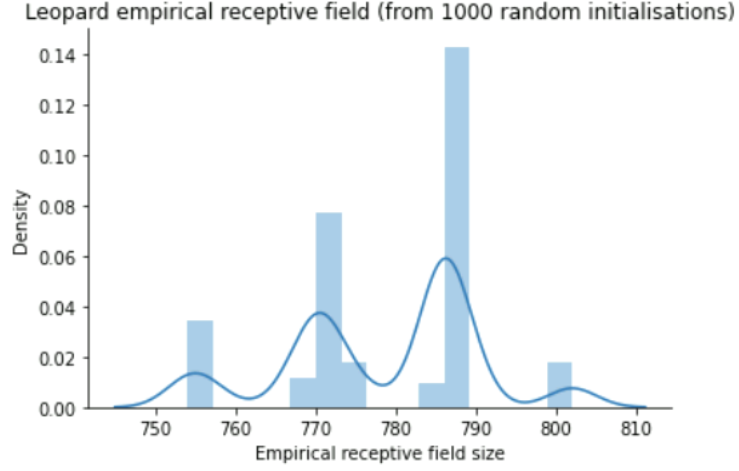
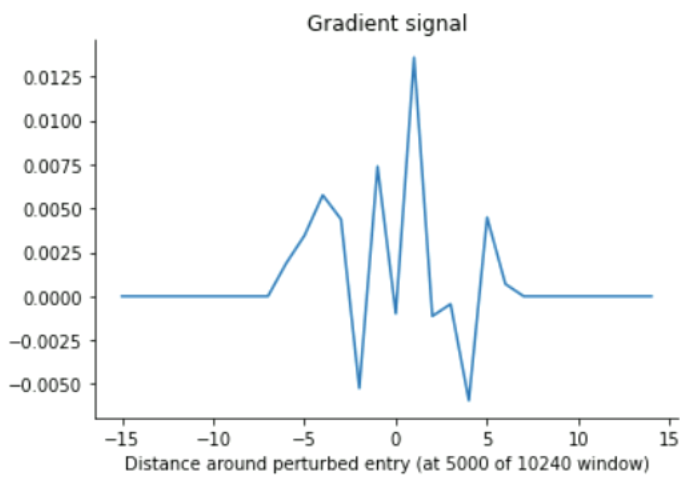
### Leopard (empirical) receptive field
It's typically around 754-802 for an untrained Leopard model. I did 1000 random evaluations, so the size 802 should come pretty close to the actual max receptive field of Leopard. After training it could easily be smaller (but we can test with trained models tomorrow)
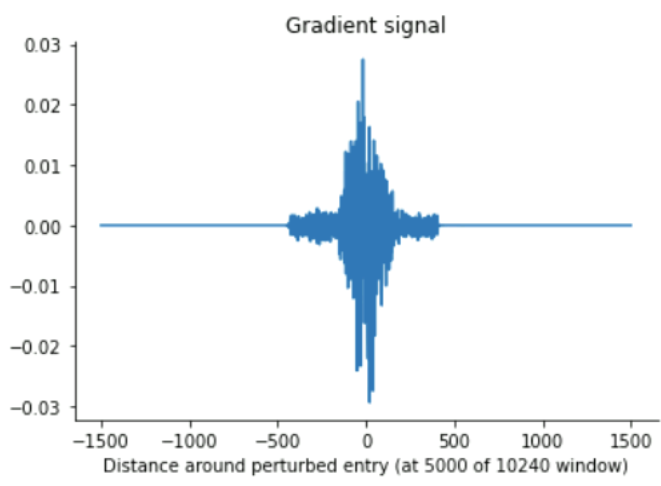
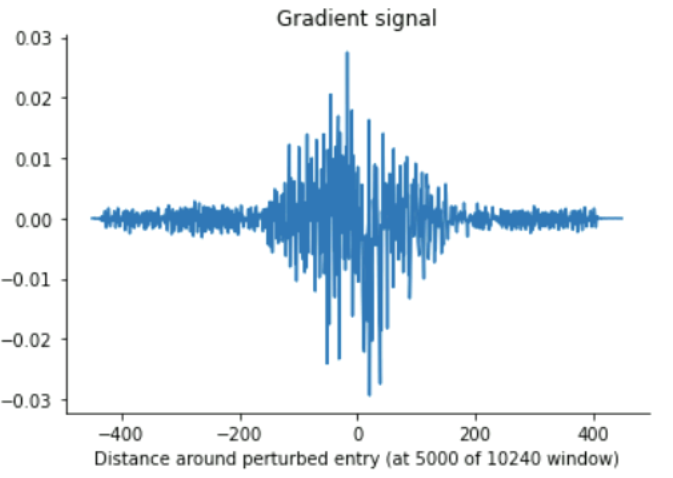
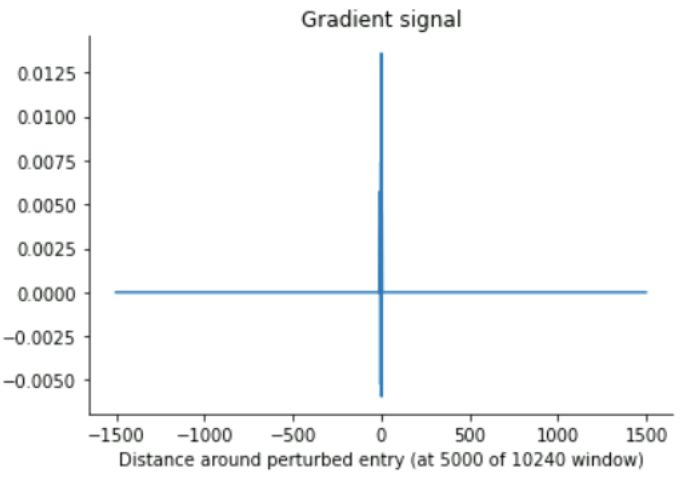
The gradient tape analysis, yielded consistent results with a maximal receptive field of up to ~840 (for extremely high input values), and more around the mid-10s for low input values around 0 (which ours mostly are, presumably)
Gradient tape (large vectors)
Gradient tape (small vectors)
### Randomly sampling in Leopard training
## 1.7 Recommendations and future work
### Carbon emissions statement
We can calculate our carbon emissions with the help of this: https://mlco2.github.io/impact/
# 2. Data overview
We should touch upon the different types of data here:
* DNA sequence data
* Chromatin accessibility data
* DNase
* ATAC-seq
* QTL data
## 2.1 Dataset description
## 2.2 Data quality issues
## 2.3 Data summary
# 3. Data visualisation
## 3. Relationship between epigenetic marks and ATAC on representative peaks
**Background**:
The raw values in ChIP-Seq and DNA accessibility datasets are fold change enrichment values, which are the ratio of counts of a target sample to the input in the case of input avalibility or to the sample itself in the case of the absence of the input [ENCODE Datasets](https://https://doi.org/10.1186/s13072-020-00342-y).
The knowledge about the distribution of the sequenced fragments of ChIP-Seq and DNA accessibility will contribute to the characterization of the type of the loss function for a potential regression model. To address the above mentioned point we applied distribution and probability analyses and conducted research to chracterize the distribution overlap between the two dataset types (i.e., DNA accessibility and ChIP-Seq).
**Data:**
Below is an example for the neutrophil data after being analysed by DeepTools.

**Approach:**
Data processing: Bigwig files and Bed files generated from these bigwig files.
Tools: DeepTools and python packages(Jupyter notebooks on Github).
- DeepTools - used the multiBigwigSummary tool to compute the average scores in the BigWig files in every genomic regions for selected regions of the genome.
**Results:**
***1. Distribution***
Neutrophil dnase distribution biased towards ~0 with 500,000 counts as a sharp drop off can be observed? vs monocytes with ~250,000 counts for ~0 and microglia with ~300,000 for ~0
Our results indicate the need for the Poisson distribution analysis, which is a discrete distribution that measures the probability of a given value of events happening in a specified time period.
| 
:-------------------------:|:-------------------------:
|
***2. Poisson distribution analysis***
The Poisson distribution analysis provides the distribution and frequency outcome, indicating differences in the distribution of DNA accessibility and ChIP-Seq data between the cell lines (example shown are for monocyte and neutrophil datasets).


The Poisson based analysis performed on immune cells (except T cells) indicated that overdispersion exist. The Poisson model summary for monocyte and neutrophil are the two examples shown here.
*The Poisson model summary for the monocytes*.

*The Poisson model summary for the monocytes*.

The monocyte shows an overdispersion aproximation of 31.76 based on the acetylation marker. While neutrophil shows the an overdispersion aproximation of 24.76 according to the same marker. These suggest that the coefficient estimates should not be interpreted directly.
Finally, we were interested in understanding the extent of DNA accessibility and ChIP-Seq (epigenetic marker) peak overlaps. From the analysis, we observed an an interesting width of overlap between these datasets. The examples depicted in this report include the peak overlaps for the monocyte and neutrophil datasets.
*The peak overlaps*

**Issues:**
- Running DeepTools on CD4T data on limited CPU.
- Microglia missing 4me data.
# 4. Experiments
# 5. Future work and research avenues
# 6. Team members
* Mike Phuycharoen
* Alan Murphy
* Melania Abraham
* Trang Dinh
* Sukanya Mandal
* Simon Mathis
* Christina Morgenstern
* Srijit Seal
* Prachi Sharma
* Sethuraman T V
* Hanz Tantiangco
* Umran Yaman
# 7. References
Avsec et al. 2021. “Effective gene expression prediction from sequence by integrating long-range interactions” bioRxiv 2021.04.07.438649; doi: https://doi.org/10.1101/2021.04.07.438649
Skene, N. G., and S. G. N. Grant. 2016. “Identification of Vulnerable Cell Types in Major Brain Disorders Using Single Cell Transcriptomes and Expression Weighted Cell Type Enrichment.” Frontiers in Neuroscience. https://www.frontiersin.org/articles/10.3389/fnins.2016.00016
 Sign in with Wallet


