# R-Ladies Freiburg: Tidy Tuesdays Online 21.07.2020
This is an online space for members and guests of R-Ladies Freiburg to exchange Tidy Tuesday ideas and results during our online meetups.
## What is Tidy Tuesday?
TidyTuesday is an iniative from the [R for Data Science](https://r4ds.had.co.nz) community and focuses on data wrangling and plotting, but can also be used to practice modeling and just about anything else. Many participants choose to share their resulting graphs on [Twitter](https://twitter.com/hashtag/tidytuesday?lang=en) and/or their code in a [Github repository](https://github.com/kyla-mcconnell/tidy-tuesday).
## Data
Source: https://github.com/rfordatascience/tidytuesday
Select the week you want to work with, and copy and paste the readr command, which will load the dataset directly from a Github link (no downloads required)
## Where do I start?
- Read the ReadMe file of the dataset you're interested in using -- this often links to relevant articles!
- Narrow it down! Select only 2 or 3 columns of a dataset and start there.
- Think about data types (i.e. how can I plot a continuous variable like speed against a categorical data like car model?)
- Do you expect a certain variable to be related with another?
- Can you imagine a certain visualization given the variables?
- Start by exploring -- make several quick and dirty graphs (if your ggplot skills allow for this!) and decide which is the most interesting, then try to refine that one!
- Check out past Twitter entries on [this Shiny server](https://nsgrantham.shinyapps.io/tidytuesdayrocks/?_ga=2.50665705.195055622.1591790935-834839152.1591790935) to see what others have done (past datasets only)
- Watch live coding on Youtube from one of the previous datasets, i.e. machine learning with tidymodels with Julia Silge of RStudio
- Start with a topic you want to learn (i.e. sentiment analysis of text, interactive maps) and look for a dataset that could be used for that
## Ideas
- [Week 23: African American History](https://github.com/rfordatascience/tidytuesday/blob/master/data/2020/2020-06-16/readme.md)
- Ages, genders and countries of freed slaves
- Map data of ship routes
- [Week 22: African American Achievements](https://github.com/rfordatascience/tidytuesday/blob/master/data/2020/2020-06-09/readme.md)
- Timeline of (highlighted) achievements by Black women
- [Week 22: Marble Races](https://github.com/rfordatascience/tidytuesday/blob/master/data/2020/2020-06-02/readme.md)
- ?
- [Week 22: Cocktails](https://github.com/rfordatascience/tidytuesday/blob/master/data/2020/2020-05-26/readme.md)
- Shiny dashboard where you enter which alcohol types you have at home and are suggested a random cocktail to make
- [Week 21: Beach Volleyball](https://github.com/rfordatascience/tidytuesday/blob/master/data/2020/2020-05-19/readme.md)
- Bar chart of number of wins by country
- [Week 20: Volcanic Erruptions](https://github.com/rfordatascience/tidytuesday/blob/master/data/2020/2020-05-12/readme.md)
- Map marked for location of erruptions in the past 50 years
- [Week 19: Animal Crossing](https://github.com/rfordatascience/tidytuesday/blob/master/data/2020/2020-05-05/readme.md)
- Bar chart of # of characters by species, colored by character gender
- Sentiment analysis of game reviews by rating
## Status & Results: 21.07.2020
### NAME - TEMPLATE
Status:
- [x] Thinking of idea
- [x] Wrangling data into appropriate format
- [ ] Working on basic code for the graph
- [ ] Refining graph with colors / extras
Goal/Idea:
Results (or in-process code):
```{r}
test <- 3
test
```

[Full code on Github](github link if you have one)
### Alena
Status:
- Wrangling data into appropriate format (animal_outcomes)
Goal/Idea:
The data are inthe wide format, so I'll first convert it to the narrow format
Results (or in-process code):
```{r}
animal_outcomes <- read_csv('https://raw.githubusercontent.com/rfordatascience/tidytuesday/master/data/2020/2020-07-21/animal_outcomes.csv')
```
converting to long
```{r}
animal_outcomes %>% gather(state, animals, ACT:WA) -> animal_long
```
cats_dogs %>%
ggplot(aes(x= year, y = animals, fill = outcome)) +
geom_bar(stat="identity") +
facet_grid(.~ animal_type) +
theme_minimal()

[Full code on Github](github link if you have one)
### Julia
Status:
- [x] Thinking of idea
- [X] Wrangling data into appropriate format
- [X] Working on basic code for the graph
- [ ] Refining graph with colors / extras
Goal/Idea: Use the coffee data from a few weeks ago to learn how to make ridgeline plots with ggridges
Results (or in-process code):
```{r}
test <- 3
test
```
### Kyla
Status:
- [x] Thinking of idea
- [x] Wrangling data into appropriate format
- [ ] Working on basic code for the graph
- [ ] Refining graph with colors / extras
Goal/Idea: Simple bar chart with animal data (not much time today!) ~~Neural net predicting rating giving other stats: aroma, uniformity, etc. (Probably will run out of time...)~~
Results (or in-process code):
```{r}
test <- 3
test
```
### Kaustav
Status:
- [x] Thinking of idea
- [ ] Wrangling data into appropriate format
- [ ] Working on basic code for the graph
- [ ] Refining graph with colors / extras
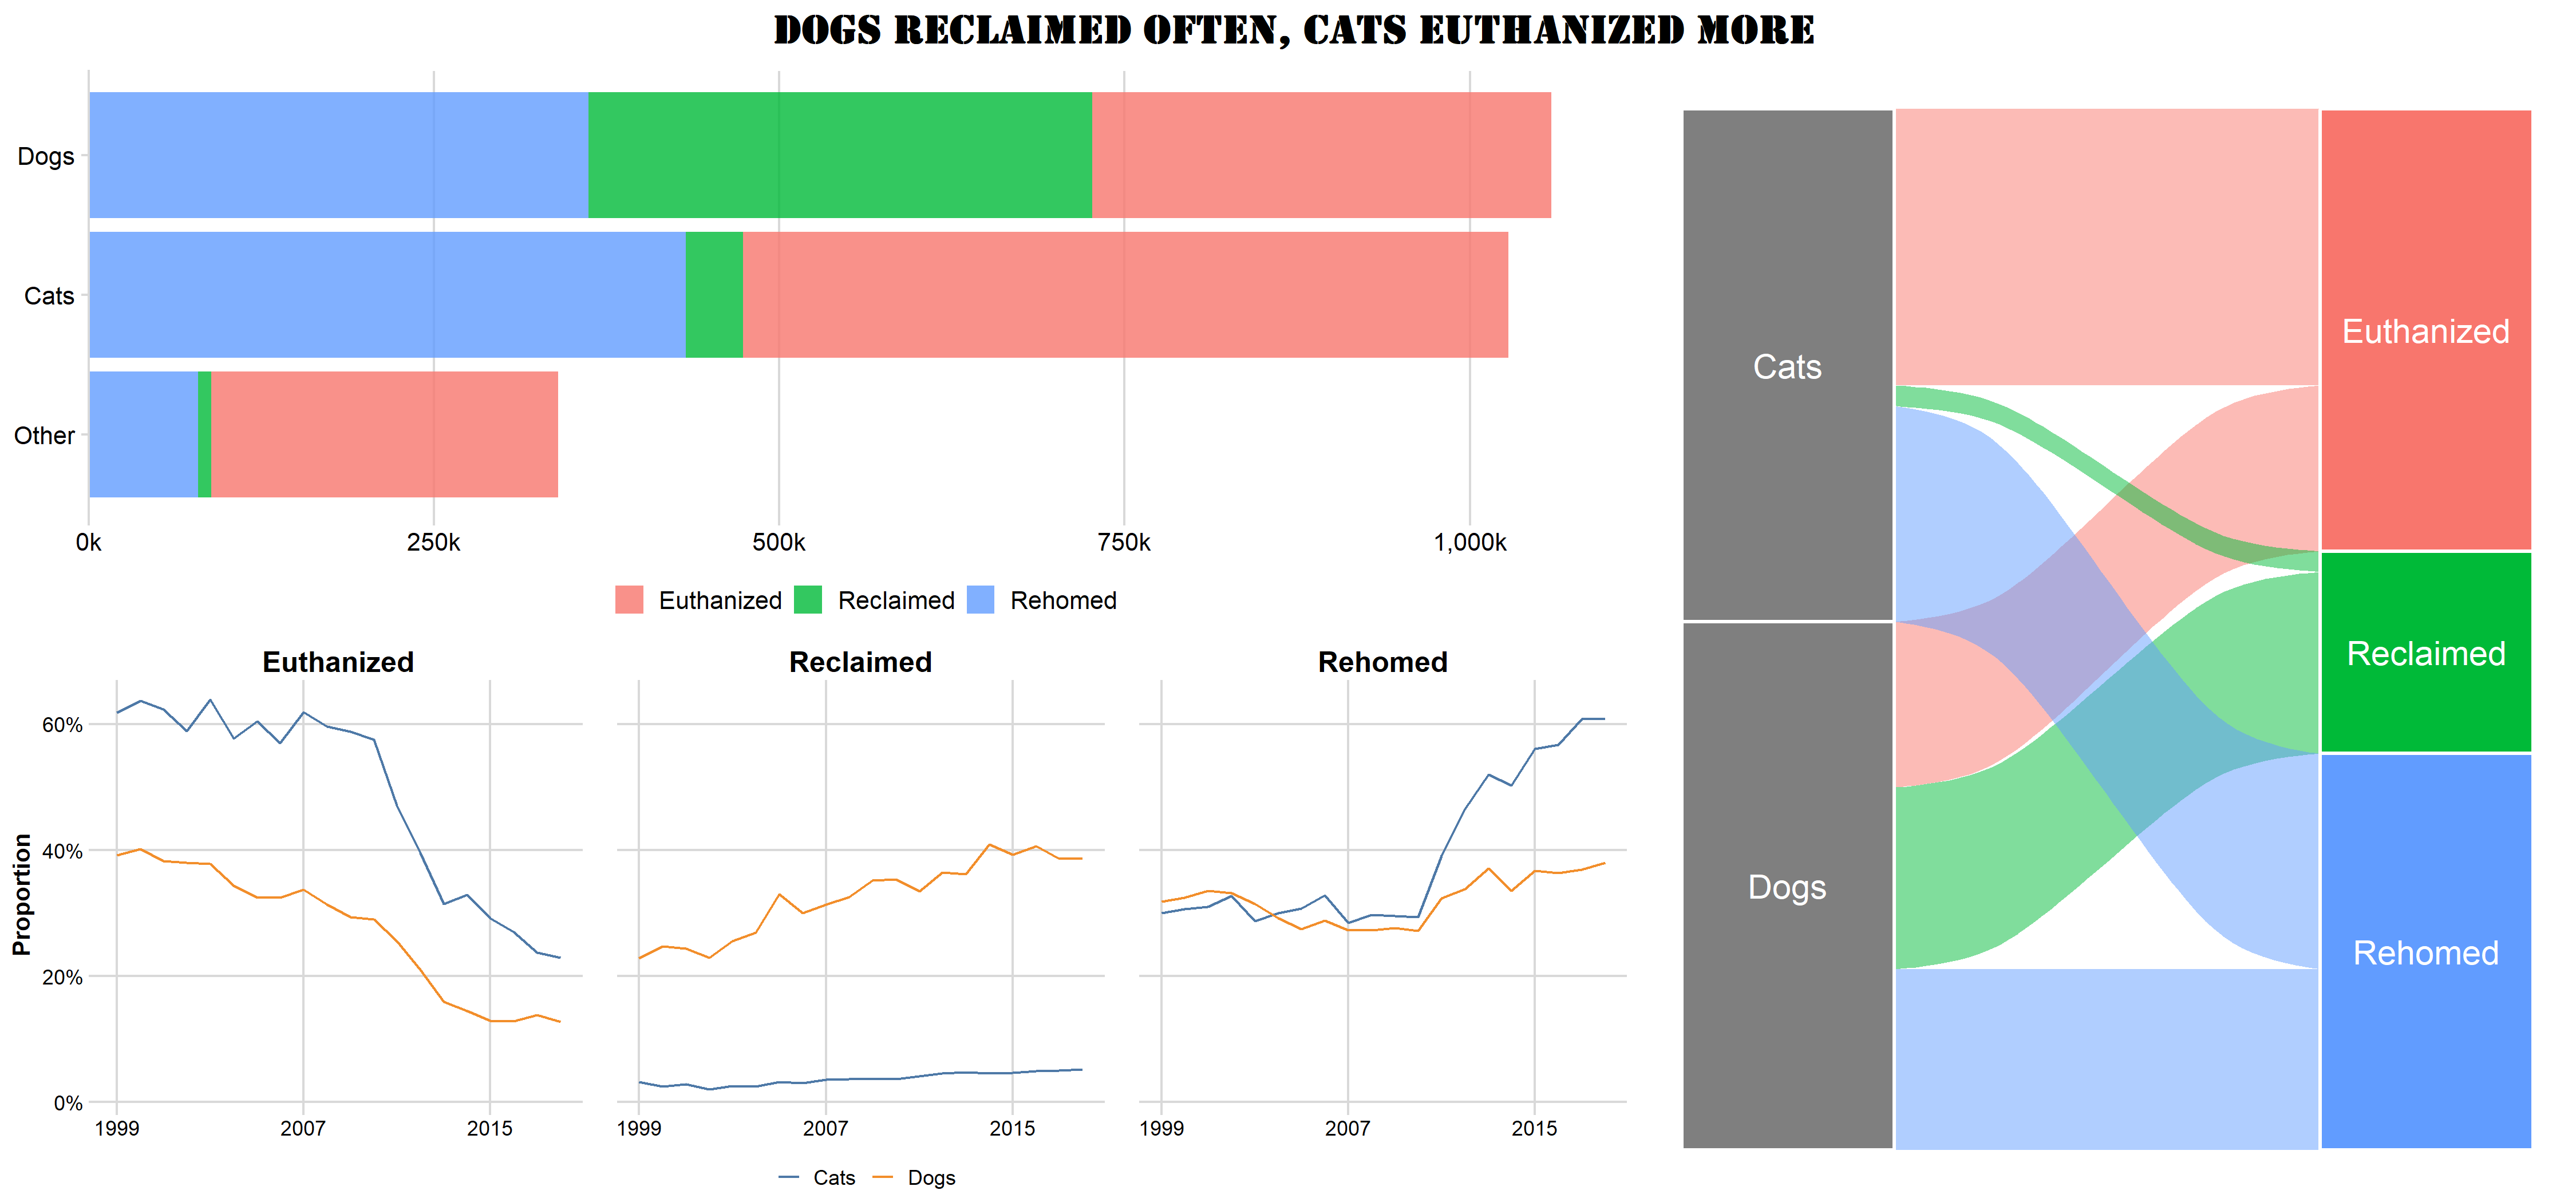
Goal/Idea: Prepare a alluvial plot using the Animal Shelter data
An alluvial diagram (still work in progress)
Results (or in-process code):
```{r}
test <- 3
test
```
### Manasi
Status:
- [x] Thinking of idea
- [x] Wrangling data into appropriate format
- [X] Working on basic code for the graph
- [ ] Refining graph with colors / extras
Goal/Idea: Prepare a alluvial plot using the Animal Shelter data
Results (or in-process code):
```{r}
test <- 3
test
```
Quick check on the data (missing values, totals etc.)
```{r}
tuesdata <- tidytuesdayR::tt_load(2020, week = 30)
tuesdata
animal_outcomes <- tuesdata$animal_outcomes
animal_outcomes_test <- animal_outcomes %>%
rowwise() %>%
mutate(total_calc = sum(across(.cols = ACT:WA), na.rm = TRUE),
check = Total - total_calc)
animal_outcomes_test %>%
anti_join(temp)
```

[Full code on Github](github link if you have one)
### Divya
Status:
- [x] Thinking of idea
- [x] Wrangling data into appropriate format
- [x] Working on basic code for the graph
- [ ] Refining graph with colors / extras
Goal/Idea: Make a gif across years, for animal complaints

[Full code on Github](github link if you have one)
 Sign in with Wallet


