# Graphviz
Graphviz 是一個命令列軟體,可以讀取具有 dot 語法的文檔,生成流程圖之類的圖檔,並在各種常見的科學報告文檔格式(如 LaTeX、Rmarkdown、Jupyter notebook)內都有相關外掛或內建功能可以整合使用。
[TOC]
## Install & Documentation
- Install: https://www.graphviz.org/download/
- Documentation: https://www.graphviz.org/documentation/
中文教學
- http://icodeit.org/2015/11/using-graphviz-drawing/
- https://www.netadmin.com.tw/netadmin/zh-tw/technology/122966CB664D4A17ABAAD11FC2AA887C
## Basic Grammar
```
digraph _graph_name_ {
# 設定 (其實沒有順序,這整個文檔每行亂調輸出都一樣)
rankdir=LR; # 順序由左至右(上下是"TD")
graph [fontname="DFKai-SB"]; # 此三行是設定字型
node [fontname="DFKai-SB"]; # 中文務必指定
edge [fontname="DFKai-SB"]; # 不然可能會出現亂碼
# 這邊是 graph (圖面)
label="我是標題";
{rank=same A B C } # 同層(強迫上下)
{rank=same F G H } # 同層(強迫上下)
{rank=same D E } # 同層(強迫上下)
# 這邊是 node (節點)
A[label = "我是開始"]
B[label = "label\n是文字", shape=box]
C[label = "shape\n指定形狀\n(這是box)", shape=box]
D[shape=box] # 不給 label 就會直接用名稱
E[label = "diamond\n菱形", shape=diamond]
F[label = "\\n\n會換行", shape=box]
G[label = "$mathmode$\n要用LaTeX處理", shape=diamond]
H[label = "我是結束"]
# 這邊是 edge (邊)
A->B->C->D->E # 可以一直連
E->C [label="否"]
E->F [label="是"]
F->G
G->B [label="是"]
G->H [label="否"]
}
```
```graphviz
digraph _graph_name_ {
# 設定 (其實沒有順序,這整個文檔每行亂調輸出都一樣)
rankdir=LR; # 順序由左至右(上下是"TD")
graph [fontname="DFKai-SB"]; # 此三行是設定字型
node [fontname="DFKai-SB"]; # 中文務必指定
edge [fontname="DFKai-SB"]; # 不然可能會出現亂碼
# 這邊是 graph (圖面)
label="我是標題";
{rank=same A B C } # 同層(強迫上下)
{rank=same F G H } # 同層(強迫上下)
{rank=same D E } # 同層(強迫上下)
# 這邊是 node (節點)
A[label = "我是開始"]
B[label = "label\n是文字", shape=box]
C[label = "shape\n指定形狀\n(這是box)", shape=box]
D[shape=box] # 不給 label 就會直接用名稱
E[label = "diamond\n菱形", shape=diamond]
F[label = "\\n\n會換行", shape=box]
G[label = "$mathmode$\n要用LaTeX處理", shape=diamond]
H[label = "我是結束"]
# 這邊是 edge (邊)
A->B->C->D->E # 可以一直連
E->C [label="否"]
E->F [label="是"]
F->G
G->B [label="是"]
G->H [label="否"]
}
```
## Command
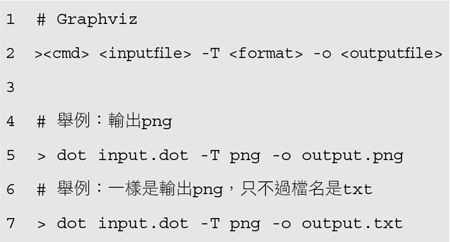
| `<cmd>` | 用於 | 例子 |
| ----------- | ------------------------------------------------ | -------------------------------------------------- |
| `dot` | 有向圖(分層地畫) | 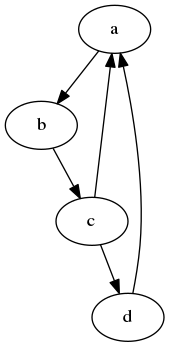 |
| `neato` | 無向圖(基於彈簧模型) | 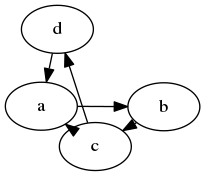 |
| `twopi` | 星形圖(結點中心放到同心的一系列圓上,包括圓心) |  |
| `circo` | 環狀的圖 |  |
| `fdp` | 無向圖(基於力) |  |
| `patchwork` | 方形樹 |  |
## Gallery
- GraphViz Pocket Reference: https://graphs.grevian.org/example
- graphviz.org: https://www.graphviz.org/gallery/
## Using Graphviz
### LaTeX
Need compiled with the additional option `--shell-escape`.
- sample 1: `graphviz`
```tex
% in preamble
\usepackage[utf8]{inputenc} % If use utf-8
\usepackage[pdf]{graphviz}
% in document
\digraph{abc}{
rankdir=LR;
a -> b -> c;
}
```
- sample 2: `dot2texi` + `tikz`
```tex
% in preamble
\usepackage[utf8]{inputenc} % If use utf-8
\usepackage[autosize]{dot2texi}
\usepackage{tikz}
\usetikzlibrary{shapes,arrows}
% in document
\begin{dot2tex}[neato,mathmode]
digraph {
...
}
\end{dot2tex}
% or
\begin{tikzpicture}[]
\begin{dot2tex}[]
digraph {
...
}
\end{dot2tex}
\end{tikzpicture}
```
### R/Rmarkdown
Use [`DiagrammeR::grViz`](https://rich-iannone.github.io/DiagrammeR/io.html) function in `DiagrammeR` package:
```R
DiagrammeR::grViz("
digraph {
...
}
")
```
Also this function can read graphviz file from file path:
```clike
DiagrammeR::grViz("images/graph.gv")
```
In Rmarkdown:
```markdown
```{R, echo = FALSE}
DiagrammeR::grViz("
digraph {
...
}
")
```
```
### Python/Jupyter notebook
Use [`graphviz`](https://graphviz.readthedocs.io/en/stable/manual.html) package
```python
# $ pip install graphviz
from graphviz import Digraph
dot = Digraph(comment='The Round Table')
dot.node('A', 'King Arthur')
dot.node('B', 'Sir Bedevere the Wise')
dot.node('L', 'Sir Lancelot the Brave')
dot.edges(['AB', 'AL'])
dot.edge('B', 'L', constraint='false')
print(dot.source)
# save the source code and render it
dot.render('test-output/round-table.gv', view=True)
```
### VSCode
- Read graphviz file: [Graphviz Preview](https://marketplace.visualstudio.com/items?itemName=EFanZh.graphviz-preview)
- Use graphviz in markdown: [Graphviz Markdown Preview](https://marketplace.visualstudio.com/items?itemName=geeklearningio.graphviz-markdown-preview)