Machine Status Monitoring
As a part of Seeker Project, we are releaseing (and will keep maintaining) a new dataset. This is one of few datasets publicly available on Machine status monitoring. As a part of deploying Seeker on real world, we tested Seeker on 4 different predictive maintenance datasets.
Dataset is [here](https://drive.google.com/drive/folders/1IX2CJlGeziWbsZ6oBdZQTZcd78KAhUgR?usp=sharing) and includes the Griding and Machine Status monitoring.
1. [Bearing Fault Dataset](https://engineering.case.edu/bearingdatacenter)
+ A popular public dataset for bearing fault detection
+ Analysis available in the paper
2. [TOOL WEAR DATASET OF NUAA_IDEAHOUSE](https://ieee-dataport.org/open-access/tool-wear-dataset-nuaaideahouse#)
+ Another publicly available dataset for tool wear prediction. It has it's own README files about the dataformat.
+ The data is noisy and the results using this dataset was not encouraging (for classification/ regression model development)
3. [A Griding Data Set](https://drive.google.com/drive/folders/1IX2CJlGeziWbsZ6oBdZQTZcd78KAhUgR?usp=sharing)
+ Predicting the surface finish of a griding job from the statistical data using random forest
+ The code and implementation was taken from "[An Efficient Edge-Cloud Partitioning of Random Forests for Distributed Sensor Networks](https://ieeexplore.ieee.org/abstract/document/9931595)"
4. [Machine Status Monitoring Dataset](https://drive.google.com/drive/folders/1IX2CJlGeziWbsZ6oBdZQTZcd78KAhUgR?usp=sharing)
+ Our own dataset developed from mounting sensors at two different positions on a [bridgeport machine](https://en.wikipedia.org/wiki/Bridgeport_(machine_tool_brand))
+ Desciption of the dataset and organization is given below.
## Machine Status Monitoring Dataset
The machine status monitoring dataset is first of a kind dataset where we mounted multiple sensors (of differen types) on multiple locations of a Bridgeport machine to monitor its activity status[^1]. Our goal is to develop a publicly available machine status monitoring data with multiple machines to promote wide research in the filed of predictive maintenance and Industry 4.0. Typically indistial sensor data, especially for manufacturing industries, are closesly guarded, for competitive purposes, as they represent signatures of the production/ efficiency of the manufacturing industry. However, most of these manufacturing industries typically run with the help of fundamental machines such as motors, pumps etc. These simpler machines often lack the ability to perform any sensing and data anlytics and with the help of Seeker, we are planning to bring intelligence into them by retrofitting these machines with EH-Sensors and perfoming in-house analytics.
[^1]: This is a live dataset and will keep on updating with new data every month.
**Data Arrangement:**
+ Each directory in the top level indicates the machine ID and the sampling Frequency, e.g. M1-100Hz signifies Machine-1 with Sensor 100Hz
+ The level-2 directories symbolizes the sensors in different positions. For now we have 2 different types (100Hz & 200Hz) of sensoes at 3 different positions (6 combinations). P1, P2, P3 are fundamentally 3 sensors positioned along X Y and Z axis (although they all are tri-axis).
+ The level-3 directories are named as MachinID-StatusID-PositionID. That means a directory named M1-S1-P1 is a sensor on positioned at Position-1 on Machine-1 operating with a StatusID-1.
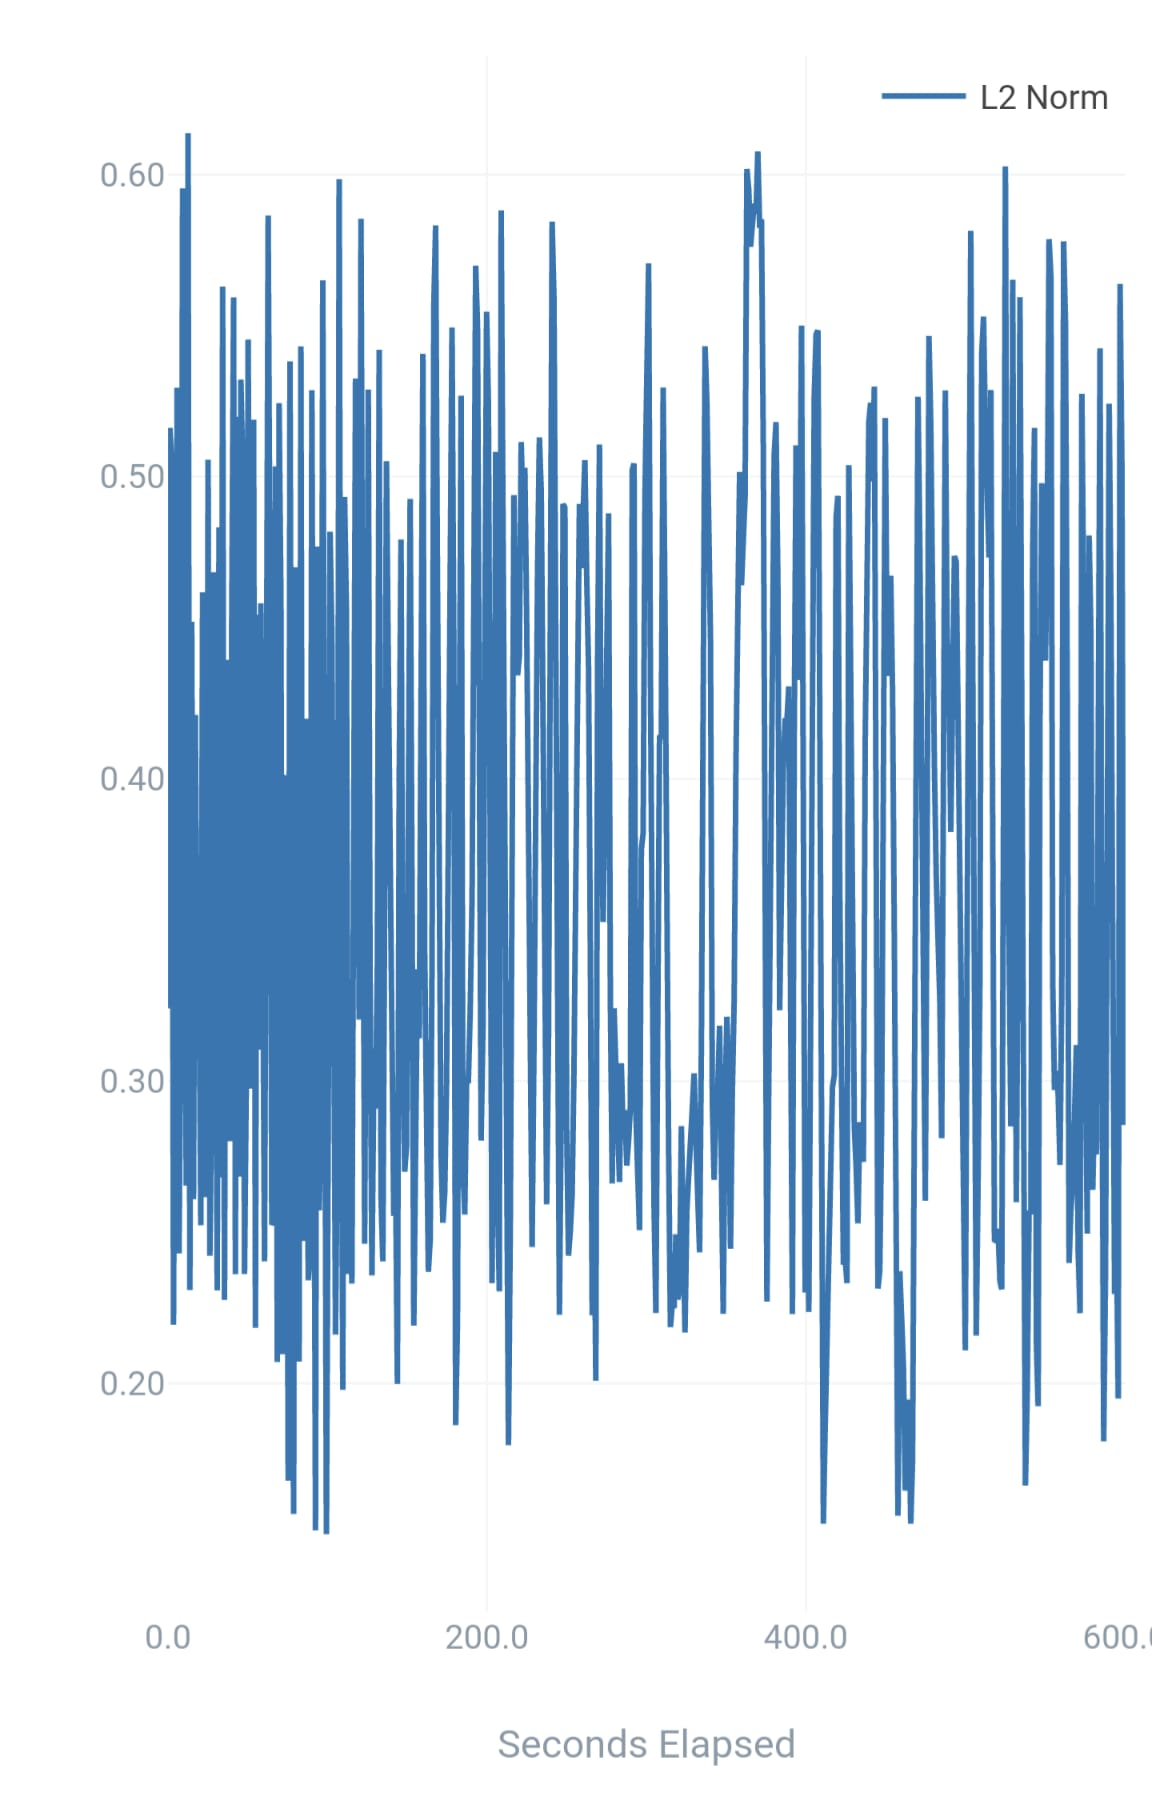
+ The level 4 is the actual data with Raw accelerometer data (uncallibrated), True Accelerometer Data (Calibrated), Total Accleration Data (including g components). The Annotations are empty now. It can be filled with the Status ID for ease of training the model.
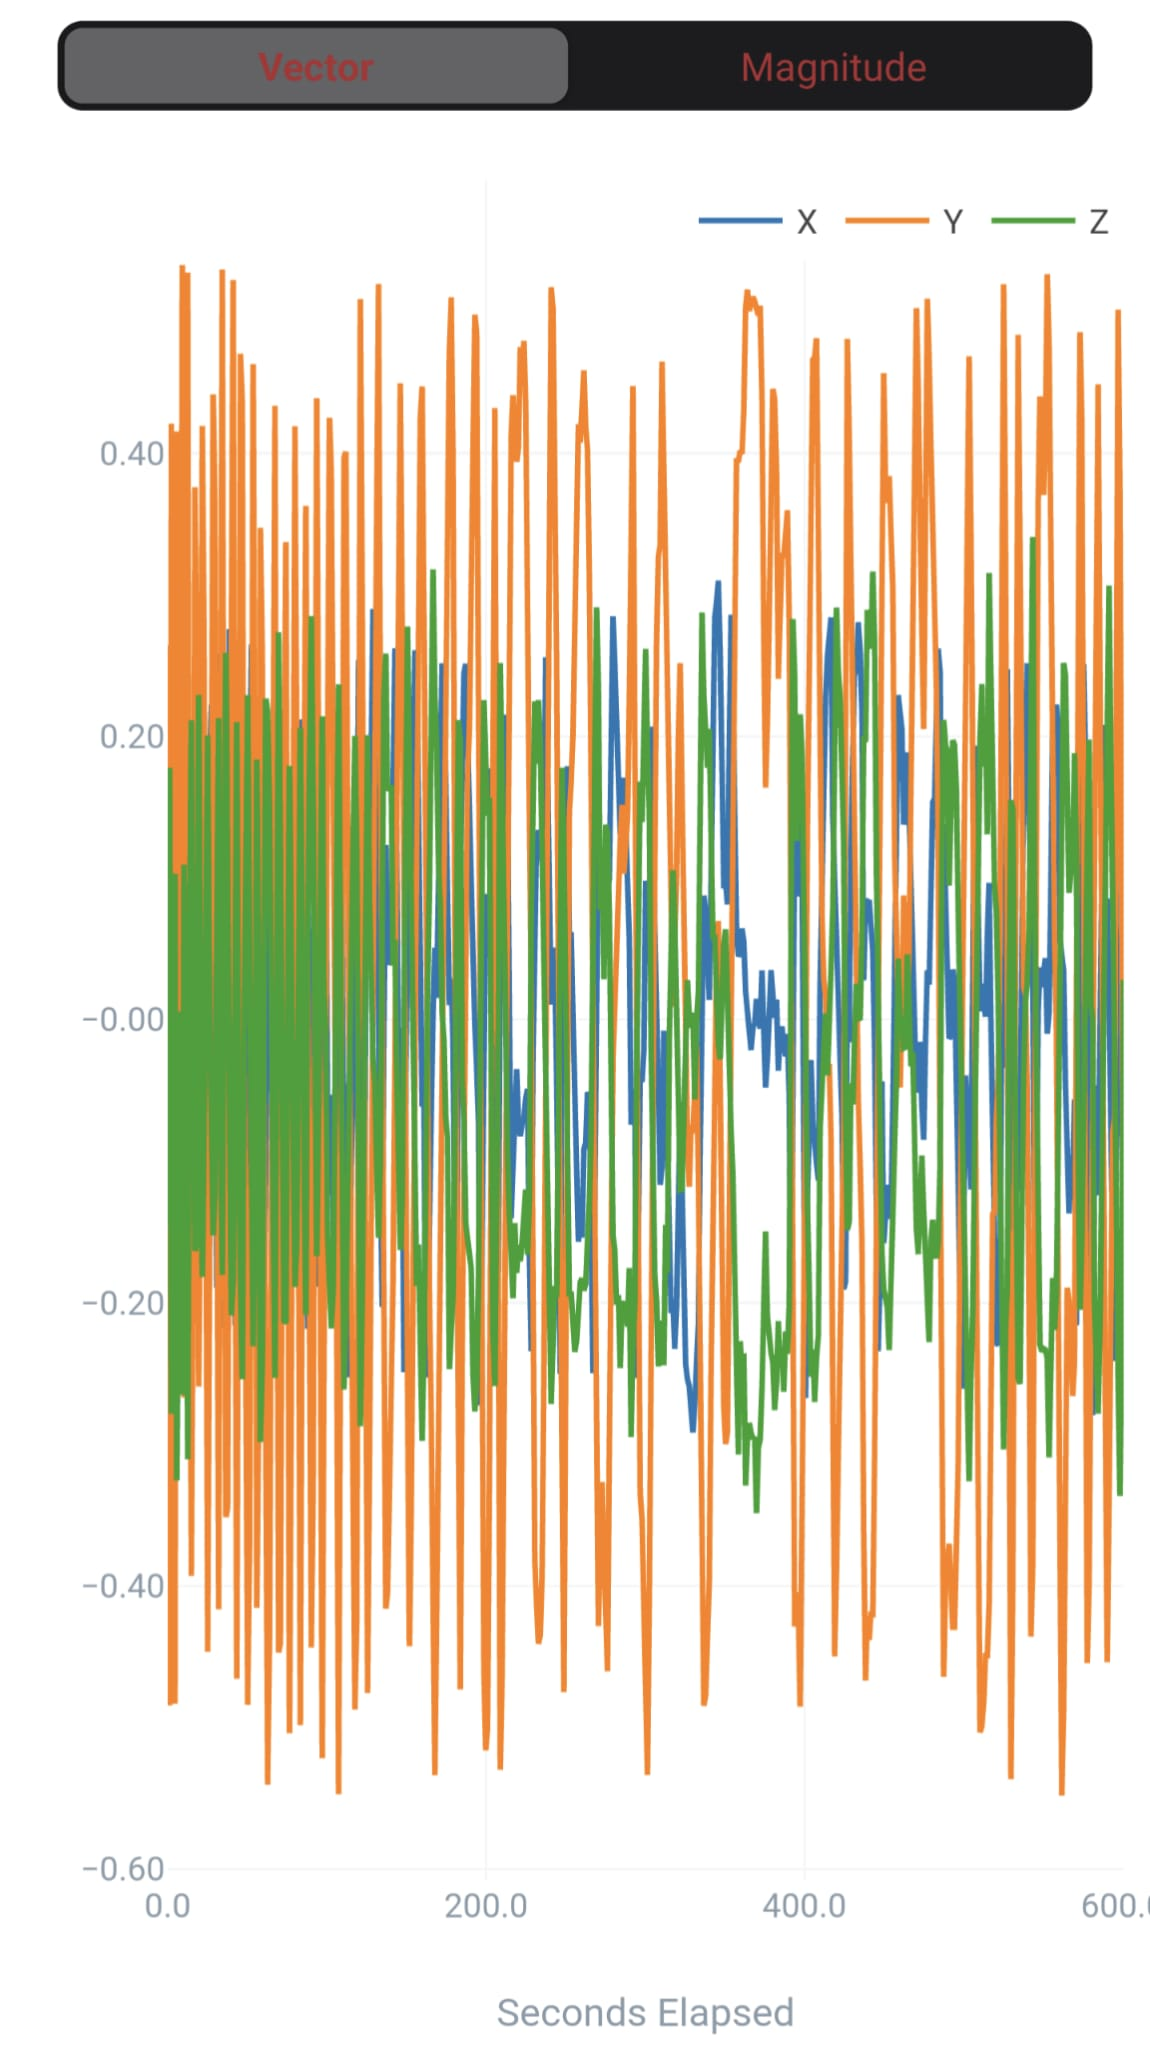
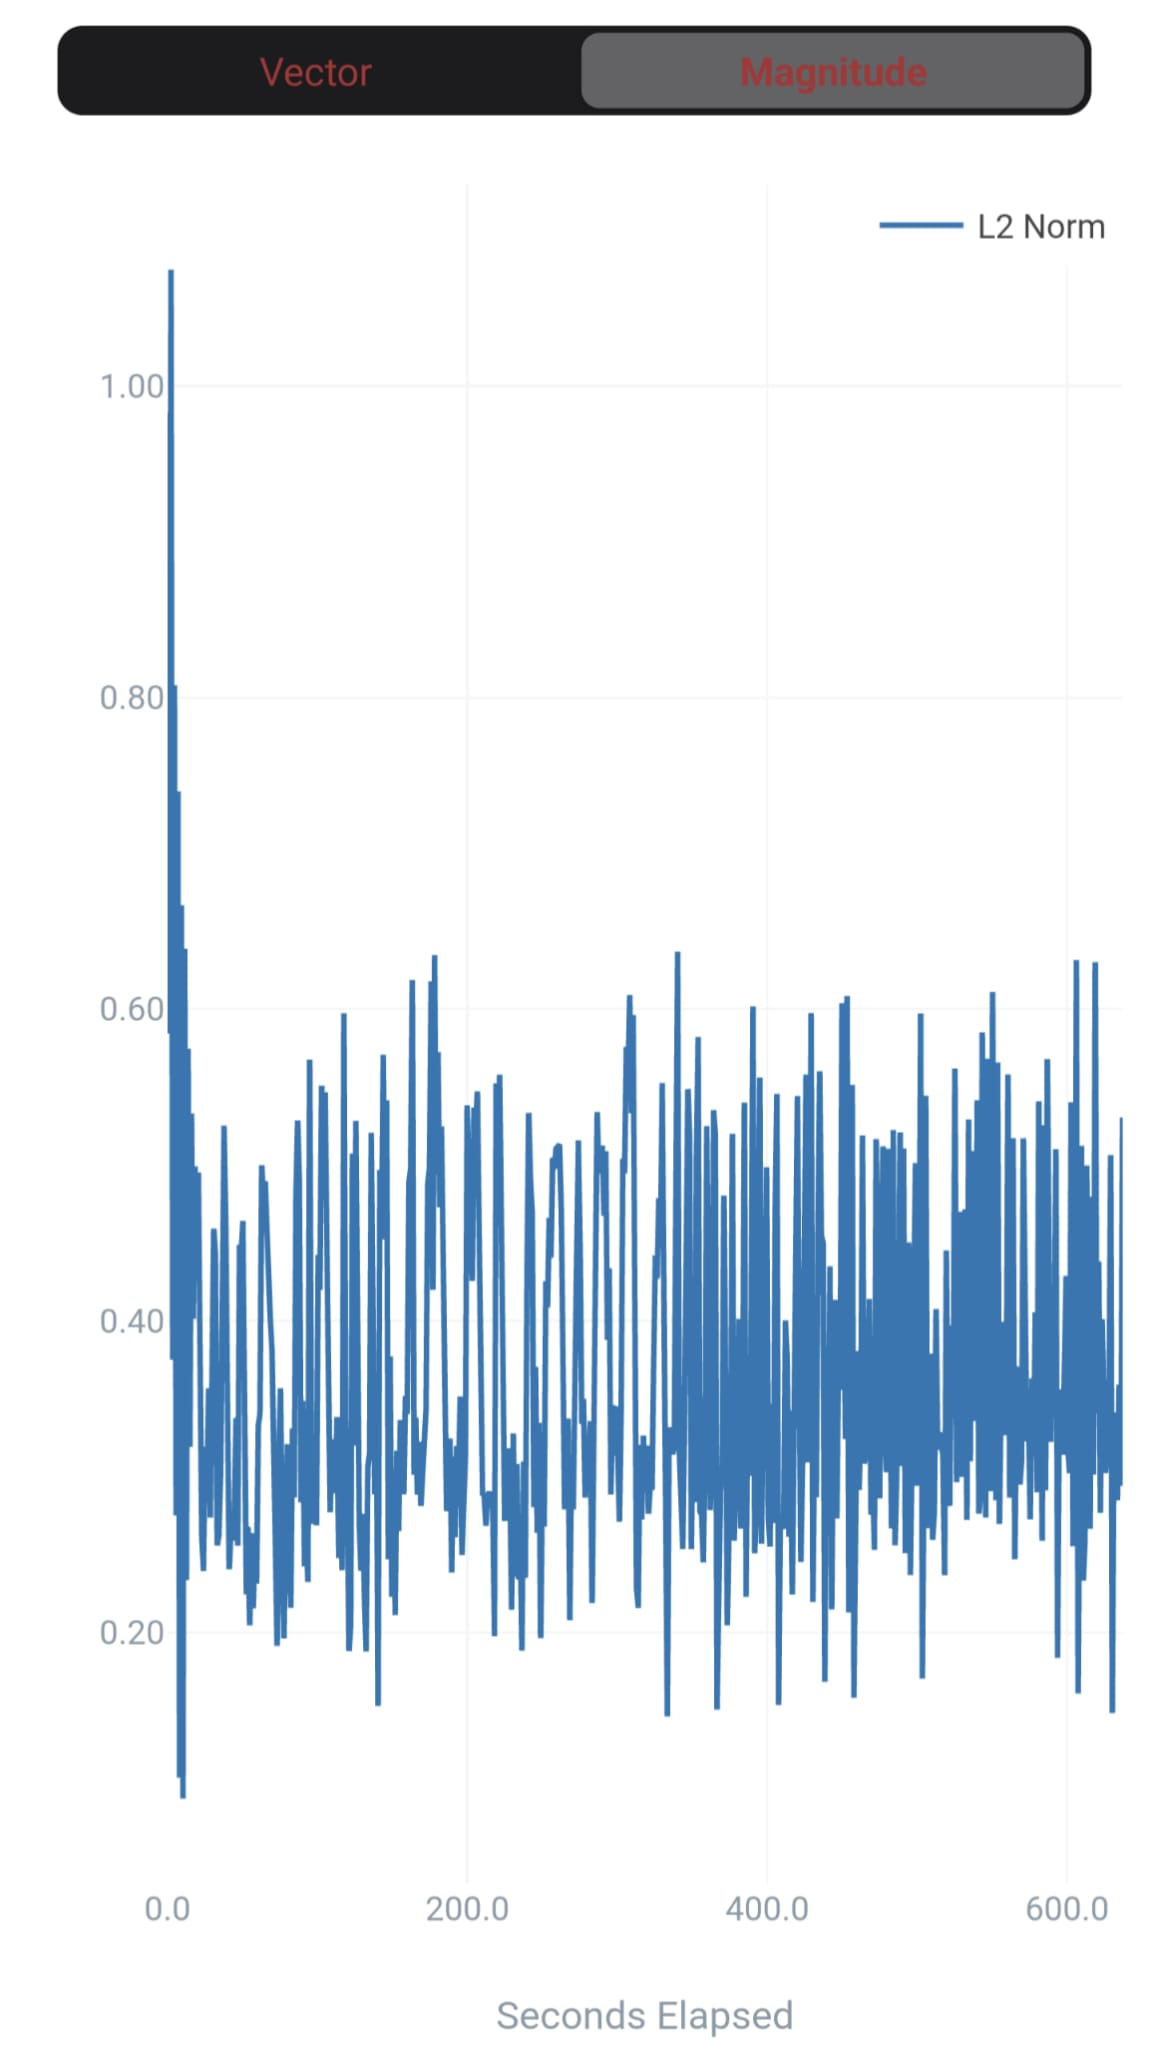
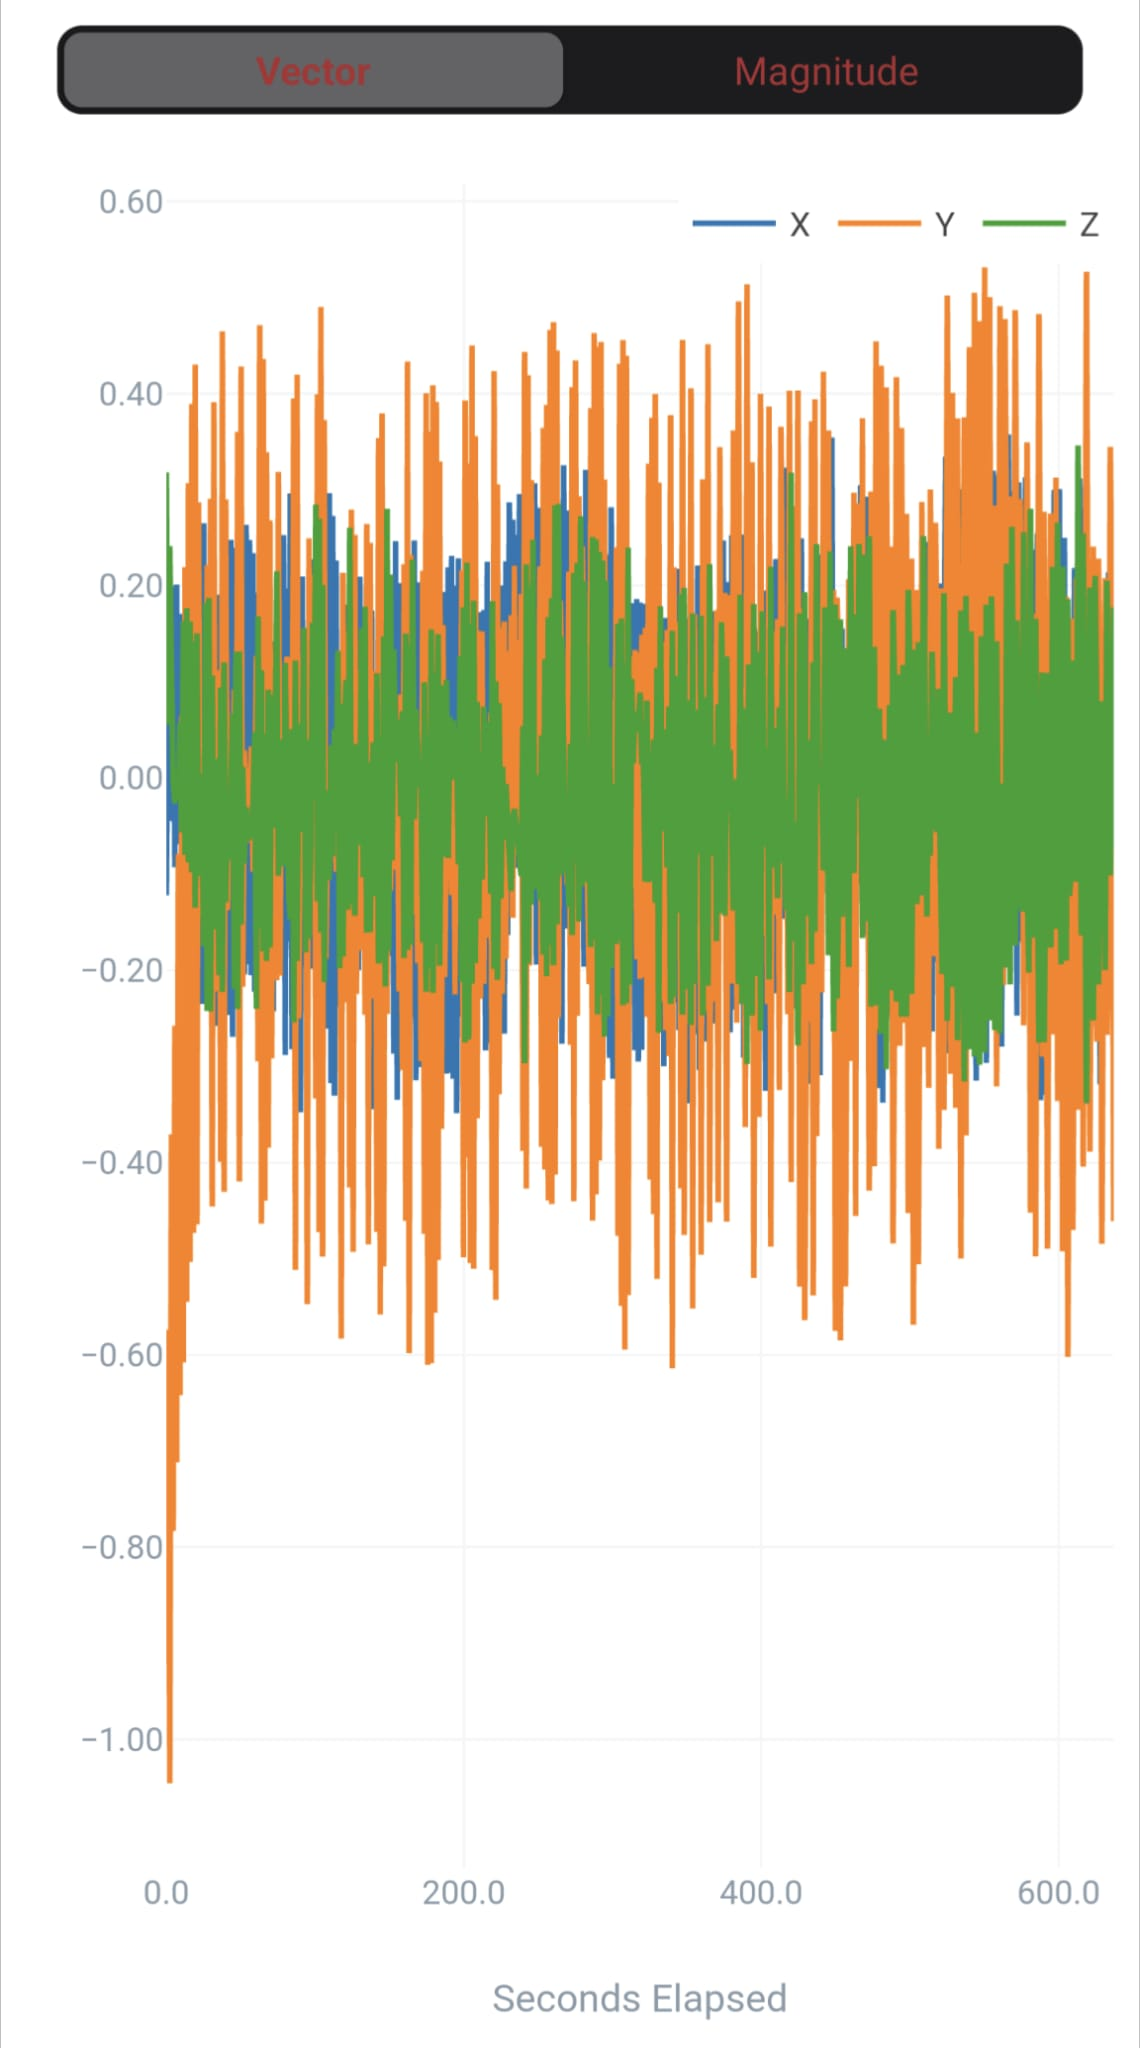
Following are few example of the sensor data (both vectors and absolute)
 Sign in with Wallet
Connect another wallet
Sign in with Wallet
Connect another wallet