# 2020q1 Homework1 (lab0)
contributed by < [25077667](https://github.com/25077667) >
:::danger
> [name=25077667]編輯中...
> 人在做,Google/GitHub 在看,不用特別強調你的閒置,快去動手!
> :notes: jserv
:::
:::info
作業要求:[【連結】](https://hackmd.io/JSFDnHn0Rpe0V7d-AqLAXA?view#-%E4%BD%9C%E6%A5%AD%E8%A6%81%E6%B1%82)
:::
# 開發環境
`$ neofetch`

# 實作思路
### q_new
很明顯,就是要 `new` 一個 queue,像這樣
```cpp=
queue_t *q_new()
{
queue_t *q = malloc(sizeof(queue_t));
if (q == NULL)
return NULL; // bad alloc
memset(q, 0, sizeof(queue_t));
return q;
}
```
可是呢~ 我原本其實是想用 calloc,像下面這樣,但是會:
> ERROR: Attempted to free unallocated block. Address = 0x7ffff4e93890
>
```cpp=
queue_t *q_new()
{
return calloc(1, sizeof(queue_t));
}
```
::: warning
接下來這邊要先看過[追蹤記憶體配置和釋放的狀況](https://hackmd.io/JSFDnHn0Rpe0V7d-AqLAXA?view#%E8%BF%BD%E8%B9%A4%E8%A8%98%E6%86%B6%E9%AB%94%E9%85%8D%E7%BD%AE%E5%92%8C%E9%87%8B%E6%94%BE%E7%9A%84%E7%8B%80%E6%B3%81)才能知道我說 function hooking 在 `harness.c` 的部分
:::
原本以為是 function hooking 沒改,所以會錯,但是進去看了之後似乎不是。因為報錯是 "Attempted to free unallocated block...",而這是在 `harness.c` 的 `find_header()` 的這幾行描述的:
```cpp=
if (cautious_mode) {
/* Make sure this is really an allocated block */
block_ele_t *ab = allocated;
bool found = false;
while (ab && !found) {
found = ab == b;
ab = ab->next;
}
if (!found) {
report_event(MSG_ERROR,
"Attempted to free unallocated block. Address = %p", p);
error_occurred = true;
}
}
```
很明顯,這是線性走訪所有 allocated heap 去找有沒有申請過這塊記憶體。
可是當我們回顧到 `harness.c` 的 `test_calloc()` 的 line 7
```cpp=
void *test_calloc(size_t nelem, size_t elsize)
{
/* Reference: Malloc tutorial
* https://danluu.com/malloc-tutorial/
*/
size_t size = nelem * elsize; // TODO: check for overflow
void *ptr = test_malloc(size);
if(!ptr)
return NULL;
memset(ptr, 0, size);
return ptr;
}
```
同樣是走 `test_malloc` 就是不知道為啥沒有把 `test_calloc` 的 address 放到 `allocated` 裡面去。不然怎麼會找不到呢?
>[name=25077667]所以就先 malloc + memset 湊合著用,先解決其他問題在深入去追 code
### q_free
因為太直觀,所以就不放 code 了。
就是一個一個 free,不然還有其他辦法嗎?
### q_insert_head
跟下面 `q_insert_tail` 很像。
```cpp=
bool q_insert_head(queue_t *q, char *s)
{
if (!q)
return false;
list_ele_t *newh = malloc(sizeof(list_ele_t));
if (!newh)
return false;
memset(newh, 0, sizeof(list_ele_t));
if (!(newh->value = strdup(s))) {
free(newh);
return false;
}
newh->next = q->head;
q->head = newh;
if (!q->tail)
q->tail = newh;
q->size++;
return true;
}
```
### q_insert_tail
總之就是要 $O(1)$ 完成插入。
目前程式碼如下
```cpp=
bool q_insert_tail(queue_t *q, char *s)
{
if (!q)
return false;
list_ele_t *newTail = malloc(sizeof(list_ele_t));
if (!newTail)
return false;
memset(newTail, 0, sizeof(list_ele_t));
if (!(newTail->value = strdup(s))) {
free(newTail);
return false;
}
if (q->tail != NULL)
q->tail->next = newTail;
q->tail = newTail;
if (q->head == NULL)
q->head = newTail;
q->size++;
return true;
}
```
第 6 行,一開始是使用 calloc,因為 `newTail->next` 要設成 `NULL`,NULL本質上也是 0,所以就打算 calloc = malloc + memset(0)。
但是問題同上 `q_new` 出現:
> ERROR: Attempted to free unallocated or corrupted block. Address = 0x7fffbae30820
>
這東西。
再來這邊還可以優化的地方,大概是把他跟 q_insert_head 寫再一起(當 `q == NULL` 或加入一個新節點時: line 6-13 )。
### q_remove_head
```cpp=
bool q_remove_head(queue_t *q, char *sp, size_t bufsize)
{
if (q == NULL || !q->head || sp == NULL)
return false;
list_ele_t *toBeDeleted = q->head;
memset(sp, 0, bufsize);
strncpy(sp, toBeDeleted->value, bufsize - 1);
q->head = q->head->next;
q->size--;
free(toBeDeleted->value);
free(toBeDeleted);
return true;
}
```
原本我 line 8 是用 memcpy,可是跑 Valgrind 的時候,被告知越界讀取,我還不是很懂為什麼,我猜是 memcpy 會往後多看一格(這應該是舉燭吧)
:::warning
工程人員用字遣詞應當精準!
:notes: jserv
>[name=25077667] fixed
:::
原本寫法在這 [commit](https://github.com/25077667/lab0-c/commit/9da5ccc1ed96ef65d9266e648500408f569c4a1e#diff-a5618994268beaa9fba3b5fc78562a8b),現在看一看覺得我 commit 名子寫錯,這才不是 buffer overflow,這是 Out-of-Bounds Reading。
### q_size
為了要 $O(1)$,就多放一個元素在 `queue_t` 叫做 size 存起來。
### q_reverse
就是動一動指標最快,所以就直接寫了。
寫完後覺得好像還可以改善,我想了一下下,就發現 `q->tail->next` 可以當作 cache 用,所以變成下面這樣子。恩這也很顯而易見。
```cpp=
void q_reverse(queue_t *q)
{
if (q == NULL || !q->size)
return;
list_ele_t *current = q->head->next;
q->tail = q->head;
while (current) {
/*
* Use q->tail->next to be the cache.
* Because q->tail->next is not using, and it can reduce declare a
* variable.
*/
q->tail->next = current->next;
current->next = q->head;
q->head = current;
current = q->tail->next;
}
}
```
### q_sort
這 `q_sort` 不是 `quick sort` 而是對 `queue sort`。
遇到的問題是 Stack Overflow,因為我原本 merge 的寫法是:
>list1->next = merge(list1->next, list2);
>
而這肯定是要遍歷完全部節點在 stack 上。
每一次 recursive function call 都要 push RBP,所以,會有很大的需求在 stack size 上。
(這是我在 Facebook 群組的[討論串](https://www.facebook.com/groups/system.software2020/permalink/325709451696594/),感謝大家花時間教我><)
改善方式:==把 `merge` function 換成 iterative 的方式==
目前寫法還有改善空間(不優雅、不利他)。
```cpp=
list_ele_t *merge(list_ele_t *list1, list_ele_t *list2)
{
list_ele_t *result, *current;
if (!list1)
return list2;
if (!list2)
return list1;
// init result and current
if (strcmp(list1->value, list2->value) < 0) {
result = list1;
list1 = list1->next;
} else {
result = list2;
list2 = list2->next;
}
current = result;
// merge value of list nodes until one's end
while (list1 && list2) {
if (strcmp(list1->value, list2->value) < 0) {
current->next = list1;
list1 = list1->next;
} else {
current->next = list2;
list2 = list2->next;
}
current = current->next;
}
if (list1)
current->next = list1;
if (list2)
current->next = list2;
return result;
}
list_ele_t *mergeSort(list_ele_t *head)
{
if (!head || !head->next)
return head;
// spilt into 2 lists, slow will be the half element of list
list_ele_t *fast = head->next;
list_ele_t *slow = head;
while (fast && fast->next) {
slow = slow->next;
fast = fast->next->next;
}
fast = slow->next;
slow->next = NULL;
list_ele_t *list1 = mergeSort(head);
list_ele_t *list2 = mergeSort(fast);
return merge(list1, list2);
}
void q_sort(queue_t *q)
{
if (!q || q->size < 2)
return;
q->head = mergeSort(q->head);
list_ele_t *last = q->head;
while (last->next) {
last = last->next;
}
q->tail = last;
}
```
:::warning
剛剛看覺得糟糕,我 sort 啥東西都沒動,竟然有次會出現:
> +++ TESTING trace trace-15-perf:
> \# Test performance of insert_tail, size, reverse, and sort
> ERROR: Time limit exceeded. Either you are in an infinite loop, or your code is too inefficient
> --- trace-15-perf 0/6
>
難道真落在那 5% 拒絕區?還是我的表現只是近似 const time,但不是 const?
這我還要在找找原因(也可能是我 merge 太沒效率啦)
:::
# natural sort
<!-- Will add this at tomorrow -->
1. 下載他
```
$ wget https://raw.githubusercontent.com/sourcefrog/natsort/master/strnatcmp.c
$ wget https://raw.githubusercontent.com/sourcefrog/natsort/master/strnatcmp.h
```
2. Makefile
在 Makefile 的 OBJS 中加入 strnatcmp.o 讓他生成 strnatcmp 的 object file
3. replace `strcmp()` to `strnatcmp()` in queue.c and qtest.c:
原本以為這樣就 ok 了,但是在 git pre-commit 的 hook 擋下來:
```
strnatcmp.c:112:14: style: The scope of the variable 'ca' can be reduced. [variableScope]
nat_char ca, cb;
^
strnatcmp.c:112:18: style: The scope of the variable 'cb' can be reduced. [variableScope]
nat_char ca, cb;
^
strnatcmp.c:163:0: style: The function 'strnatcmp' is never used. [unusedFunction]
^
Fail to pass static analysis.
```
於是我把 `nat_char ca, cb;` 移進 `while(1)` 中,把未使用的 `strnatcmp` 註解起來。
>[name=25077667] CPPCHECK 好嚴格QQ
>
然後就可以成功 commit 了。
## Time limit exceeded
在這邊,每次 `make test` 的第 15 個測試都會超時。
```
+++ TESTING trace trace-15-perf:
# Test performance of insert_tail, size, reverse, and sort
ERROR: Time limit exceeded. Either you are in an infinite loop, or your code is too inefficient
--- trace-15-perf 0/6
```
跟上面的 "偶爾" 超時,有很大差異。
但是因為修改的部分只有 compare function 因此考慮的是 code 本身的效率問題與 function call 的成本。
因此我們拿 perf 去看他
```shell=
$ sudo perf top -p ${pid}
```
使用 natsort 超時的關鍵發現:
> Overhead Shared Objec Symbol
> ==28.64% qtest [.] strnatcasecmp==
> ==20.87% qtest [.] mergeSort==
> ==12.11% qtest [.] show_queue==
> 6.43% libc-2.27.so [.] _int_malloc
> 3.21% qtest [.] test_malloc
> 3.05% qtest [.] q_reverse
> 2.80% qtest [.] test_strdup
> 2.78% qtest [.] merge
> 2.39% qtest [.] __ctype_toupper_loc@plt
> 2.24% libc-2.27.so [.] __ctype_toupper_loc
> 2.19% qtest [.] q_sort
> 1.47% libc-2.27.so [.] __random
> 1.32% libc-2.27.so [.] malloc
> 1.06% libc-2.27.so [.] __strcasecmp_l_avx
> 0.96% [kernel] [k] prepare_exit_to_usermode
[結果檔案](https://github.com/25077667/lab0-c/blob/master/trace-15-perf-test)
我們應該先解決高 cpu 週期占比的。
所以是先考慮 ==標註起來== 的這三個
但是 `strnatcasecmp` 跟 `show_queue` 不可控。因此我就再確認如果不用 `strnatcasecmp` 的 cpu 使用週期其況。
> Overhead Shared Objec Symbol
> 27.15% qtest [.] mergeSort
> 17.55% qtest [.] show_queue
> 6.96% libc-2.27.so [.] _int_malloc
> 6.58% libc-2.27.so [.] __strcmp_sse2_unaligned
> 4.31% qtest [.] q_reverse
> 3.97% qtest [.] merge
>
果然消耗最大的是 `mergeSort`。但是我不知道從何改善起,讓我想想這要怎麼優化。
:::danger
TODO: 優化 mergeSort()
:::
# 記憶體分析
`$ make valgrind`
>[name=25077667]這在 WSL 上有可能會[錯誤](https://stackoverflow.com/questions/57206233/valgrind-showing-error-calling-pr-set-ptracer-vgdb-might-block)。

基本上就可能 RAM 吃太飽 malloc 不到東西。其他沒啥問題:

`$ htop`

## Massif
`$ valgrind --tool=massif ./qtest -f traces/trace-18-natsort.cmd`
這是跑 nat_sort 的 valgrind 結果

[Output File](https://github.com/25077667/lab0-c/blob/master/massif.out.7408)
# 論文 Dude, is my code constant time?
論文[連結](https://eprint.iacr.org/2016/1123.pdf)
論文說他這方法是時序攻擊的一種,然後是基於統計分析的,不會因為硬體環境差異而有所錯誤。
他也提到一個 [ctgrind](https://github.com/agl/ctgrind),挺有趣的,也是檢測一你是否為 const time。
至於他的統計分析,就是拿兩個不同的 data 丟進去,統計上透過 Student-T 的 model 去做用 Welch’s 去算 p-value.
至於 Welch’s 可以參考我去年統計學寫的[筆記](https://hackmd.io/@25077667/statistic#Case-II-%E6%AF%8D%E9%AB%94%E5%B8%B8%E6%85%8B%EF%BC%8C%E8%AE%8A%E7%95%B0%E6%95%B8%E7%9A%86%E6%9C%AA%E7%9F%A5),這是關於母體常態,變異數皆未知的情況。
這篇方法主要分三個步驟
1. Measure execution time
* Classes definition:
* 分兩類 input data
* Cycle counters:
* 計算 clock 數
* 在不同環境用不同方法算:systick、high-resolution timers、external equipment 或是有些處理器自己就有提供
* Environmental conditions:
* 最小化環境差異造成影響
2. Apply post-processing
* Cropping:
* 去掉離群值
* 可能因為 interrupt 或是 extraneous activities 導致
* Higher-order preprocessing:
* 這我看不懂
:::warning
和 higher-order function 無關,後者是 programming language 的範疇。這裡著重 "preprocessing",注意看論文的訴求。另外,不懂就標註出來,不要說「看不太懂」這種含糊的話 —— 誠實面對自己!
:notes: jserv
:::
3. Apply statistical test
* t-test:
* T檢定
* 裡面一段提到說前面的 cropping 因為是 non-linear 所以會造成 T 分配的不適用。
* 這邊我有點不懂的是:去掉離群值不是很正常嗎,即便是 non-linear 的操作資料,不也只是讓 sample without bias 而已嗎?
* 然後這邊他的 Null hypothesis 是兩個樣本同分布,但是如果只是要檢測是否比標準複雜度低,只需要單尾檢定即可。
* Non-parametric test:
* 原文說也可以使用 nonparametric test,因為這依賴比較少的假設,但是缺點是收斂慢(需要大樣本)。
## Dudect codes
這作法跟我之前的寫統計學作業的經驗不太一樣,過去我們統計學要求出 p-value,所以多個麻煩的積分。(那時候不能用 for loop 因為 IEEE-754 的誤差會影響到,然後每次的黎曼求法的 dx 又很小,所以浮點數的影響就會對後續的數據造成有點嚴重的 $\pm 1$ 誤差)
https://jonisalonen.com/2013/deriving-welfords-method-for-computing-variance/
==File: **ttest.[ch]**==
### t_ctx
* mean: $H_0$ 與 $H_1$ 的平均數
* m2: $H_0$ 與 $H_1$ 的 $(N-1)*Var()$
* n: $H_0$ 與 $H_1$ 的 smaple size
### t_compute
計算檢定統計數,在 $T$ 分配底下。
這邊挺直覺得,就是
$t = \frac{\bar{X_0} - \bar{X_1}}{\sqrt{\frac{Var_0}{N_0} + \frac{Var_1}{N_1}}}$
### t_push
這其實是提供 mean、m2 給 `fixture.c` 的 `update_statistics`。
* `dalta`:
* `double delta = x - ctx->mean[class];`
* 這個 `x` 就是他的執行時間
* `ctx->n[class]++`
* 因為之前是 $N-1$,接下來要計算第 $N$ 個
* `mean`
* 前一個的平均加上這一個的 $\Delta \over N$ ,相當合理
* 最難的是 `m2`
* 推導如下:
> 根據平均值公式:$\Delta \bar x = \bar x_1 - \bar x_2$
> $\rightarrow {x_1 - (N-1) \bar x_2 \over N}$
> 然後根據變異數的平移對稱性([之前筆記](https://hackmd.io/@25077667/statistic#%E8%AE%8A%E7%95%B0%E6%95%B8)),把 `m2` 展開 $M_{2,i} = M_{2,{i-1}} + (x_i - \bar{x_{i-1}}) \cdot (x_i - \bar{x_{i}})$
> 就是這行了
> ```cpp=
> ctx->m2[class] = ctx->m2[class] + delta * (x - ctx->mean[class]);
> ```
==File: **fixture.[ch]**==
### do_it
* `mode`: 傳入`constant.c` 的 `measure` 用於控制要 `test_insert_tail` 還是 `test_insert_tail`。
* 有疑問的點:
* 這邊有使用到 5 個空間都是使用 `calloc`,其中 `input_data` 就是測試資料,竟然沒有出現跟我上面相同的錯誤:
> Attempted to free unallocated block. Address = 0x7ffff4e93890
* `prepare_inputs`: 產生 input ,而這邊比較有趣的是 rand 出來的 class[i] 有二分之一的機率,會把下面兩個 byte 也寫成 0。控制下面 `measure` 函式的插入次數。
> *(uint16_t *) (input_data + i * chunk_size) = 0x00;
* 其中的 `randombytes` 會使用到 `/dev/urandom/`,去填 `input_data`。但是似乎沒有 close(fd)。不確定是什麼原因不需要,或是沒有寫 close(fd)。
* 果然我跑 valgrind 看,他會說我沒有關檔。
* `measure`: 對頭尾插入 `*(uint16_t *) (input_data + i * chunk_size)` 次。分別儲存於 `before_ticks` 與 `after_ticks`。
* `differentiate`: 將前述 `before_ticks` 與 `after_ticks` 的相差,儲存於 `exec_times`。
* `update_statistics`: 根據 `differentiate` 算完,放在`exec_times` 的時間差,去做 T 檢定。
* `cpucycles`: 這是在 `measure` 中測量執行時間的關鍵,他定義在 `cpucycles.h` 中。
```cpp=
#include <stdint.h>
// http://www.intel.com/content/www/us/en/embedded/training/ia-32-ia-64-benchmark-code-execution-paper.html
static inline int64_t cpucycles(void)
{
#if defined(__i386__) || defined(__x86_64__)
unsigned int hi, lo;
__asm__ volatile("rdtsc\n\t" : "=a"(lo), "=d"(hi));
return ((int64_t) lo) | (((int64_t) hi) << 32);
#else
#error Unsupported Architecture
#endif
}
```
這邊覺得有趣的是 `bitwise` 運算,為何這會是 `cpucycles` 呢?
cpu_high, cpu_low 都是使用 RDTSC 這個 [x86_Read Time-Stamp Counter](https://c9x.me/x86/html/file_module_x86_id_278.html)
> `hi`: 就是 cpu_high , `lo`: 就是 cpu_low
>
我們可見在 `((int64_t) lo) | (((int64_t) hi) << 32);` 就是把 `cpu_high` 放在高位元(32),把 `cpu_low` 放在低位元(32)。一起組成 64 位元。傳回 `before_ticks` 跟 `after_ticks`。
然後這邊有關於 volatile 的[參考資料](https://bluelove1968.pixnet.net/blog/post/222282820)
# select
<!-- 正在看 -->
覺得看完[重點提示](https://hackmd.io/@sysprog/H1TtmVTTz),還是只有舉燭。
所以以下是我的舉燭。
* `select`:
* 是一個 sys_call。
* 宣告:`int select(int nfds, fd_set *readfds, fd_set *writefds, fd_set *exceptfds, struct timeval *timeout);`
* `nfds`: An integer one more than the maximum of any file descriptor in any of the sets.
* `readfds`: Holding the file descriptors to be checked for being ready to **read**, and on output indicates which file descriptors are ready to **read**.
* `writefds`: Holding the file descriptors to be checked for being ready to **write**, and on output indicates which file descriptors are ready to **write**.
* `errorfds`: Holding the file descriptors to be checked for **error conditions pending**, and on output indicates which file descriptors have **error conditions pending**.
* `timeout`: Specifies a **maximum interval to wait** for the selection to complete.
* 其中 `readfds`, `writefds`, `errorfds` 可以為 `NULL`
* 但是如果「全部」是 NULL,意義是什麼?我不知道。
* man 的描述:
* `select()` and `pselect()` allow a program to monitor multiple file descriptors, waiting until one or more of the file descriptors become "ready" for some class of I/O operation (e.g., input possible). A file descriptor is considered ready if it is possible to perform a corresponding I/O operation (e.g., `read(2)`, or a sufficiently small `write(2)`) without blocking.
* I/O Model:
* [參考資料](https://medium.com/@clu1022/%E6%B7%BA%E8%AB%87i-o-model-32da09c619e6)
* 這有張很有趣的圖:
* 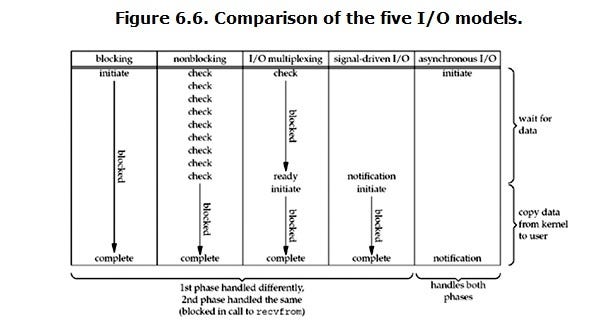
* 從上面這張圖,描述以下這四種 I/O 方式
* Blocking I/O
* Non-blocking I/O
* Synchronous I/O
* Asynchronous I/O
* `select()` 作用:
* `select()`
* +`read()` 是一種 Blocking I/O
* +`recvfrom()` 是一種 Non-blocking I/O
* 當我們給 `select` 多個 `fd` 時,可以同時觀察多個 I/O 是否 "is ready"。 然後我們可以從 `select()` 的 return 值,取得第幾個 `fd` 使用 `read()` 進行 I/O。
# 小結
寫不完 la
# 參考資料
[perf tool](https://hackmd.io/@sysprog/B11109rdg)
 Sign in with Wallet
Connect another wallet
Sign in with Wallet
Connect another wallet