# 2016 homework2(A) Raytracing
## 作業要求 A
* 在 GitHub 上 fork [raytracing](https://github.com/embedded2016/raytracing),並思考如何改善程式效能
* 以 make PROFILE=1 重新編譯程式碼,並且學習 [gprof](https://sourceware.org/binutils/docs/gprof/)
* 參考 [使用 GNU gprof 進行 Linux 平台的程式分析](http://os.51cto.com/art/200703/41426.htm)
* 以 [gprof](https://sourceware.org/binutils/docs/gprof/) 指出效能瓶頸,並且著手改寫檔案 math-toolkit.h 在內的函式實做,充分紀錄效能差異在共筆
* 注意: 請勿更動編譯器最佳化選項 -O0 (關閉最佳化)
* 檔案 math-toolkit.h 定義的若干數學操作函式很重要,可參考 [SIMD optimized dot and cross product functions](http://tomjbward.co.uk/simd-optimized-dot-and-cross/) 和 [2015q3 Homework #1 Ext](http://wiki.csie.ncku.edu.tw/embedded/2015q3h1ext)
* 可善用 POSIX Thread, OpenMP, software pipelining, 以及 loop unrolling 一類的技巧來加速程式運作
## 學習Gprof
* 在gcc 編譯和連結你的程式的時候(使用-pg編譯和連結選項),gcc在你程式的每個函式中都加入了一個名為mcount ( or “_mcount” , or “__mcount ” ,依賴於編譯器或作業系統)的函式,也就是說你的程式裡的每一個函式都會呼叫mcount函式,而mcount會在內存中保存一張函式呼叫圖,並通過函式呼叫heap 與 stack 的形式查找caller和callee的地址。這張呼叫圖也保存了所有與函式相關的呼叫時間,呼叫次數等等的所有信息。
* 在這次作業中可以看到Makefile 有下面的指令:
```
ifeq ($(strip $(PROFILE)),1)
PROF_FLAGS = -pg
CFLAGS += $(PROF_FLAGS)
LDFLAGS += $(PROF_FLAGS)
endif
```
**ifeq ($(strip $(PROFILE)),1)** 這段也可以這樣表示**ifeq (a,a)** 或是**ifeq "a" "a"** 但為了避免變數展開後包含了非預期的空白字符,所以這樣的寫法比較好,而在使用 make指令時 要求加入 PROFILE=1,才會去比較 **if(value_1,value_2)** 看是否成立 則CFLAGS 加入 -pg flag.
**step1:**
輸入` make PROFILE=1 && ./raytracing` 則會產生一個gmon.out 檔,如果沒有先make clean在輸入一次
**step2:**
`gprof -b ./raytracing gmon.out | less` 由於gprof輸出的信息比較多,這裡使用了less 命令,該命令可以讓我們通過上下方向建查看gprof產生的輸出,| 表示gprof -b a.out gmon.out 的輸出作為less的輸入
```
Flat profile:
Each sample counts as 0.01 seconds.
% cumulative self self total
* time seconds seconds calls s/call s/call name
* 24.50 0.60 0.60 69646433 0.00 0.00 dot_product
* 20.83 1.11 0.51 56956357 0.00 0.00 subtract_vector
* 9.19 1.34 0.23 13861875 0.00 0.00 rayRectangularIntersection
* 7.76 1.53 0.19 31410180 0.00 0.00 multiply_vector
* 6.13 1.68 0.15 17836094 0.00 0.00 add_vector
* 5.51 1.81 0.14 13861875 0.00 0.00 raySphereIntersection
* 4.90 1.93 0.12 4620625 0.00 0.00 ray_hit_object
* 3.68 2.02 0.09 1048576 0.00 0.00 ray_color
* 3.27 2.10 0.08 17821809 0.00 0.00 cross_product
可以看到dot_product 這個函式被執行了快7千萬次而subtract_vector執行次數也很高
```
**step3:**
`gprof raytracing gmon.out > analysis.txt` 可以把上面的結果輸出到analysis.txt檔案
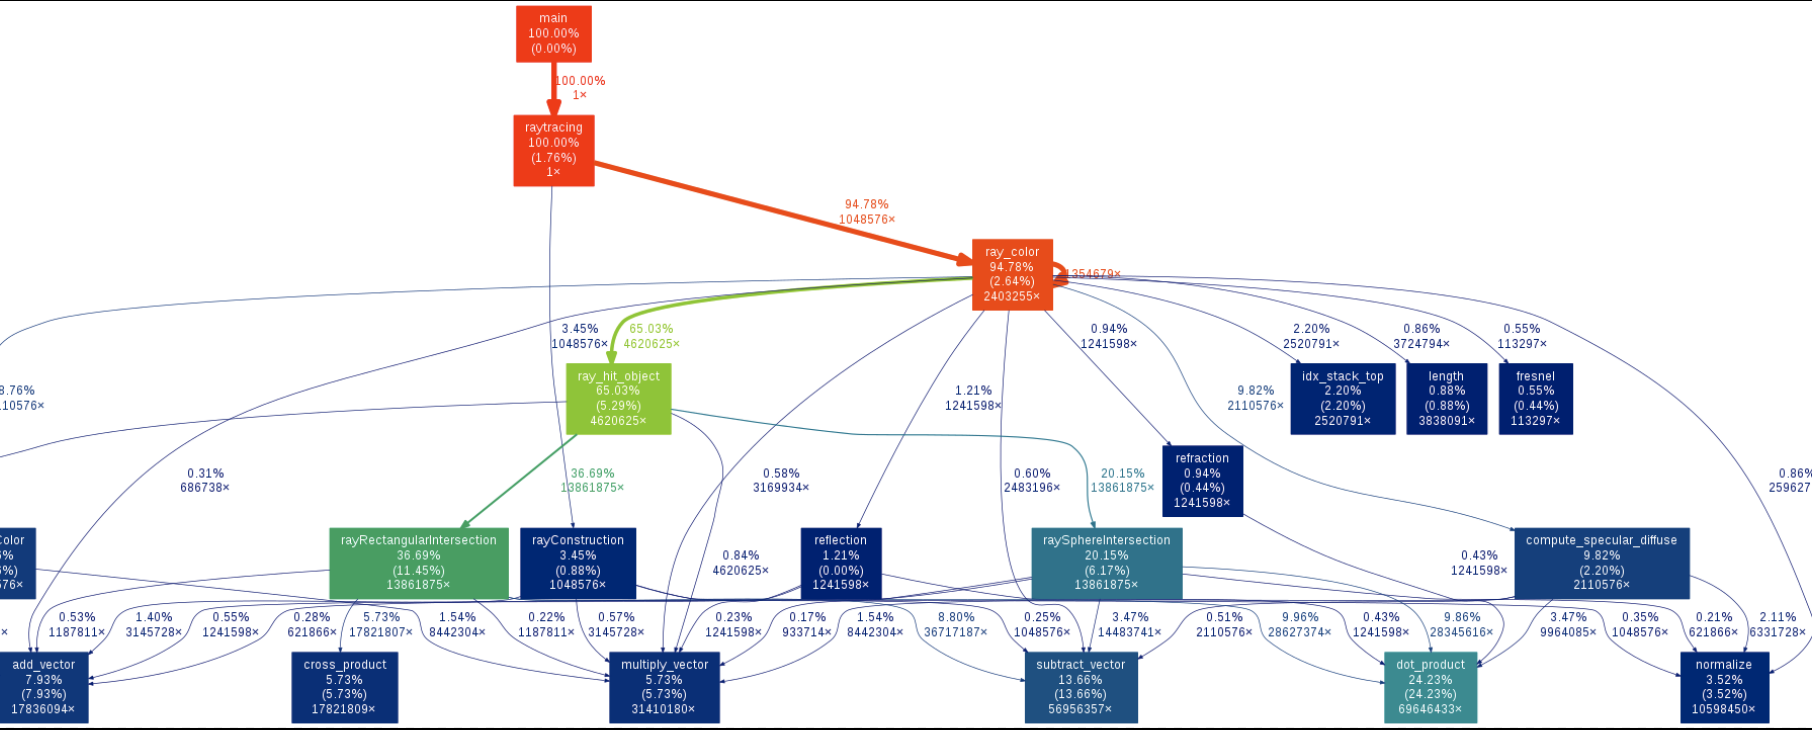
## Gprof call graph圖
這邊參考RINC同學筆記
輸入 `make PROFILE=1 && ./raytracing` 會產生gmon.out 檔
之後在輸入`gprof ./raytracing | ~/gprof2dot/gprof2dot.py| dot -Tpng -o callgraph.png`
記得要先去`git clone https://github.com/jrfonseca/gprof2dot.git https://github.com/jrfonseca/gprof2dot.git` **[gprof2dot](https://github.com/jrfonseca/gprof2dot)**
就可以看到函數呼叫情形的關係圖如下:
## 修改math-toolkit.h
**未優化:**
先以` make PROFIEL=1 && ./raytracing ` 重新編譯並執行
```
* # Rendering scene
* Done
* Execution time of raytracing() : 5.744171 sec
* Each sample counts as 0.01 seconds.
* % cumulative self self total
* time seconds seconds calls s/call s/call name
* 22.52 0.52 0.52 69646433 0.00 0.00 dot_product
* 19.93 0.98 0.46 56956357 0.00 0.00 subtract_vector
* 10.83 1.23 0.25 31410180 0.00 0.00 multiply_vector
* 6.93 1.39 0.16 17821809 0.00 0.00 cross_product
```
沒加-pg:
```
* # Rendering scene
* Done!
* Execution time of raytracing() : 2.430251 sec
```
## 開啟編譯器最佳化-Ofast
有加-pg:
```
* # Rendering scene
* Done!
* Execution time of raytracing() : 0.691856 sec
```
沒有加-pg:
```
* # Rendering scene
* Done!
* Execution time of raytracing() : 0.556231 sec
```
也太快了吧~!
## loop unrolling
原式:
```clike=
static inline
double dot_product(const double *v1, const double *v2)
{
double dp = 0.0;
for (int i = 0; i < 3; i++)
dp += v1[i] * v2[i];
return dp;
}
```
可以看到原本是一個for迴圈雖然只短短跑3次,但是此函式跑了7千萬次,所以總共要執行2億次的for迴圈,這邊採用loop unrolling 來減少迴圈的負荷,
```clike=
static inline double dot_product(const double *v1, const double *v2)
{
double dp = 0.0;
dp += v1[0] * v2[0];
dp += v1[1] * v2[1];
dp += v1[2] * v2[2];
return dp;
}
```
```
# Rendering scene
Done!
Execution time of raytracing() : 4.750202 sec
Each sample counts as 0.01 seconds.
% cumulative self self total
time seconds seconds calls s/call s/call name
18.76 0.29 0.29 69646433 0.00 0.00 dot_product
13.82 0.50 0.21 56956357 0.00 0.00 subtract_vector
9.87 0.65 0.15 13861875 0.00 0.00 rayRectangularIntersection
9.87 0.80 0.15 4620625 0.00 0.00 ray_hit_object
7.90 0.92 0.12 31410180 0.00 0.00 multiply_vector
7.57 1.03 0.12 17821809 0.00 0.00 cross_product
```
可以看到時間有明顯下降從5.744171 sec -> 4.750202 sec 下降快0.99秒(有加-pg)
**沒加-pg :**
```
* # Rendering scene
* Done!
* Execution time of raytracing() : 1.865293 sec
```
可以看到時間有明顯下降從2.430251 sec -> 1.865293 sec 下降快0.99秒
## inline + loop unrolling
可以看到原本函式都有static inline 但因為我們關閉了最佳化-O0 而且inline 也是建議編譯器要將它設為行內函式,但並不一定會執行,所以參考老師上課提示除非我們加forceinline 告知編譯器這邊要做最佳化,許同學說:inline後的函數不保證不會留外部符號,由於可能有多檔案引用.h會造成重複定義故加static
* 這邊對於同學說的外部符號有點不太懂?
GCC does not inline any functions when not optimizing unless you specify the ‘always_inline’ attribute for the function, like this:
* /* Prototype. */
* inline void foo (const char) __attribute__((always_inline));
The remainder of this section is specific to GNU C90 inlining.
在 Makefile 加入以下:
```
* CFLAGS = \
* -std=gnu99 -Wall -O0 -g \
* -D__forceinline="__attribute__((always_inline))"
```
把函式改成以下:
```clike=
static inline __forceinline double length(const double *v)
{
return sqrt(v[0] * v[0] + v[1] * v[1] + v[2] v[2]);
}
```
```
# Rendering scene
Done!
Execution time of raytracing() : 2.441818 sec
```
時間有明顯下降從 4.750202 sec -> 2.441818 sec 下降快2.31秒
```
* Flat profile:
* Each sample counts as 0.01 seconds.
* % cumulative self self total
* time seconds seconds calls s/call s/call name
* 30.73 0.47 0.47 13861875 0.00 0.00 rayRectangularIntersection
* 26.15 0.87 0.40 13861875 0.00 0.00 raySphereIntersection
* 10.46 1.03 0.16 2110576 0.00 0.00 compute_specular_diffuse
* 9.15 1.17 0.14 1048576 0.00 0.00 ray_color
* 5.23 1.25 0.08 4620625 0.00 0.00 ray_hit_object
可以看到因為都強制展開了所以只剩下其他的函式
**沒加-pg :**
* # Rendering scene
* Done!
* Execution time of raytracing() : 1.652027 sec
```
## Multithread +loop unrolling + inline
先來研究POSIX Thread 如下:
**pthread_create**這個Function的作用是用來產生一個Thread並執行附帶的Function,回傳值: 如果執行成功則回傳0,如果執行失敗則回傳錯誤代碼
```clike=
pthread_create(pthread_t *tid ,//為pthread的指標,在使用Thread之前必須要先宣告一個pthread_t的變數
const pthread_attr_t *attr ,//該Thread的屬性,預設是NULL
void *(*function)(void *) , //為Function pointer,這邊要放入你要執行的Function
void *argument);//為Function pointer所要帶的參數
```
ex: pthread_create( &thread1, NULL , showmessage , message);
**pthread_exit**:用來關閉一個Thread,附帶有1個參數。
原始的定義 void pthread_exit (void *value_ptr)
參數1: void *value_ptr用來設定執行成功時該Thread會回傳的值,這個值可由pthread_join()這個 Function來取得。
回傳值: 不會回傳任何值。
example: pthread_exit(NULL);
**pthread_join:**
原始的定義 int pthread_join (pthread_t thread, void **value_ptr)
這個Function的作用會暫停目前執行pthread_join的Thread,等到目標Thread執行完畢之後 目前執行pthread_join的Thread才會繼續執行,附帶有2個參數。
參數1: pthread_t thread為要等待的目標Thread。
參數2: void **value_ptr用來取得目標Thread的回傳值。
回傳值: 如果執行成功則回傳0,如果執行失敗則回傳錯誤代碼
**<u>實做:</u>**
這邊實做主要參考陳品睿同學筆記架構,可以知道raytracing這個函式可以做平行化,我是把thread create還有宣告這部份都寫在main程式,因為在寫程式的時候會遇到的問題是要如何把raytracing所需要的參數傳進去,而thread只能傳一個參數,所以這邊是用兩個struct 把參數包起來一個包含基本的參數,另一個則是依照thread 1 要做0,4,8.....column, thread 2 做1,5,9.....column 這邊要小心傳遞的參數要仔細,程式修改完後跑完結果圖沒出來,後來找了很久才知道在ratraycing 函式中 for迴圈有個小地方沒有改到結果圖一直沒有顏色@@ 還好有gdb幫忙可以節省很多時間
```clike=
typedef struct _thread_arg{
uint8_t *pixels;
double *background_color;
rectangular_node rectangulars;
sphere_node spheres;
light_node lights;
const viewpoint *view;
int width;
int height;
int thnum;
}thread_arg; //基本參數
typedef struct _thr_arg{
thread_arg *ptr;
int start_height;
}thr_arg;//主要傳遞thread 從那一個column開始做
```
**<u>以column來做分割:</u>**
**thread num:4**
```
* # Rendering scene
* Done!
* Execution time of raytracing() : 1.976252 sec (-pg)
* Execution time of raytracing() : 0.474479 sec (沒有-pg)
```
**thread num:8**
```
* # Rendering scene
* Done!
* Execution time of raytracing() : 1.756253 sec (-pg)
* Execution time of raytracing() : 0.492798 sec (沒有-pg)
```
**thread num:16**
```
* # Rendering scene
* Done!
* Execution time of raytracing() : 1.708510 sec (-pg)
* Execution time of raytracing() : 0.488995 sec(沒有-pg)
```
**thread num:32**
```
* # Rendering scene
* Done!
* Execution time of raytracing() : 1.641048 sec (-pg)
* Execution time of raytracing() : 0.486502 sec (沒有-pg)
```
**thread num:64**
```
* # Rendering scene
* Done!
* Execution time of raytracing() : 1.641311 sec (-pg)
* Execution time of raytracing() : 0.487008 sec(沒有-pg)
```
以上可以看到在沒有加 -pg 時 thread num =4時是最佳的,因為我的電腦是四核心,實際上也是4個執行緒在跑,已經可以比ofast快0.11 秒,還可以在思考哪邊可以在加速~~
**<u>以ROW來做分割:</u>**
**thread num:4**
```
* # Rendering scene
* Done!
* Execution time of raytracing() : 0.506358 sec
```
**thread num:8**
```
* # Rendering scene
* Done!
* Execution time of raytracing() : 0.501141 sec
```
可以看到以column來分割會比較快
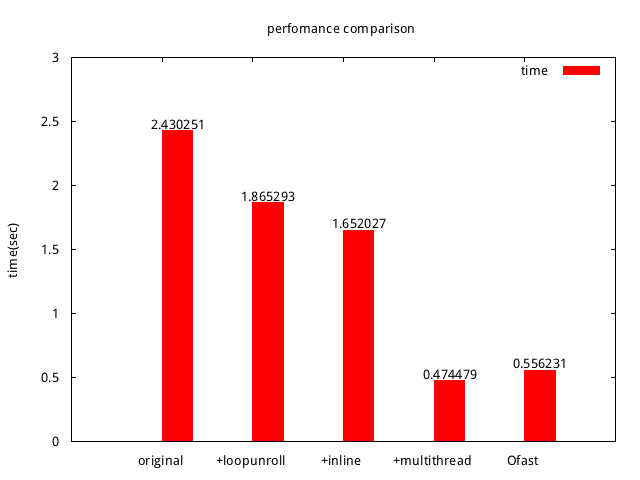
以上都是沒加-pg的時間可以看到一直優化下去時間相對的一直減少,用multithread 最後竟然可以超越ofast 真是太厲害了~~ 果然善用好的方法是可以大幅改善效能的~~
效能提升大概可提升6X
## 參考資料
* [RINC同學](https://embedded2016.hackpad.com/2016q1-Homework-2A-GalzL151aZc)(有call graph圖及multithread)[gprof2](https://github.com/jrfonseca/gprof2dot)
* [吳彥寬同學](https://embedded2016.hackpad.com/2016q1-Homework-2A-wOu40KzMaIP)(對於SIMD實做及multithread)
* [陳品睿同學](https://embedded2016.hackpad.com/2016q1-Homework-2A-bLGQtRraTES)(有實做各種 multithread)
* [POSIX pthreads Tutorial](http://randu.org/tutorials/threads/)
* [POSIX Threads Programming](https://computing.llnl.gov/tutorials/pthreads/)