---
title: ELK APM
tags: apm
---
[toc]
# Logging, Metrics, Tracing
## Logging:提供系統特定位置的變數值和呼叫記錄
* Trace, Debug, Info, Warn, Error, Fatal
* NLog: https://nlog-project.org/
* SeriLog: https://serilog.net/
## Tracing: 提供整個呼叫過程的追踪紀錄
* google chrome devtool
* OpenTracing: https://opentracing.io/
* Zipkin: https://zipkin.io/
* Jaeger: https://www.jaegertracing.io/
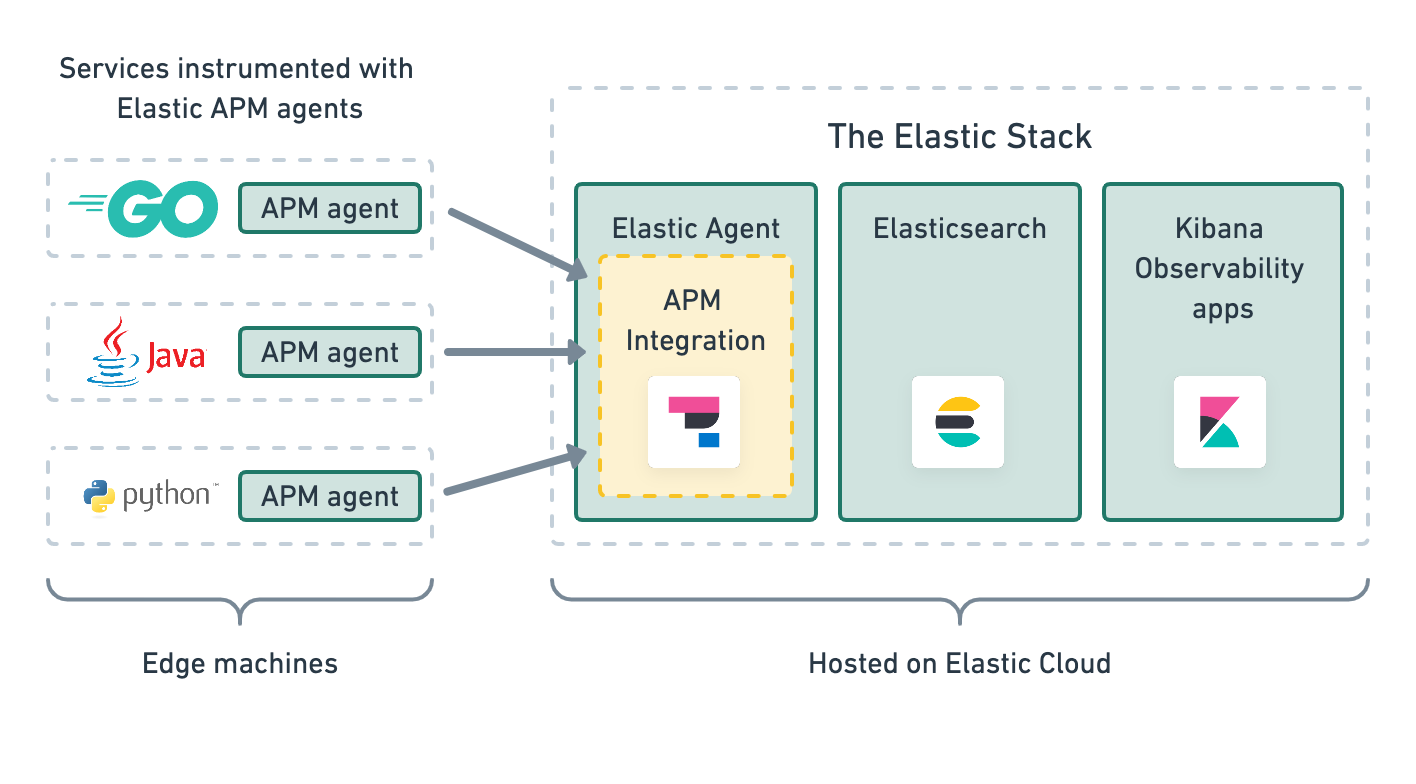
* ELK APM: https://www.elastic.co/observability/application-performance-monitoring
## Metrics: 提供系統各個維度的量化指標
* promethues: https://prometheus.io/docs/concepts/metric_types/
* prometheus-net: https://github.com/prometheus-net/prometheus-net
* Counter: 不斷累加的數值, ex: uptime, traffic
* Gauge: 上下波動的數值, 表示瞬間狀態 ex: cpu, memory
* Histogram: 分析資料分佈的直方圖 ex: Request per second, Response time
* Summary: 分析資料分佈的摘要 ex: 0.5 中位數, 0.95分位數
# trust dev https
```shell=
dotnet dev-certs https --trust
dotnet dev-certs https --clean
dotnet add package Elastic.Apm.NetCoreAll --version 1.14.1
dotnet add package Elastic.Apm.AspNetCore --version 1.14.1
dotnet add package Elastic.Apm.EntityFrameworkCore --version 1.14.1
dotnet add package Elastic.Apm --version 1.14.1
```
# ELK
* docker images: https://www.docker.elastic.co/
# APM
* apm docs: https://www.elastic.co/guide/en/apm/guide/7.17/index.html
* dotnet agent: https://www.elastic.co/guide/en/apm/agent/dotnet/1.12/setup.html
* 參數: https://www.elastic.co/guide/en/apm/agent/dotnet/current/config-all-options-summary.html
 Sign in with Wallet
Connect another wallet
Sign in with Wallet
Connect another wallet