###### tags: `cycu` `walsin` `elastic` `grafana`
---
author: 黃怡萍
---
# 利用 log 畫出日常觀測儀表板
slide: https://hackmd.io/@xDPShmd5RuSn8AzgAUwB5A/BkyjLBAFP
---

- 黃怡萍
- 產品開發部 副理
- yipein@innovue.ltd
- https://www.innovue.ltd
---
### Agenda
- 工具介紹
- elasticsearch
- cerebro
- grafana
- docker
- 環境安裝與部署
- 實作
- import data to elasticsearch
- 製作儀表板
---

- https://www.elastic.co/
---
- [What is Elasticsearch?](https://www.elastic.co/guide/en/elasticsearch/reference/current/elasticsearch-intro.html)
- 分散式資料庫
- 海量資料檢索快速
- 檢索引擎
- 分析引擎
- 資料儲存格式: JSON
---
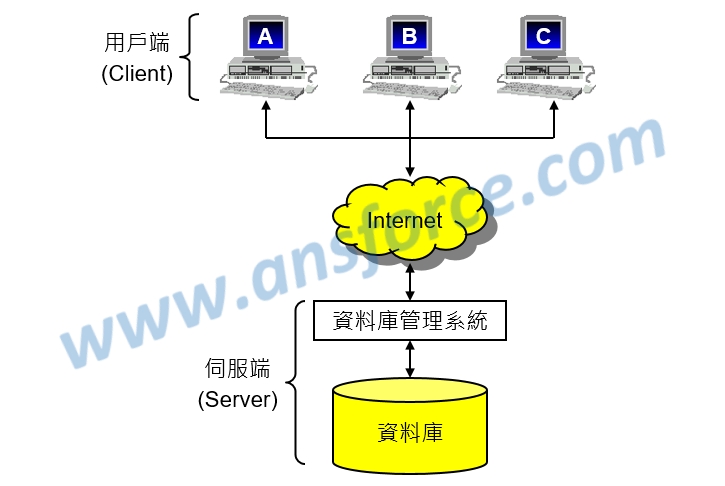
### 集中式資料庫系統 (Centralized Database, CDB)
---
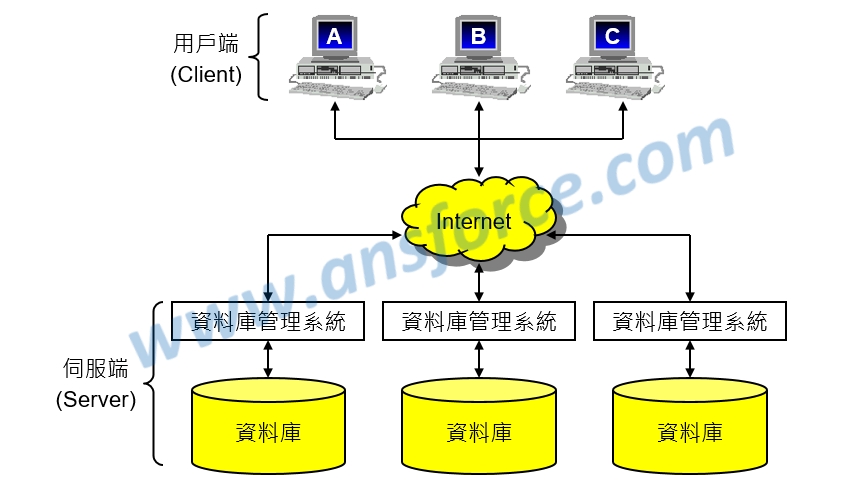
### 分散式資料庫系統(Distributed Database, DDB)
---
### 分散式資料庫系統優點
- 增加資料庫系統的執行效能
- 提高可靠性和可用性
- 更多的彈性和擴充性
---
### 分散式資料庫系統缺點
- 系統複雜成本高
- 缺乏標準維護不易
---
### JSON 格式
* JSON(JavaScript Object Notation,JavaScript物件表示法)
```json=
{
"user" : "kimchy",
"post_date" : "2009-11-15T14:12:12",
"message" : "trying out Elasticsearch"
}
```
---
### cerebro
- cerebro is an open source(MIT License) `elasticsearch web admin tool` built using Scala, Play Framework, AngularJS and Bootstrap.
- https://github.com/lmenezes/cerebro
---

- https://grafana.com/grafana/
---
- Grafana 是一个通用的可視化圖表工具
- 支援多種資料庫來源
- 通過 Dashboard 組織及管理資料的可視化圖表
- 支援圖表權限管理
---

- https://www.docker.com/
---
- 一致性的發佈環境
- 可攜性發佈
- 在同一台機器運行更多的工作
- 基礎設施即代碼(Infrastructure as Code)及軟體定義網路
- reference
- https://tw.alphacamp.co/blog/docker-introduction
---
### 環境安裝與部署
---
- download `docker-compose.yml` file from github
- https://github.com/yipein/estools
- save file to `walsin` folder in `Documents`
---
* 開啟 `Windows Powershell` 應用程式
```shell=
# switch folder to walsin
cd .\Documents\walsin
# list files
dir
# distribute servies
docker-compose up -d
```
---
### 安裝過程
```shell=
yipein@Anneys-MBP> ~/gitRepo/dockers/walsin > docker-compose up -d
Pulling es (docker.elastic.co/elasticsearch/elasticsearch:7.10.0)...
7.10.0: Pulling from elasticsearch/elasticsearch
e320e40c33f8: Extracting [====> ] 8.356MB/84.39MB
be0367056981: Download complete
67e849725737: Download complete
2689ab201ca3: Downloading [===========> ] 82.65MB/345.7MB
054ab54cebfb: Download complete
4e6ca8ea18d1: Download complete
033f0d2daef0: Download complete
3e873ca10c18: Download complete
19c868cd4818: Download complete
```
---
### 完成安裝
```shell=
latest: Pulling from lmenezes/cerebro
8559a31e96f4: Pull complete
65306eca6b8e: Pull complete
ddbf88050b6e: Pull complete
0cb03c61bf26: Pull complete
872b276b18ca: Pull complete
Digest: sha256:229e776839833fcfb21dac39bb2bd89d59fdb8cdb322036cb15e6cba6e4e5199
Status: Downloaded newer image for lmenezes/cerebro:latest
Creating walsin_grafana_1 ... done
Creating walsin_cerebro_1 ... done
Creating walsin_es_1 ... done
yipein@Anneys-MBP> ~/gitRepo/dockers/walsin>
```
---
### 確認是否完成安裝
* cerebro: http://localhost:9000
* elastic: http://localhost:9200
* grafana: http://localhost:3000
* uid/pwd: `admin` / `12345678`
---
### cerebro connect to elastic
- input: `http://es:9200`
---
## import data to elastic
- open `cerebro` and connect to `http://es:9200`
- click `rest` tab on top menu bar
1. `_bulk`
2. change method from `GET` to `POST`
3. copy text from `sample-data-batchid.json`, `sample-data-telemetry.json` and paste to `textarea`
---
## check data
- click `overview` tab on the top menu
- `sample-statistics-2020.11` index
---
## 資料設計
- `_id`: 唯一值
- `timestamp`: 保留每筆資料的存入時間
---
## ES 展示
- insert doc
- delete doc
- query
- sort
- aggregation
---
## Sample 資料分析
```json=
{
"name": "meter01",
"location": "xinzhuang",
"from": "log",
"value": 995,
"mpm": 16,
"max": 995,
"min": 979,
"start": 979,
"end": 995,
"doc_count": 50,
"timestamp": "2020-11-22T15:59:00Z",
"received": "2020-11-22T15:59:00Z",
"reset": false,
"previousvalue": 979,
// -- from mes system
"batchid": "M170505039",
"pid": "CS05170512230303",
"pnum": "SS732401",
"pdesc": "61/2.3mm(250mm2)圓壓軟銅絞線",
"expectwidth": 3000,
"actualwidth": 3030,
"remainingmeter": 30,
"mesmpm": 15,
"weght": 6682.76,
"IsWorkingHours": true
}
```
---
## 製作儀表板
- grafana: `http://localhost:3000`
- Add data source
- Add dashboard
---
## Add data source
- Type: `Elasticsearch`
- Name: `sample-st`
- HTTP
- Url: `http://es:9200`
- Elasticsearch details
- Index name: `sample-statistics-2020.11`
- Pattern: `No pattern`
- Time field name: `received`
- Version: `7.0+`
---
## Add dashboard
- 計米速度統計圖
- 平均製米速度
---
### Add `計米速度統計圖` - 1
- Add Panel
- Quey
- `+mpm:>=0 +mpm:<30`
- Metric
- `Average`
- `value`
- Group by
- `Date Histogram`
- `received`
- inverval: `1m`
- Alias: `計米 (m)`
---
### Add `計米速度統計圖` - 2
- Settings
- Visualization
- Graph
- Display
- Stacking and null value: `null as zero`
- Legend
- Axes
---
### Add `計米速度統計圖` - 3
- Quey
- `+mpm:>=0 +mpm:<30`
- Metric
- `Average`
- `mpm`
- Group by
- `Date Histogram`
- `received`
- inverval: `1m`
- Alias: `速度 (m/min)`
---
### Add `計米速度統計圖` - 4
- Series overrides
- Alias or regex:
- `速度 (m/min)`
- `Y-axis`: 2
- Axes
- Left Y and Right Y: `Lebel`, `Unit`
---
### Add `平均製米速度` -1
- Add Panel
- Metric
- `Average`
- `mpm`
- Group by
- `Date Histogram`
- `received`
- inverval: `1m`
---
### Add `平均製米速度` - 2
- Settings
- Visualization
- Gauge
- Display
- enable `Show threshold labels`
- Field/Standard
- Unit: `Length -> meter`
- Field/Thresholds
---
### Thank you! :sheep:
{"metaMigratedAt":"2023-06-15T15:47:12.827Z","metaMigratedFrom":"Content","title":"利用 log 畫出日常觀測儀表板","breaks":true,"contributors":"[{\"id\":\"c433d286-6779-46e4-a7f0-0ce0014c01e4\",\"add\":17781,\"del\":6025}]"}