#### Jargon Busting (20-30 min total, 5 min in breakout room)
This exercise is an opportunity to gain a firmer grasp on the concepts around data, code or software development in libraries.
1. We'll group you into breakout rooms of 3-4.
2. Select someone in your room to take notes in the etherpad for your group.
3. Talk for **three minutes** on any terms, phrases, or ideas around code, data or technical aspects of development in libraries that you've come across and perhaps feel you should know better.
4. Each group adds 3 terms, phrases or ideas to the class etherpad.
5. Feel free to provide definitions or explanations on other groups terms if you are knowledgeable about them. (The idea is we can build a glossary for the class).
6. The instructors will group the terms on the etherpad and facilitate a discussion about what we will cover today and where you can go for help on those things we won't cover.
---
# Tidy Data in Spreadsheets
Lesson: <https://librarycarpentry.org/lc-spreadsheets/00-intro/index.html>
---
* Good **data organization** is the foundation of much of our day-to-day work in research.
* Most **librarians** have data or do data entry in spreadsheets.
* Spreadsheet programs are very **useful graphical interfaces** for designing data tables
---
Spreadsheets encompass a lot of the things we need to be able to do as librarians. We can use them for:
- Data entry
- Organizing data
- Sub-setting and sorting data
- Statistics
- Plotting
---
### In this lesson, we will look at:
* Good data entry practices - formatting data tables in spreadsheets
* How to avoid common formatting mistakes
* Dates as data - beware!
* Basic quality control and data manipulation in spreadsheets
---
**Much of your time when you’re producing a report will be spent in this ‘data wrangling’ stage.** It’s not the most fun, but it’s necessary. We’ll teach you how to think about data organization and some practices for more effective data wrangling.
---
## What this lesson will not teach you
- How to do *statistics* in a spreadsheet
- How to do *plotting* in a spreadsheet
- How to *write code* in spreadsheet programs
---

If you're looking to do this, a good reference is
[Head First Excel by O'Reilly Media](https://www.amazon.com/Head-First-Excel-learners-spreadsheets/dp/0596807694).
---
### Spreadsheet programs
Commands may differ a bit between programs, but the general idea is the same.
- LibreOffice
- Microsoft Excel
- Gnumeric
- OpenOffice.org
- Google Sheets
Note:
In this lesson, we will assume that you are most likely using Excel as your primary spreadsheet program - there are others (gnumeric, Calc from OpenOffice), and their functionality is similar, but Excel is the package you're most likely to have available on your work computer.
---
#### How many people have used spreadsheets in their work?
Respond using yes or no in Zoom. Go to the `Participants` panel and select `yes` or `no`

---
**In the etherpad, answer these questions (5 min)**
<https://pad.carpentries.org/2021-tidy-data>
1. What kind of things do you do in spreadsheets?
1. Which ones do you think spreadsheets are good for?
1. Spreadsheets can be very useful, but they can also be frustrating and even sometimes give us incorrect results. What are some things that you’ve accidentally done in a spreadsheet, or have been frustrated that you can’t do easily?
---
Tim:
1. collecting data, managing data, sorting and totallying data,
2. collecting data, sorting
3. easy to make mistakes across ranges, easy to lose values, multiple spreadsheet tabs - inheriting data from someeone
---
**In this lesson, we’re going to talk about:**
* Formatting data tables in spreadsheets
* Formatting problems
* Dates as data
* Basic quality control and data manipulation in spreadsheets
* Exporting data out of a spreadsheet
---
**Common mistakes**
* Using spreadsheet like notebook
* Rely on context
* Notes in margins
* Spatial layout of data & fields to convey information
* Highlighting and colors to also convey information
Note:
* As humans we can interpret these things, but computers can't see how data fits together
* Computers are very literal
---
Using the **power of computers**, we can manage and analyze data in much more effective and faster ways, but to use that power, we have to **set up our data for the computer to be able to understand it** (computers are very literal).
---
* It is critical to set up **well-formatted tables** from outset of a project
* Data organization is foundational to your work
* Makes analysis easier and less burdensome (manual)
* Think about your future collaborators (you in 3 weeks)
---
**Keeping track of analysis**
* Your data will change over time as you work with it
* It is good practice to not edit the raw or original data (**create a copy**)
* Keep track of the steps you took to clean up your data (we recommend in a text file stored in same folder as data, but a tab in your spreadsheet will also work)
* Use a README text file describing your data & what you've done to it, see <https://data.research.cornell.edu/content/readme> for a good guide
---
**Example of using spreadsheet tab notes**

**Remember this during your upcoming exercise!**
---
**The cardinal rules of using spreadsheet programs for data:**
1. Put all your **variables in columns** - the thing you're measuring, like 'length' or 'attendance'.
2. Put each **observation in its own row**.
3. **Don't combine multiple pieces of information in one cell**. Sometimes it just seems like one thing, but think if that's the only way you'll want to be able to use or sort that data.
4. **Leave the raw data raw** - don't mess with it!
5. Export the cleaned data to a **text based format** like CSV. This ensures that anyone can use the data, and is the format required by most data repositories.
---

Following three rules makes a dataset tidy:
* variables are in columns,
* observations are in rows,
* and values are in cells.
---
**Our sample data**

Note:
For example, we have data from attendance and instruction for previous research data management workshops. Different people have entered data in to a spreadsheet. They keep track of things like date, number of attendees, and who delivered the workshop.
the **problem is that the number of attendees of different types (post-graduate researcher (PGR), post-doctoral research associate (PDRA)**, and other) are in the same field. So if they wanted to look at attendance by post-graduate researchers, it would be hard to set up the data to do this. If instead we put attendee categories in different columns, you can see that it would be much easier.
---
**Tidied Data**

The rule of thumb, when setting up a data table, is columns = variables, rows = observations, cells = data (values).
**What else could we do to make this even more tidy?**
---
**Another Example**
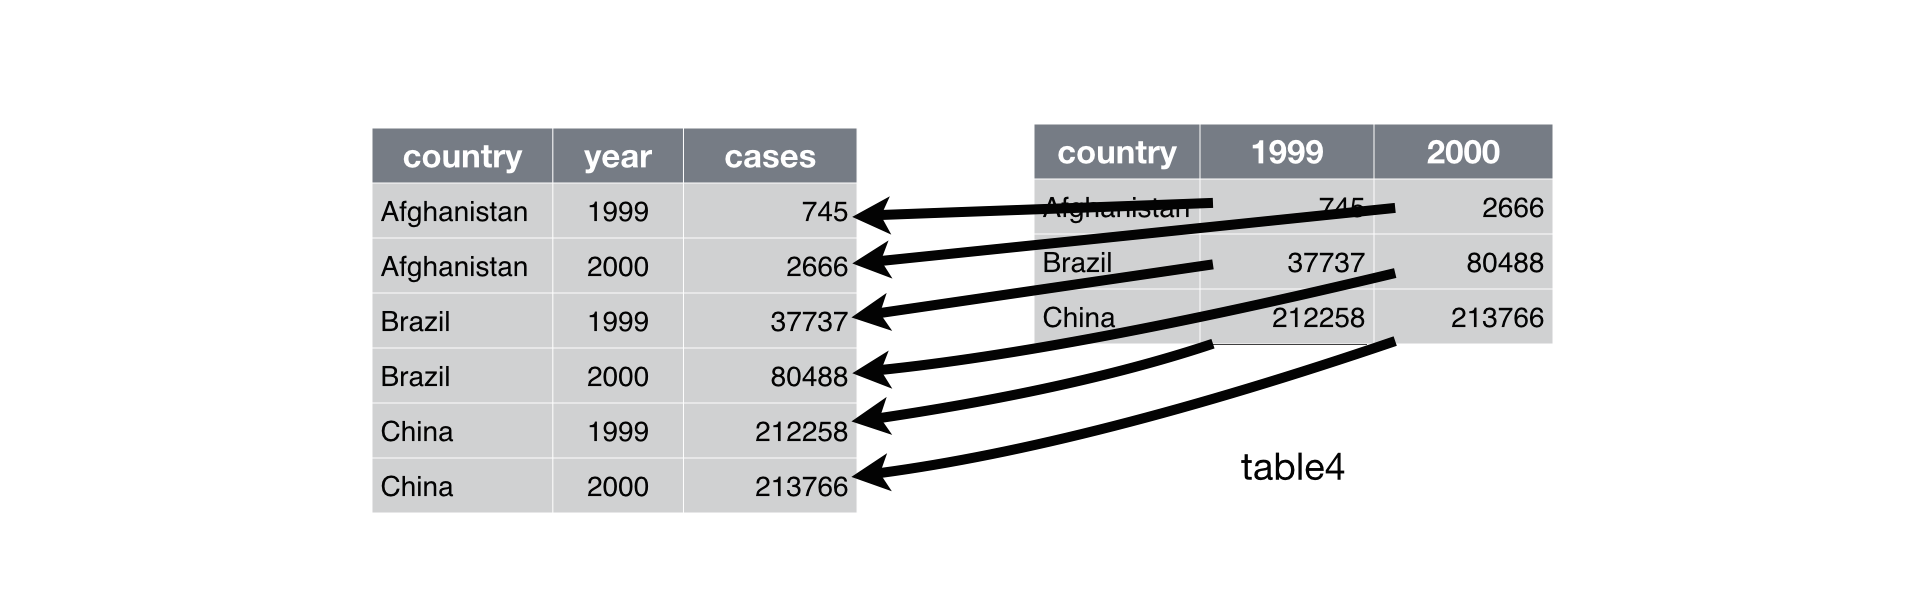
A common problem is when column names are not variables but values.
---
**Why tidy data?**
>"There’s a general advantage to picking one consistent way of storing data. If you have a consistent data structure, it’s easier to learn the tools that work with it because they have an underlying uniformity."
-- R for Data Science <https://r4ds.had.co.nz/tidy-data.html>
---

Though starting in R, tidy data principles are applied to many tools. Above from Tableau, but you can search for 'tidy data in ...' to usually get some help on the tool you are working in.
---
**Exercise (30 min)**
We're going to take a messy version of some library training data and clean it up in breakout rooms.
1. First download <https://github.com/LibraryCarpentry/lc-spreadsheets/blob/gh-pages/data/training_attendance.xlsx>
- You may also make a copy of this google sheet <https://docs.google.com/spreadsheets/d/12VjzSSz4aIF5Dv6nbw_y3KZjrlfClw1SWa3F7gqULLk/copy#gid=1445701170>
3. Open up the data in a spreadsheet program.
4. You can see that there are three tabs. Various people have recorded training attendance statistics over 2016 and 2017, and they have kept track of the data in their own way. Now you're being asked to evaluate the training programme and you want to be able to start doing statistics with the data.
5. With your breakout rooms, work on the messy data so that a computer will be able to understand it.
6. Choose someone who will **drive the compute and share their screen**, **someone to record the problems you encounter & the changes you made** and others to provide direction and advise on what needs to be done.
7. Clean up the 2016 and 2017 tabs, and put them all together in a separate spreadsheet.
8. After you go through this exercise, the note taker will add the problems you encountered to the etherpad. We can then discuss as a group what you think was wrong with this data and how you fixed it.
*Do not forget of our first piece of advice: create a new file for the cleaned data, and **never modify the original (raw) data**.*
---
## Formatting problems
<https://librarycarpentry.org/lc-spreadsheets/02-common-mistakes/index.html>
---
**Further reading**:
>Karl W. Broman & Kara H. Woo (2018) Data Organization in Spreadsheets, The American Statistician, 72:1, 2-10, DOI: [10.1080/00031305.2017.1375989](https://doi.org/10.1080/00031305.2017.1375989)
Many of the same points are covered in this article.
---
### Common missing data values

---
## Dates as Data
* Describe how dates are stored and formatted in spreadsheets.
* Describe the advantages of alternative date formatting in spreadsheets.
* Demonstrate best practices for entering dates in spreadsheets.
* Do exercise 1 & 2 together in breakout rooms
---
* Dates in spreadsheets are often stored in one column.
* This seems the most natural way to record dates, it actually is not often a good practice.
* A spreadsheet application will display the dates in seemingly correct way (for the human eye)
* But how it actually handles and stores the dates may be problematic.
---
## Auto-formatting Dates
* Excel will automatically format dates on entering and on existing datasets
* Recent example: <https://www.theverge.com/2020/8/6/21355674/human-genes-rename-microsoft-excel-misreading-dates>
---
**Lots of date formats in spreadsheets**
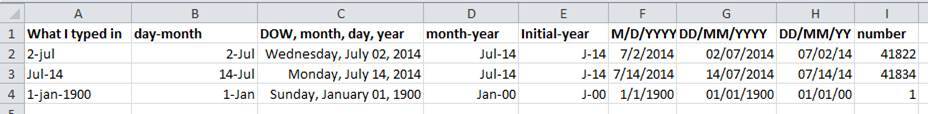
* Allow ambiguity to creep into your data.
* Data should be unambiguous
---
### Preferred date format: keep them separated
* Safer to save dates with MONTH, DAY and YEAR in separate columns.
---
### A bit about how dates are stored in Excel
* Stored as numbers
* Counts days from Dec. 31, 1899
* This presents problems for historical dates & a good reason to store dates as parts
* Can be useful if we want to add X number of days to a date
---
**Exercises: Pulling out dates as parts & `Save as`** (15 min)
Working in your breakout groups, this time a different person shares their screen. The others in the room gives direction. When we come back as a group
---
**Exercise 1: Pull out date parts**
Challenge: pulling month, day and year out of dates
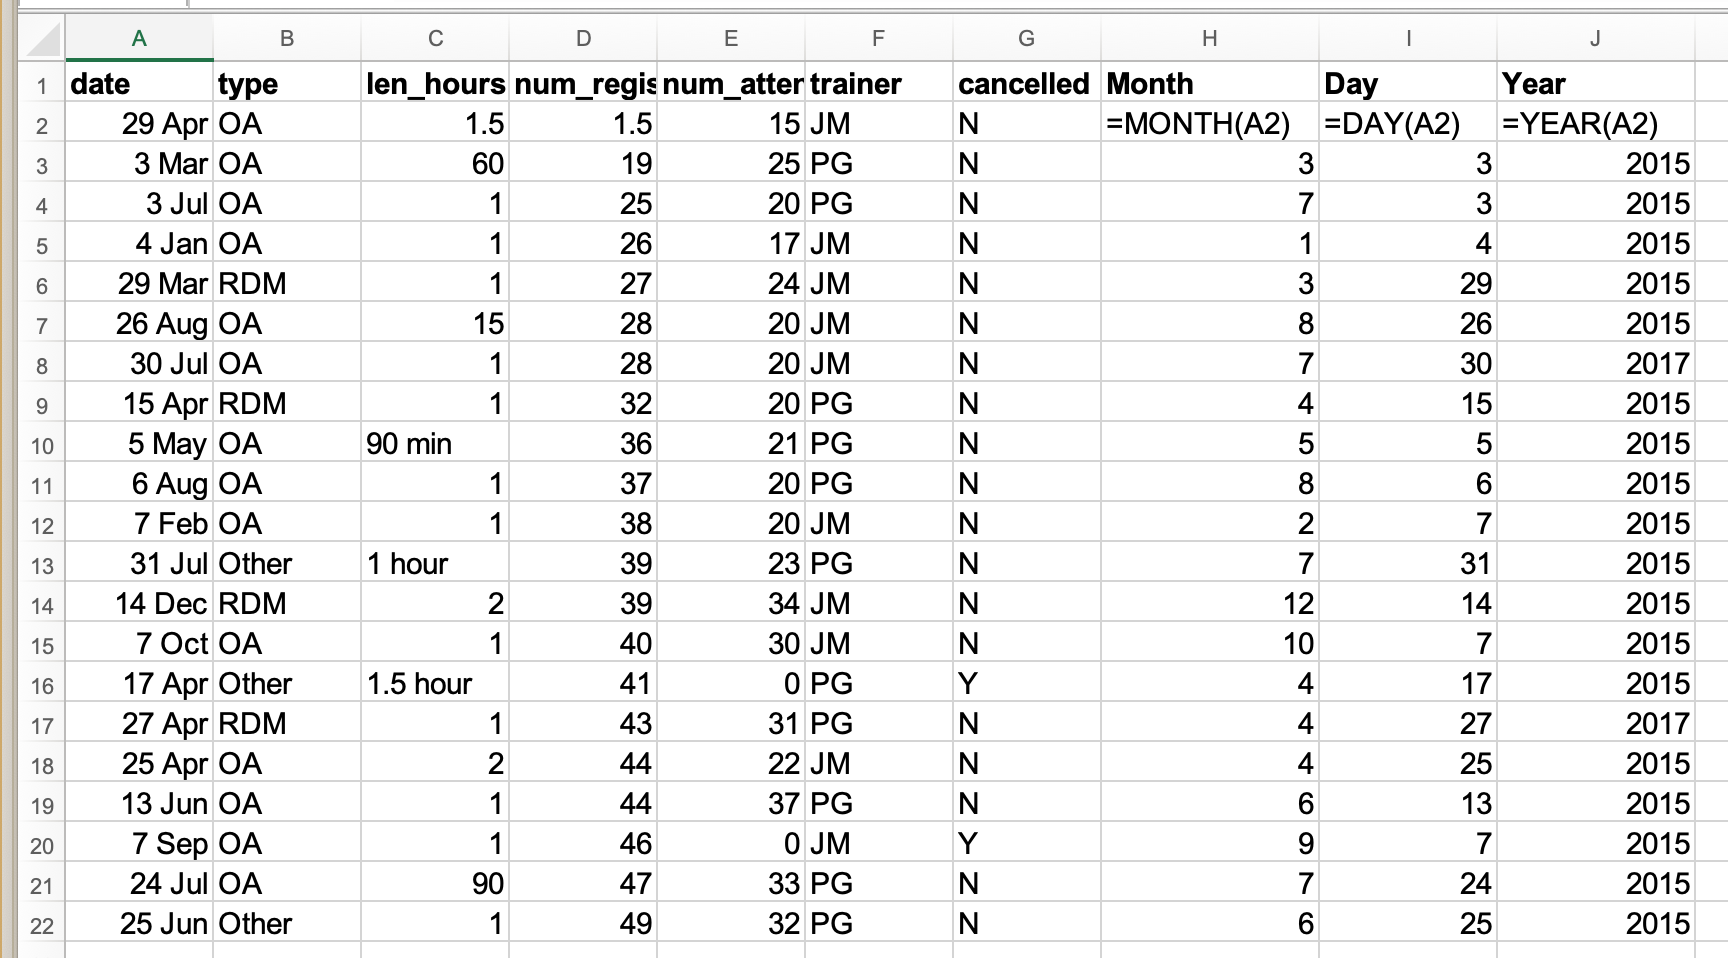
- In the `Dates` tab of your Excel file we summarized training data from 2015. There's a `date` column.
- Let’s extract month, day and year from the date to three new columns. For this we can use the built in Excel functions
```
=MONTH(A2)
=DAY(A2)
=YEAR(A2)
```
(Make sure the new column is formatted as a number and not as a date. Change the function to correspond to each row - i.e., =MONTH(A3), =DAY(A3), =YEAR(A3) for the next row.
---
**Exercise 2: Save as CSV & Opening**
What happens to the dates in the `dates` tab of our workbook if we save this sheet in Excel (in `csv` format) and then open the file in a plain text editor (like TextEdit or Notepad)? What happens to the dates if we then open the `csv` file in Excel?
**Follow these instructions**:
1. Click to the `dates` tab of the workbook and double-click on any of the values in the `Date collected` column. Notice that most of the dates display with the year 2015 and two are 2017.
2. Select `File -> Save As` in Excel and in the drop down menu for file format select `CSV UTF-8 (Comma delimited) (.csv)`. Click `Save`.
3. You will see a pop-up that says "This workbook cannot be saved in the selected file format because it contains multiple sheets." Choose `Save Active Sheet`.
4. Navigate to the file in your finder application. Right click and select `Open With`. Choose a plain text editor application and view the file. Notice that the dates display as month/day without any year information.
5. Now right click on the file again and open with Excel. Notice that the dates display with the current year, not 2015.
6. As you can see, exporting data from Excel and then importing it back into Excel fundamentally changed the data once again!
---
**Solution: Pulling date parts**
You can see that even though you wanted the year to be 2015 for all entries, your spreadsheet program interpreted two entries as 2017, the year the data was entered, not the year of the workshop.

---
## Basic QA
* Demo of how it works in Excel <https://librarycarpentry.org/lc-spreadsheets/04-quality-control/index.html>
---
### Exercise QA
We can’t have half a person attending a workshop, so let’s try this out by setting the num_registered column in our spreadsheet to only allow whole numbers between 1 and 100.
1. In the Dates sheet, Select the `num_registered` column
2. On the Data tab select Data Validation
3. In the Allow box select Whole number
4. Set the minimum and maximum values to 1 and 100.
5. Now let’s try entering a new value in the num_registered column that isn’t a valid class size. The spreadsheet stops us from entering the wrong value and asks us if we would like to try again.
---
**Exporting data**
Storing the data you’re going to work with for your analyses in Excel default file format (*.xls or *.xlsx - depending on the Excel version) is a bad idea. Why?
<https://librarycarpentry.org/lc-spreadsheets/05-exporting-data/index.html>
---
**Caveats to exporting data**
Look at the example in the lesson:
<https://librarycarpentry.org/lc-spreadsheets/06-data-formats-caveats/index.html>
---
## File naming & formatting (time permitting)
<https://librarycarpentry.org/lc-overview/06-file-naming-formatting/index.html>
---
## Exercise Reflection on Using What We've Learned
In your breakout rooms, reflect on the workshop with each other and write on the ether pad how they would use what they learned in their lives/jobs? Then you all gather in the main room and someone goes over what is written in the Etherpad. We'll discuss as a group.
---
## On tap for next week
* Open Refine with Lisa McAulay
---
Return to Etherpad to take feedback survey.
<https://pad.carpentries.org/2021-tidy-data>
{"metaMigratedAt":"2023-06-14T17:49:58.859Z","metaMigratedFrom":"YAML","title":"Tidy Data Spreadsheets","breaks":true,"slideOptions":"{\"transition\":\"slide\",\"theme\":\"beige\"}","contributors":"[{\"id\":\"1421b929-3417-4b58-b481-d440da17fe5d\",\"add\":26351,\"del\":10500}]"}