# Omnitrace - Performance Analysis Tools for AMD GPUs, CRAY User Group Tutorial 2024
--------------------------------------------------------------
These exercises are based on the AMD training project in https://github.com/amd/HPCTrainingExamples.
You can clone it to your home folder as:
```
git clone https://github.com/amd/HPCTrainingExamples
```
# Rocprof
Setup environment
```bash
salloc --cpus-per-task=8 --mem=0 --ntasks-per-node=4
module load rocm
```
Download examples repo and navigate to the `HIPIFY` exercises.
```bash
cd ~/HPCTrainingExamples/HIPIFY/mini-nbody/hip/
```
Update the bash scripts with `$ROCM_PATH`:
```bash
sed -i 's/\/opt\/rocm/${ROCM_PATH}/g' *.sh
```
Compile all:
```bash
./HIP-nbody-orig.sh
```
or compile and run one case:
```bash
hipcc -I../ -DSHMOO nbody-orig.cpp -o nbody-orig
```
Run `rocprof` on nbody-orig to obtain hotspots list:
```bash
rocprof --stats nbody-orig 65536
```
Check `results.csv` to find, for each invocation of each kernel, details such as grid size (`grd`), workgroup size (`wgr`), LDS used (`lds`), scratch used if register spilling happened (`scr`), number of SGPRs and VGPRs used, etc. Note that grid size is equal to the total number of work-items, not the number of work groups. This is the output that is useful if you allocate shared memory dynamically, for instance.
```bash
cat results.csv
```
Check the statistics result file, one line per kernel, sorted in descending order of durations.
```bash
cat results.stats.csv
```
Using `--basenames on` will show only kernel names without their parameters.
```bash
rocprof --stats --basenames on nbody-orig 65536
```
Check the statistics result file, one line per kernel, sorted in descending order of durations
```bash
cat results.stats.csv
```
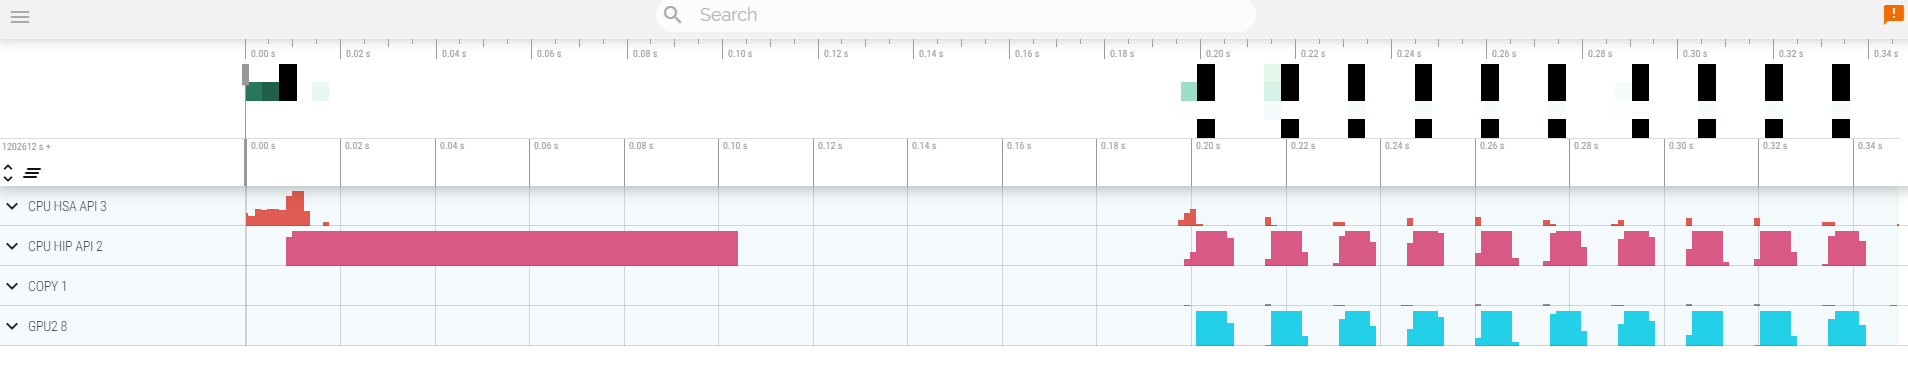
Trace HIP, GPU and Copy activity with `--hip-trace`. This produces a results.json file which can be downloaded to your workstation and viewed in Perfetto UI. This JSON file contains the timeline trace for this application, but shows only GPU, Copy and HIP API activity.
```bash
rocprof --hip-trace nbody-orig 65536
```
One of the outputs of the `--hip-trace` option is the file `results.hip_stats.csv` which lists the HIP API calls and their durations, sorted in descending order. This can be useful to find HIP API calls that may be bottlenecks.
```bash
cat results.hip_stats.csv
```
Profile the HSA API also by adding the `--hsa-trace` option. This is useful if you are profiling OpenMP target offload code, for instance, as the compiler implements all GPU offloading via the HSA layer.
```bash
rocprof --hip-trace --hsa-trace nbody-orig 65536
```
Check the new file `results.hsa_stats.csv` which contains the statistics information for HSA calls.
```bash
cat results.hsa_stats.csv
```
On your laptop, download `results.json`:
```bash
scp scp://USER@aac1.amd.com:<PORT>/~/HPCTrainingExamples/HIPIFY/mini-nbody/hip/results.json ./
```
Open a browser and go to [https://ui.perfetto.dev/](https://ui.perfetto.dev/).
Click on `Open trace file` in the top left corner.
Navigate to the `results.json` you just downloaded.
Use WASD to navigate the GUI
Read about hardware counters available for the GPU on this system (look for gfx90a section).
```bash
less $ROCM_PATH/lib/rocprofiler/gfx_metrics.xml
```
Create a `rocprof_counters.txt` file with the counters you would like to collect:
```bash
vi rocprof_counters.txt
```
Content for `rocprof_counters.txt`:
```bash
pmc : Wavefronts VALUInsts
pmc : SALUInsts SFetchInsts GDSInsts
pmc : MemUnitBusy ALUStalledByLDS
```
Execute with the counters we just added:
```bash
rocprof --timestamp on -i rocprof_counters.txt nbody-orig 65536
```
You'll notice that `rocprof` runs 3 passes, one for each set of counters we have in that file.
View the contents of `rocprof_counters.csv` for the collected counter values for each invocation of each kernel.
```bash
cat rocprof_counters.csv
```
--------------------------------------------------------------
# Omnitrace
Setup environment:
```bash
module purge
module load omnitrace gcc/13
```
## Basic Omnitrace setup
List the various options and environment settings available for the `omnitrace` category:
```bash
omnitrace-avail --categories omnitrace
```
To add brief descriptions, use `-bd` option
```bash
omnitrace-avail -bd --categories omnitrace
```
Create a configuration file. This config file can then be modified to change options to see what you want in the Omnitrace profile. If you do not provide a path to the config file, it will generate one in the current directory `./omnitrace-config.cfg`.
```bash
omnitrace-avail -G ~/omnitrace.cfg
```
Alternatively, you can create an Omnitrace configuration file with description per option. Beware, this is quite verbose.
```bash
omnitrace-avail -G ~/omnitrace_all.cfg --all
```
Declare that you want to use this configuration file. Only needed if you had provided a custom path and/or filename for the config file when you created it.
```bash
export OMNITRACE_CONFIG_FILE=~/omnitrace.cfg
```
## Setup Jacobi Example
Go to the jacobi code in the examples repo:
```bash
cd ~/HPCTrainingExamples/HIP/jacobi
```
Compile the code:
```bash
make
```
Execute the binary to make sure it runs successfully:
- Note: To get rid of `Read -1, expected 4136, errno = 1` add `--mca pml ucx --mca pml_ucx_tls ib,sm,tcp,self,cuda,rocm` to the `mpirun` command line
```bash
mpirun -np 1 ./Jacobi_hip -g 1 1
```
## Dynamic Instrumentation
Run the code with omnitrace to get runtime instrumentation. Time it to see overhead of dyninst loading all libraries in the beginning. We observed that this command took about 2m30s.
```bash
mpirun -np 1 omnitrace-instrument -- ./Jacobi_hip -g 1 1
```
Check available functions to instrument using the `--print-available functions` option.
Note, the `--simulate` option will not execute the binary.
```bash
mpirun -np 1 omnitrace-instrument -v 1 --simulate --print-available functions -- ./Jacobi_hip -g 1 1
```
If you want to instrument only particular functions from that list, try the `-I` option to include only those functions:
```bash
mpirun -np 1 omnitrace-instrument -v 1 -I 'Jacobi_t::Run' 'JacobiIteration' -- ./Jacobi_hip -g 1 1
```
This should show that only those functions are instrumented:
```bash
<snip>
[omnitrace][exe] 1 instrumented funcs in JacobiIteration.hip
[omnitrace][exe] 1 instrumented funcs in JacobiRun.hip
[omnitrace][exe] 1 instrumented funcs in Jacobi_hip
[omnitrace][exe] 2 instrumented funcs in librocprofiler-register.so.0.3.0
<snip
```
## Binary Rewrite
Create instrumented binary using `omnitrace-instrument` command first. Notice that this doesn't take very long to run.
```bash
omnitrace-instrument -o ./Jacobi_hip.inst -- ./Jacobi_hip
```
Execute the new instrumented binary using the `omnitrace-run` command inside `mpirun`. Time it to see lower overhead. This is the recommended way to profile MPI applications as Omnitrace will separate the output files for each rank.
```bash
mpirun -np 1 omnitrace-run -- ./Jacobi_hip.inst -g 1 1
```
See the list of the instrumented GPU calls, turn on `OMNITRACE_PROFILE` in your `$OMNITRACE_CONFIG_FILE`.
```bash
OMNITRACE_PROFILE = true
```
Then run the instrumented binary again. This time, you will observe that it generated a few extra files. One of those has a list of instrumented GPU calls and durations of those calls.
```bash
cat omnitrace-Jacobi_hip.inst-output/<TIMESTAMP>/roctracer-0.txt
```
## Debugging omnitrace-run
If you get errors when you run an instrumented binary or when you run with dynamic instrumentation, add the following options `--monochrome -v 2 --debug` and try. This would give you more debug information to aid you in figuring out where the problem may lie.
```
mpirun -np 1 omnitrace-run --monochrome -v 1 --debug -- ./Jacobi_hip.inst -g 1 1
```
## Visualization
Copy the `perfetto-trace-0.proto` to your laptop, open the web page [https://ui.perfetto.dev/](https://ui.perfetto.dev/)
```bash
scp scp://USER@aac1.amd.com:<PORT>/~/HPCTrainingExamples/HIP/jacobi/omnitrace-Jacobi_hip.inst-output/TIMESTAMP/perfetto-trace-0.proto ./
```
Click `Open trace file` and select the `.proto` file

## Hardware Counters
See a list of all the counters for all the devices on the node:
```bash
omnitrace-avail --all
```
Declare in your configuration file:
```bash
OMNITRACE_ROCM_EVENTS = VALUUtilization,FetchSize
```
Check again:
```bash
grep OMNITRACE_ROCM_EVENTS $OMNITRACE_CONFIG_FILE
```
Run the instrumented binary, and you will observe an output file for each hardware counter specified. You should also see a row for each hardware counter in the perfetto trace generated by Omnitrace.
Note that you do not have to instrument again after making changes to the config file. Just running the instrumented binary picks up the changes you make in the config file. Ensure that the
`OMNITRACE_CONFIG_FILE` environment variable is pointing to your config file.
```bash
mpirun -np 1 omnitrace-run -- ./Jacobi_hip.inst -g 1 1
```
The output should show something like this:
```bash
[omnitrace][0][rocprof-device-0-VALUUtilization]> Outputting 'omnitrace-Jacobi_hip.inst-output/<TIMESTAMP>/rocprof-device-0-VALUUtilization-0.json'
[omnitrace][0][rocprof-device-0-VALUUtilization]> Outputting 'omnitrace-Jacobi_hip.inst-output/<TIMESTAMP>/rocprof-device-0-VALUUtilization-0.txt'
[omnitrace][0][rocprof-device-0-FetchSize]> Outputting 'omnitrace-Jacobi_hip.inst-output/<TIMESTAMP>/rocprof-device-0-FetchSize-0.json'
[omnitrace][0][rocprof-device-0-FetchSize]> Outputting 'omnitrace-Jacobi_hip.inst-output/<TIMESTAMP>/rocprof-device-0-FetchSize-0.txt'
```
If you do not want to see the details for every CPU core, modify the config file to select only what you want to see, say CPU cores 0-2 only:
```bash
OMNITRACE_SAMPLING_CPUS = 0-2
```
Now running the instrumented binary again will show significantly fewer CPU lines in the profile.
```bash
mpirun -np 1 omnitrace-run -- ./Jacobi_hip.inst -g 1 1
```
## Profiling Multiple Ranks
Run the instrumented binary with multiple ranks. You'll find multiple `perfetto-trace-*.proto` files, one for each rank.
```bash
mpirun -np 2 omnitrace-run -- ./Jacobi_hip.inst -g 2 1
```
You can visualize them separately in Perfetto, or combine them using cat and visualize them in the same Perfetto window.
```bash
cat perfetto-trace-0.proto perfetto-trace-1.proto > allprocesses.proto
```
## Sampling
Set the following in your configuration file:
```bash
OMNITRACE_USE_SAMPLING = true
OMNITRACE_SAMPLING_FREQ = 100
```
Execute the instrumented binary and visualize the perfetto trace.
```bash
mpirun -np 1 omnitrace-run -- ./Jacobi_hip.inst -g 1 1
```
Scroll down to the very bottom to see the sampling output. Those traces will be annotated with a (S) as well.
## Kernel Timings
Open the `wall_clock-0.txt` file:
```bash
cat omnitrace-Jacobi_hip.inst-output/<TIMESTAMP>/wall_clock-0.txt
```
In order to see the kernel durations aggregated in your configuration file, make sure to set in your config file or in the environment:
```bash
OMNITRACE_PROFILE = true
OMNITRACE_FLAT_PROFILE = true
```
Execute the code and check the `wall_clock-0.txt` file again. Instead of updating the config file, you can also set the environment variables to achieve the same effect.
```bash
OMNITRACE_PROFILE=true OMNITRACE_FLAT_PROFILE=true mpirun -np 1 omnitrace-run -- ./Jacobi_hip.inst -g 1 1
```
 Sign in with Wallet
Connect another wallet
Sign in with Wallet
Connect another wallet