# PyGMT v0.14.0 released
**Announcing PyGMT v0.14.0, with two new plotting methods and six new functions to access more GMT remote datasets!**
The PyGMT team is staring the New Year 🎇🎆 with **version [v0.14.0](https://www.pygmt.org/v0.14.0)** :rocket:!
**Here are the highlights** :tada::
* Bump minimum supported version to GMT>=6.4.0
* New plotting methods `Figure.hlines`/`Figure.vlines` for plotting horizontal/vertical lines on Cartesian, polar, and geographic coordinate systems
* PyArrow as an optional dependency and improved support of PyArrow data types
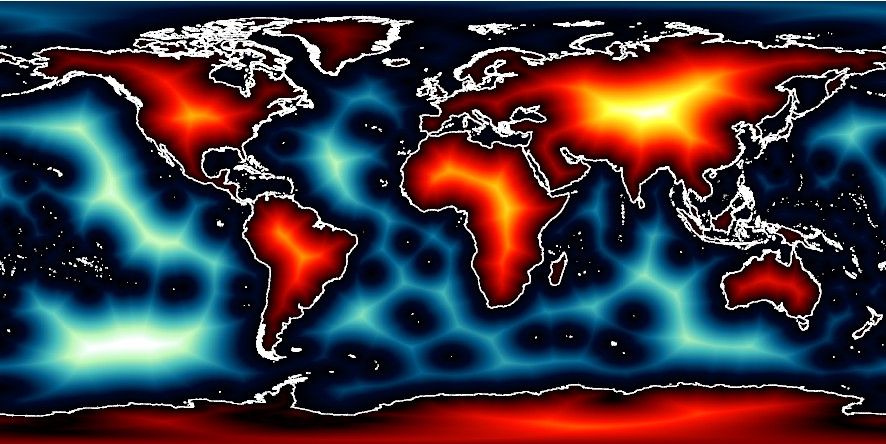
* New or extended functions to access and load more GMT remote datasets:
| Black & Blue Marble | Earth mean sea surface | Earth east-west deflection | Earth free-air anomaly |
| :---: | :---: | :---: | :---: |
| [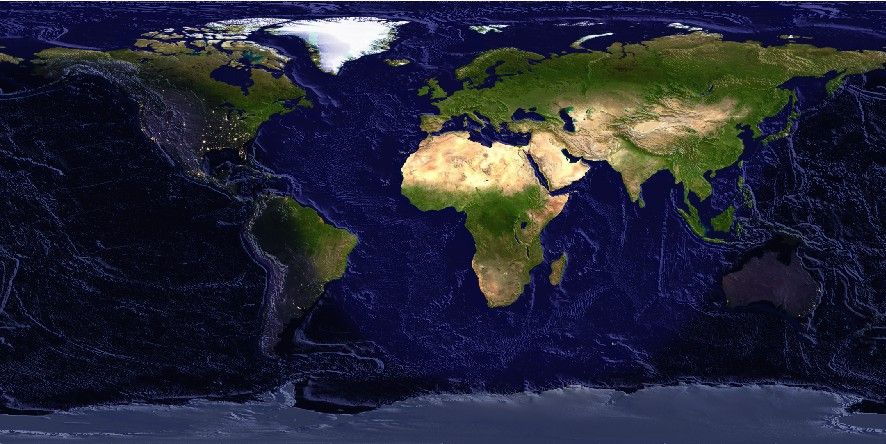](https://www.pygmt.org/v0.14.0/api/generated/pygmt.datasets.load_black_marble.html) | [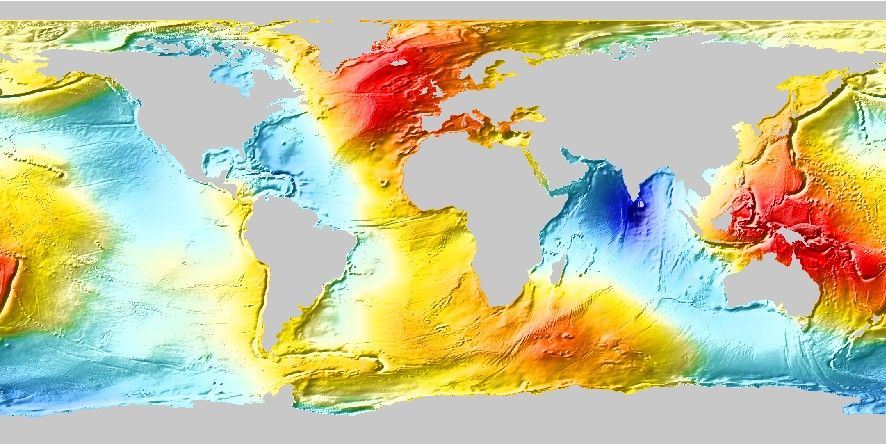](https://www.pygmt.org/v0.14.0/api/generated/pygmt.datasets.load_earth_mean_sea_surface.html) | [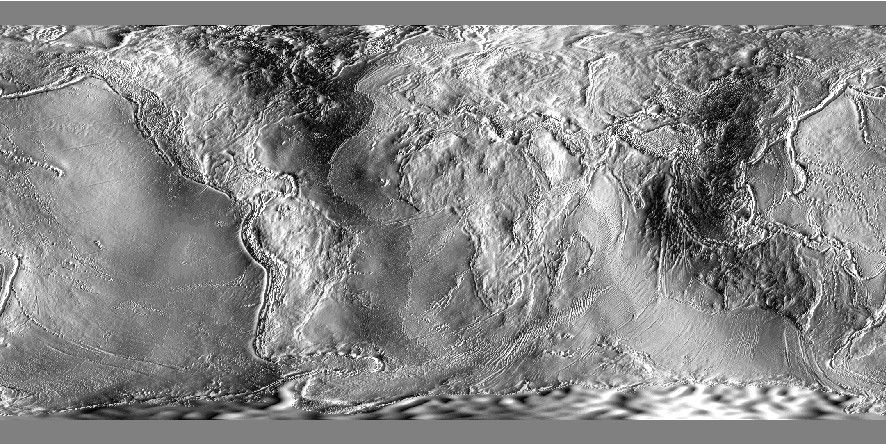](https://www.pygmt.org/v0.14.0/api/generated/pygmt.datasets.load_earth_deflection.html) | [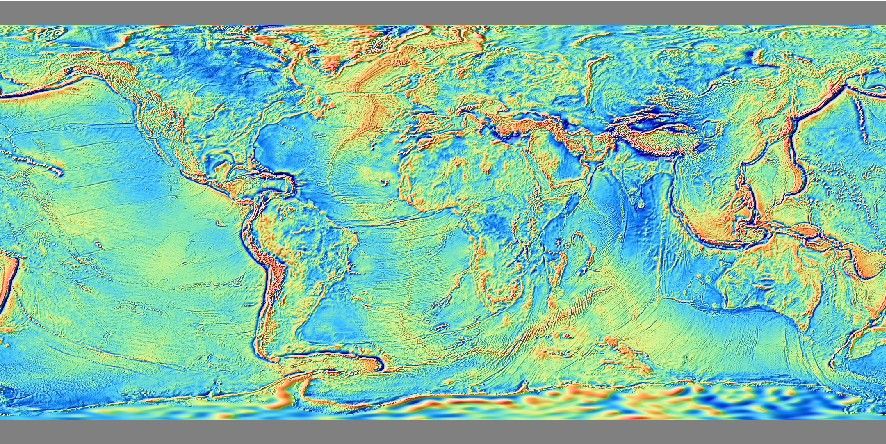](https://www.pygmt.org/v0.14.0/api/generated/pygmt.datasets.load_earth_free_air_anomaly.html) |
| Earth distance to shoreline | Earth mean dynamic topography | Earth north-south deflection | Earth free-air anomaly uncertainty |
| :---: | :---: | :---: | :---: |
| [](https://www.pygmt.org/v0.14.0/api/generated/pygmt.datasets.load_earth_dist.html) | [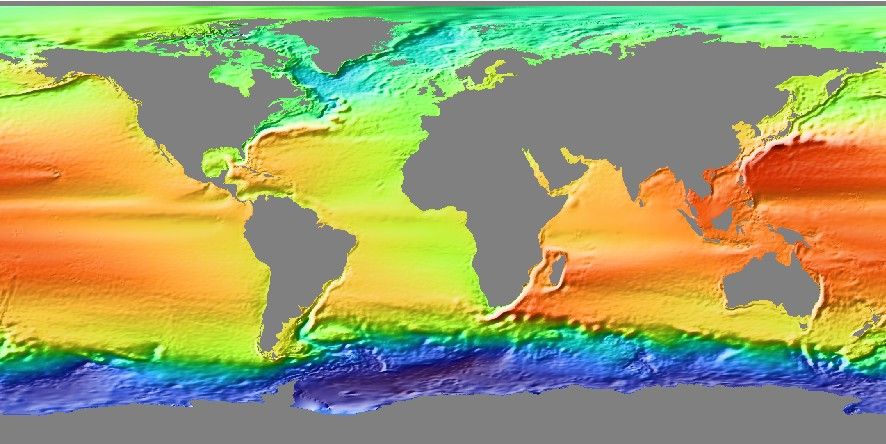](https://www.pygmt.org/v0.14.0/api/generated/pygmt.datasets.load_earth_mean_dynamic_topography.html) | [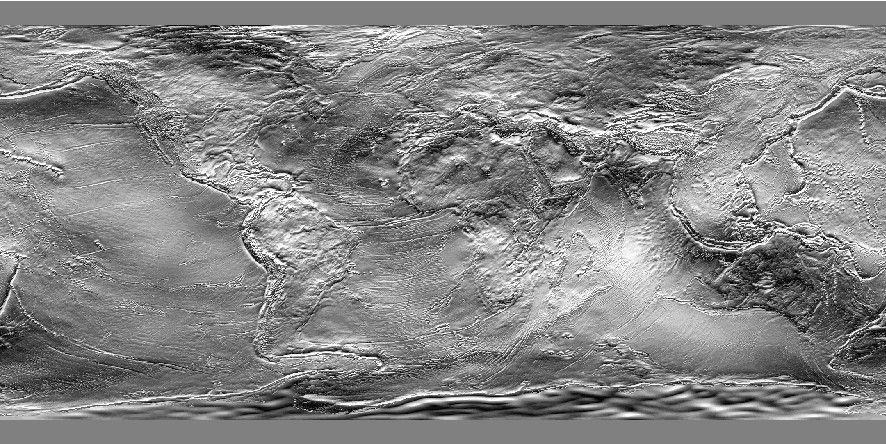](https://www.pygmt.org/v0.14.0/api/generated/pygmt.datasets.load_earth_deflection.html) | [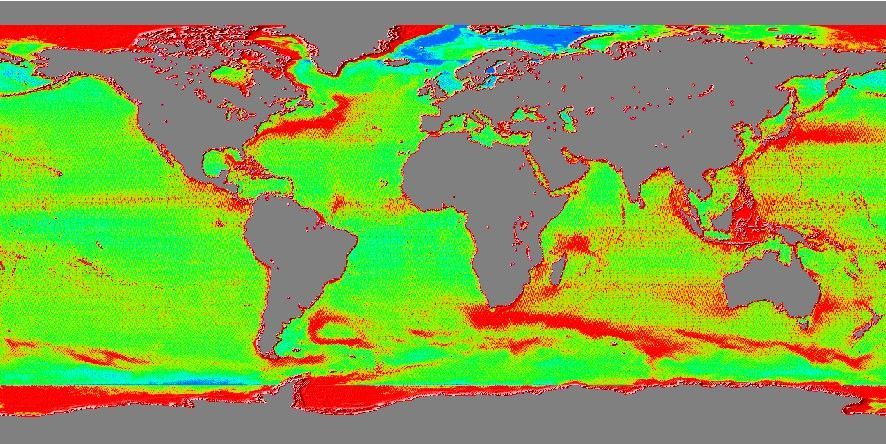](https://www.pygmt.org/v0.14.0/api/generated/pygmt.datasets.load_earth_free_air_anomaly.html)
**Nice enhancements :sparkles:**:
* `Figure.plot` and `Figure.plot3d`: New parameter `symbol` for plotting data points with varying symbols ([#1117](https://github.com/GenericMappingTools/pygmt/pull/1117), [#3559](https://github.com/GenericMappingTools/pygmt/pull/3559))
* `Figure.legend`: Support passing a StringIO object as the legend specification ([#3438](https://github.com/GenericMappingTools/pygmt/pull/3438))
Read through the [changelog](https://www.pygmt.org/v0.14.0/changes.html) for the full list of changes. Installation/upgrade :arrow_up: instructions are at https://www.pygmt.org/v0.14.0/install.html! Note that this version is cross-compatible with GMT 6.4 - 6.5, but it requires Python 3.11+ :snake:, NumPy 1.25+, pandas 2.0+, and Xarray 2023.04+ following our [support policy for GMT and other package dependencies](https://www.pygmt.org/v0.14.0/minversions.html). Go try it online at [try-gmt](https://github.com/GenericMappingTools/try-gmt) :rocket:.
As usual, please feel free to report any bugs :beetle: with the [issue template on GitHub](https://github.com/GenericMappingTools/pygmt/issues/new?assignees=&labels=bug&template=bug_report.yaml). Your feedback is what helps us to improve 🙏! For example, this bug report at issue [#3104](https://github.com/GenericMappingTools/pygmt/issues/3104) sparked off a major refactoring by @seisman at PR [#3132](https://github.com/GenericMappingTools/pygmt/pull/3132) that removed a ton of workarounds in PyGMT's codebase related to spaces and funny characters!
### :bulb: Additions and updates to Intros, Tutorials, and Gallery examples
- Tutorial for "**Plotting polygons**" ([#3593](https://github.com/GenericMappingTools/pygmt/pull/3593)) by @yvonnefroehlich
- Update dataset used for gallery example for "**GeoPandas: Plotting lines with LineString or MultiLineString geometry**" ([#3711](https://github.com/GenericMappingTools/pygmt/pull/)) by @michaelgrund
<!---
- External resources: AGU24 pre-conference workshop ["**PREWS9 Mastering Geospatial Visualizations with GMT/PyGMT**"](https://www.generic-mapping-tools.org/agu24workshop/intro.html)
--->
| Plotting polygons | GeoPandas: Plotting lines with LineString or MultiLineString geometry |
|:--:|:--:|
| [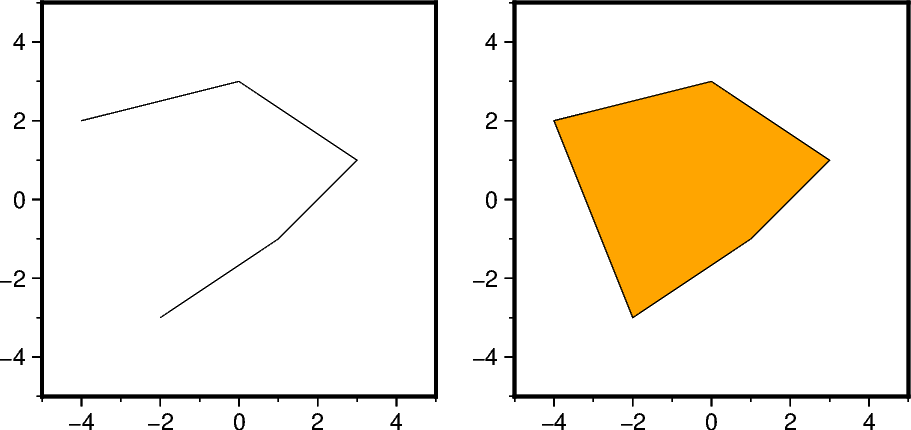](https://www.pygmt.org/v0.14.0/tutorials/basics/polygons.html) | [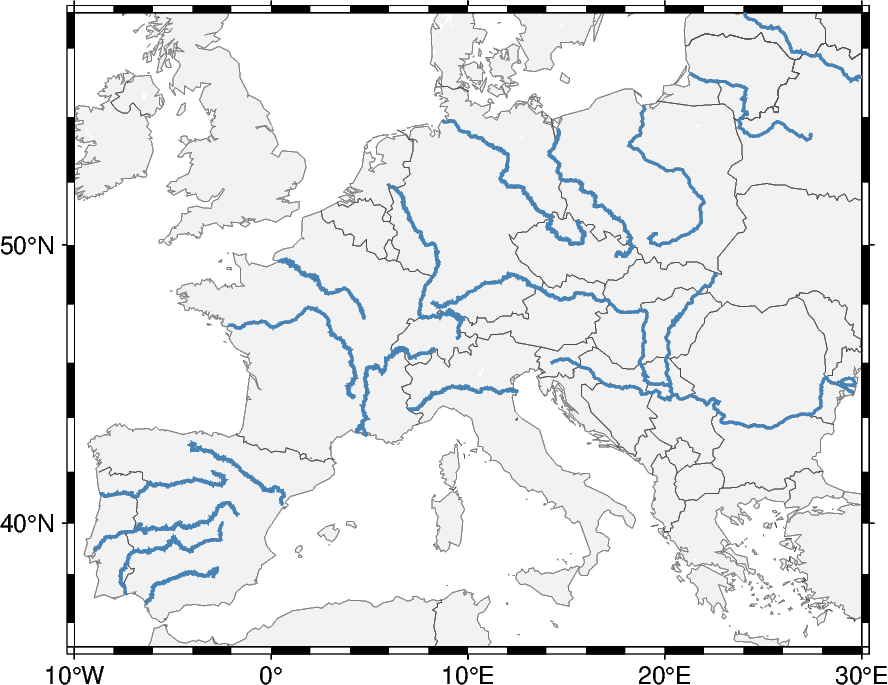](https://www.pygmt.org/v0.14.0/gallery/lines/linestrings.html) |
### :railway_track: Roadmap to future releases
While the team has been busy with AGU24, including more GMT remote datasets, and refactoring the low-level functions, there are still lots of documentation and new features we'd like to add! Check out the [good first issue label](https://github.com/GenericMappingTools/pygmt/issues?q=is%3Aopen+is%3Aissue+label%3A%22good+first+issue%22) on GitHub or the list below for things you can help with!
- Features/enhancements :sparkles:
- Wrap GMT moduls: [clip](https://github.com/GenericMappingTools/pygmt/pull/1779), [coupe](https://github.com/GenericMappingTools/pygmt/issues/2019), [earthtide](https://github.com/GenericMappingTools/pygmt/pull/1824), [fitcircle](https://github.com/GenericMappingTools/pygmt/pull/1550), [movie](https://github.com/GenericMappingTools/pygmt/issues/1347), [polar](https://github.com/GenericMappingTools/pygmt/issues/2358), and [sac](https://github.com/GenericMappingTools/pygmt/issues/2358)
- Implement high-level methods of `Figure.plot` and `Figure.plot3d` ([#2797](https://github.com/GenericMappingTools/pygmt/issues/2797)): `Figure.scatter`, `Figure.choropleth`, `Figure.errorbar`, `Figure.stem`, `Figure.fill_between`
- Implement high-level methods of `Figure.basemap` or `Figure.coast` ([#2831](https://github.com/GenericMappingTools/pygmt/issues/2831)): `Figure.scale_bar`, `Figure.directionrose`, `Figure.magneticrose`
- Documentation improvements :book:
- Add a beginner :beginner: friendly PyGMT tutorial that is a good roadmap for new GMT/PyGMT users ([#770](https://github.com/GenericMappingTools/pygmt/issues/770))
- Add a tutorial explaining the generally accepted input types ([#1268](https://github.com/GenericMappingTools/pygmt/issues/1268))
Please don't be shy to [reach out on GitHub](https://github.com/GenericMappingTools/pygmt) if you're interested in contributing :smile:! Also have a look at our [Contributors Guide](https://www.pygmt.org/v0.14.0/contributing.html) to figure out how you can help and get started :rocket:.
### :warning: Upcoming deprecations
- **v0.15.0**
- `pygmt.clib`: Remove the `open_virtual_file` method, use `open_virtualfile` instead (FutureWarning raised since PyGMT v0.11.0)
- `pygmt.clib`: Remove the `virtualfile_from_data` method, use `virtualfile_in` instead
- **v0.16.0**
- `pygmt.clib`: The `virtualfile_from_vectors` methods takes a sequence of vectors as its single argument, rather than passing multiple vectors as positional arguments (FutureWarning raised since PyGMT v0.14.0)
- **v1.0.0**
- Short form aliases (e.g. `R`) will not work if long form aliases (e.g. `region`) are available (SyntaxWarning raised since PyGMT v0.4.0, see [#1316](https://github.com/GenericMappingTools/pygmt/pull/1316))
The compatibility matrix for GMT, Python, and the required core package dependencies NumPy, pandas, and Xarray is listed at https://www.pygmt.org/v0.14.0/minversions.html, so make sure you keep things up to date!
### :world_map: Conference presentations/workshops/sprints
* The GMT and PyGMT teams have organized an AGU pre-conference workshop for GMT and PyGMT :computer: in Washington, D.C. 🏛️ on 2024-12-08: **PREWS9 Mastering Geospatial Visualizations with GMT/PyGMT**. If you could not make it to the AGU Annual meeting this year in-person, or you missed the workshop for other reasons, you can still go through the workshop on your own, as the materials are freely available from https://www.generic-mapping-tools.org/agu24workshop/intro.html.
* Besides this workshop there was an union-wide memorial session for Paul Wessel: **U019 - The impact of GMT in the Earth, Ocean and Space sciences: What’s next?**. Check out the slides for the PyGMT talk **PyGMT – Accessing and Integrating GMT with Python and the Scientific Python Ecosystem**, which are free available from https://doi.org/10.6084/m9.figshare.28049495.
| GMT/PyGMT preworkshop | PyGMT talk |
|:--:|:--:|
| [](https://www.generic-mapping-tools.org/agu24workshop/intro.html) | [](https://figshare.com/articles/presentation/PyGMT_Accessing_and_Integrating_GMT_with_Python_and_the_Scientific_Python_Ecosystem_AGU24_U12B-05_/28049495?file=51279815) |
**P.S.** Share the word on Instagram [@genericmappingtools](https://www.instagram.com/genericmappingtools/) :camera_with_flash: and ResearchGate!
 Sign in with Wallet
Connect another wallet
Sign in with Wallet
Connect another wallet