---
title: Monitoring Pulp with Prometheus and Grafana
---
# Monitoring Pulp with Prometheus and Grafana
slides: https://hackmd.io/p/iyWguPV7S-2eJHUZNRWGvg
---
## Disclaimer
My only experience with this is spending about a week researching and experimenting with it, spread out across a month or two. I'm not an expert.
---
## Problem statement: My infrastructure is a black box
I have X applications running on Y hardware resources, handling (or not?) a load that changes constantly.
* Disks fill up
* Servers and services go down
* Traffic goes up
* Available memory goes down
---
## Question:
How can I monitor for, predict and prevent problems? When problems occur, how do I pinpoint and address them?
Answer: Collect data about my applications and infrastructure
New question: ...Now what?
---
Collecting data is not the *goal*, it's a precondition.
The goal is to *understand* what is happening on the infrastructure running my:
* website
* internal IT services
* popular streaming service
* stock exchange
* ...etc
---
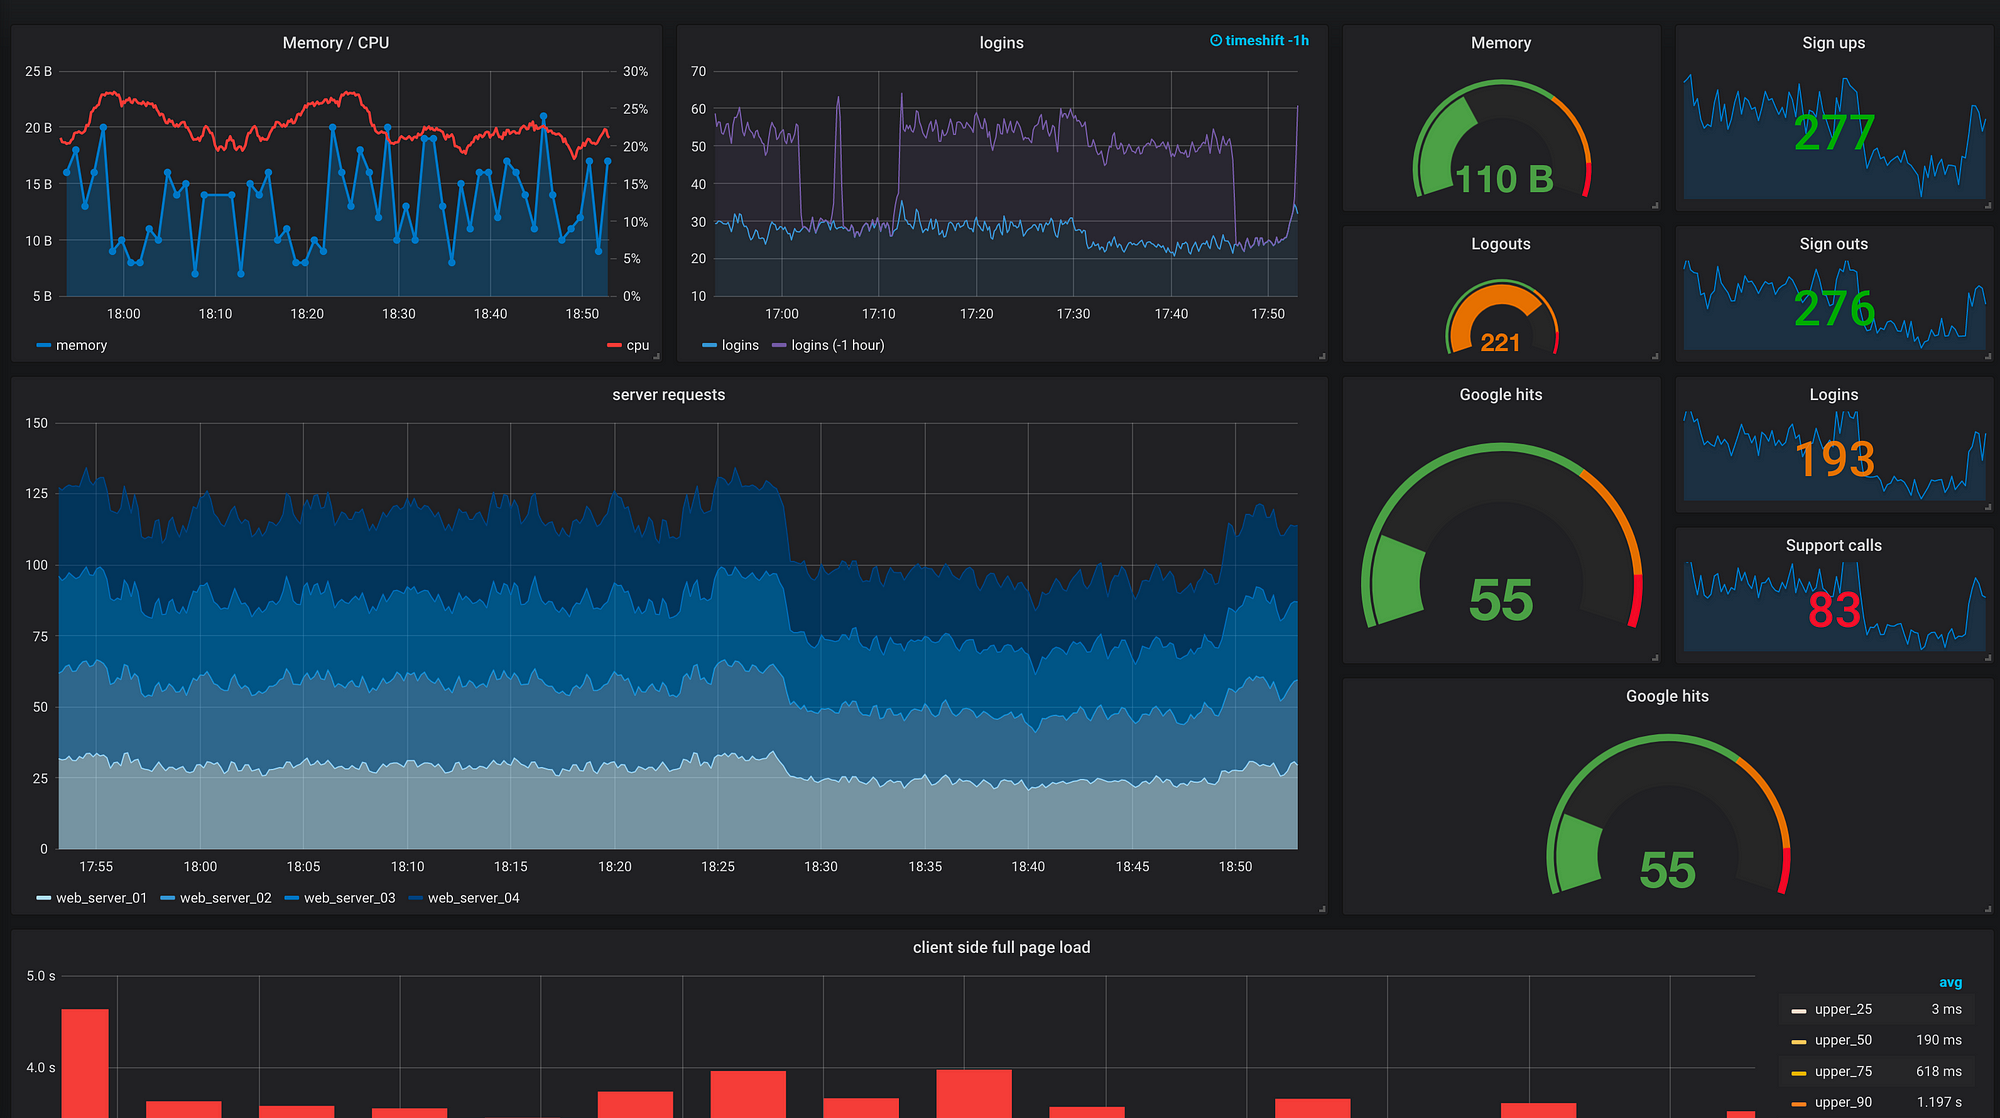
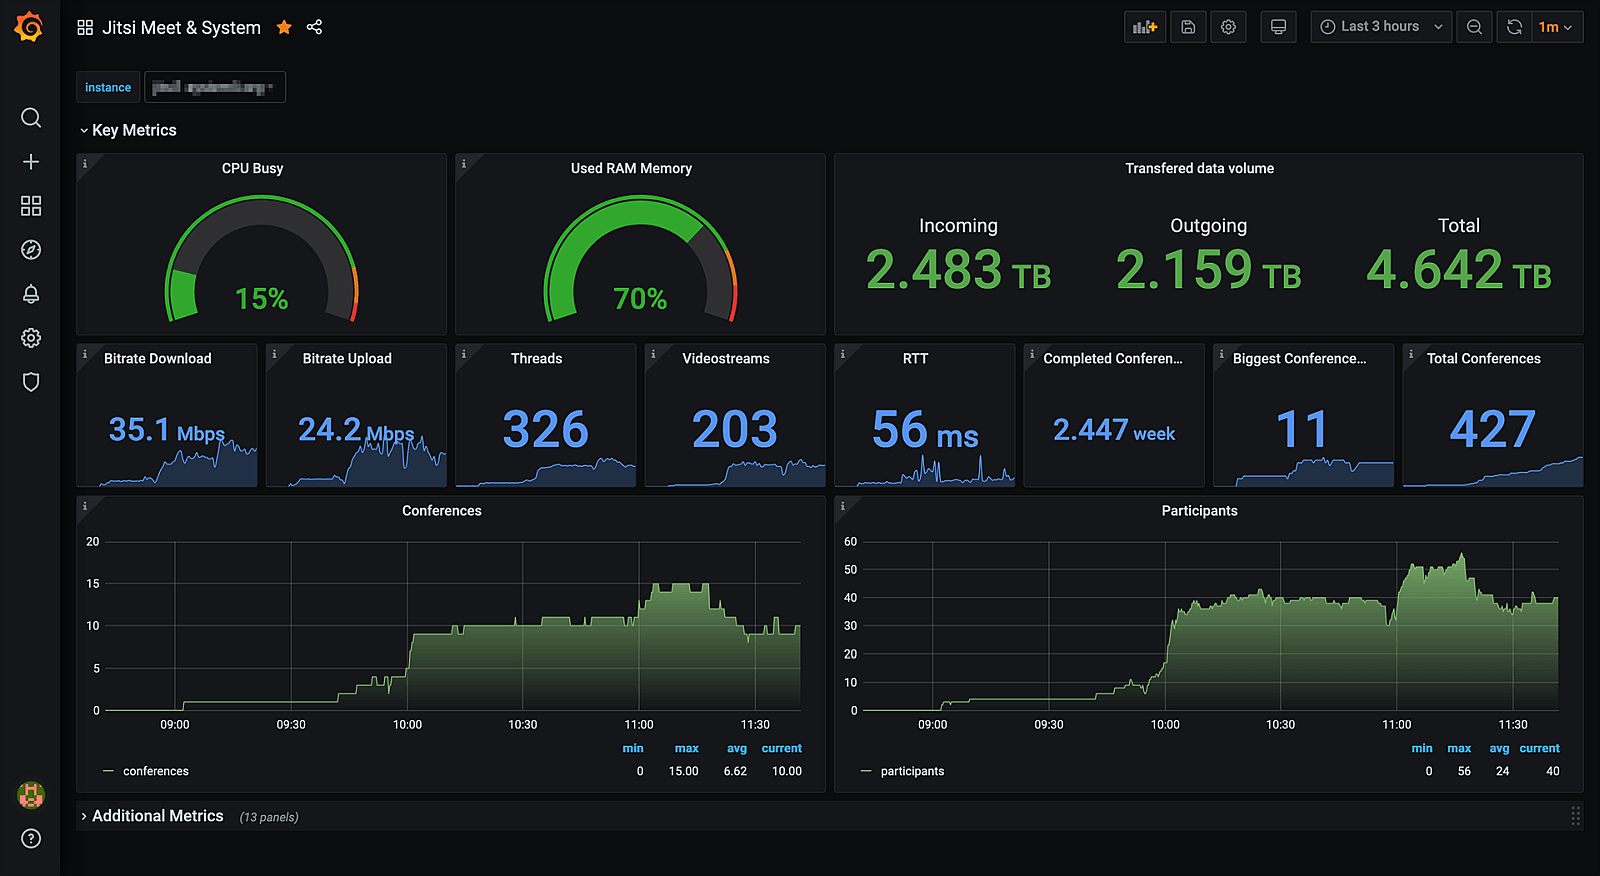
## What is Grafana?
An open source tool for monitoring, analyzing and visualizing infrastructure metrics in real time.
Widely used by thousands of organizations including Wikipedia, Paypal, Verizon.
---
### What do you mean by "monitoring and visualizing metrics"?
---
---
### Grafana takes data and makes it comprehensible (in real time)
---

---
### Data can come from many sources
* Time-series databases (InfluxDB, Graphite, Prometheus)
* SQL databases (PostgreSQL, MySQL, MS SQL Server)
* AWS CloudWatch
* Azure Monitor
* Google Cloud Monitoring
* Elasticsearch
* About a dozen others
---
## What is Prometheus?
One such backend for Grafana - a popular one.
Key features:
* PromQL - fancy query language
* Pull-based vs push-based
---
## Example query
"Populate a variable with the busiest 5 request instances based on average QPS over the time range shown in the dashboard"
```PromQL
query_result(topk(5, sum(rate(http_requests_total[$__range])) by (instance)))
```
---
## Pull-based?
Instead of configuring your sources of data to send the data to Prometheus, you tell Prometheus where to look for the data.
"Exporters" have a standard data format, Prometheus fetches the data via HTTP request.
Benefits: Able to configure everything centrally, service discovery, node failures are more obvious.
Drawbacks: HTTP endpoint needed per-exporter.
---
## Why Prometheus vs. $something_else?
* Seems to be the most popular data source?
* Works especially well with k8s, part of CNCF foundation
* Comes with node exporter, one less thing to configure
* Exposing an HTTP endpoint on a web app is easy
---
## Exporters
* "Node" exporter - details about a machine. CPU, RAM, disk, network IO, etc.
* PostgreSQL exporter - details about transactions, connections open, ops / second, etc.
* Redis exporter - memory usage, latencies, # of entries, commands / second, expired items, etc.
* There at least a hundred of these available...
---
## Alerting
"Flash the red lights when"
* disk / memory / CPU utilization hits $threshold
* average latency / errors per second increases above $threshold
* service is unreachable for X minutes
---
## What benefits could this bring to Pulp?
For developers: Easier to monitor performance & memory consumption, faster feedback loops.
For users: Depends on which metrics we expose - I have some ideas
---
## Possible Pulp metrics
* Size of artifact storage?
* \# of Content / Repos / Repository Versions / Distributions?
* \# of downloaded content vs. un-downloaded content?
* API requests / second?
* Content app requests / second?
* Running / Waiting / Failed tasks?
---
## Live Demo
<!--
Pulp tasks demo
System metrics (CPU, mem, etc.) demo
-->
###### tags: `PulpCon 2021`