---
title: hslu 2022.09-V
tags: presentations
description: View with "Slide Mode".
slideOptions:
theme: white
---
<!-- .slide: data-background="#000000" -->
<img src="https://opendata.utou.ch/presentations/digiges%202019.2/_unused/badapple3.png" width="100">
<center><pre>
.-. .-. .-. .-. .-. . . .-. . . .-.
| )|-| | |-| `-. |< | | | `-.
`-' ` ' ' ` ' `-' ' ` `-' `-' `-' `-'
Part II with Oleg Lavrovsky
datetime(2022, 09, 12)
Hochschule Luzern - Design & Kunst
</pre></center>
----
# Data Skills
Our objectives for this module are to:
1. improve data research skills & choose good sources
1. learn to work with several different kinds of data
1. learn to interpret and to classify data in context
1. use, analyse and contribute structured information
1. apply the skills meaningfully in your own work
See also: [Part I](https://hackmd.io/@oleg/hslu-2022-09)
----
## The program this week
☑️ Finding & scraping data online
☑️ Collecting & cleaning datasets
☑️ Preparing & validating packages
🟦 **[Remixing & visualizing data](#remix)**
🟦 **[Production for good & for profit](#produce)**
🟦 **[Accelerating your social data impact](#impact)**
----

----

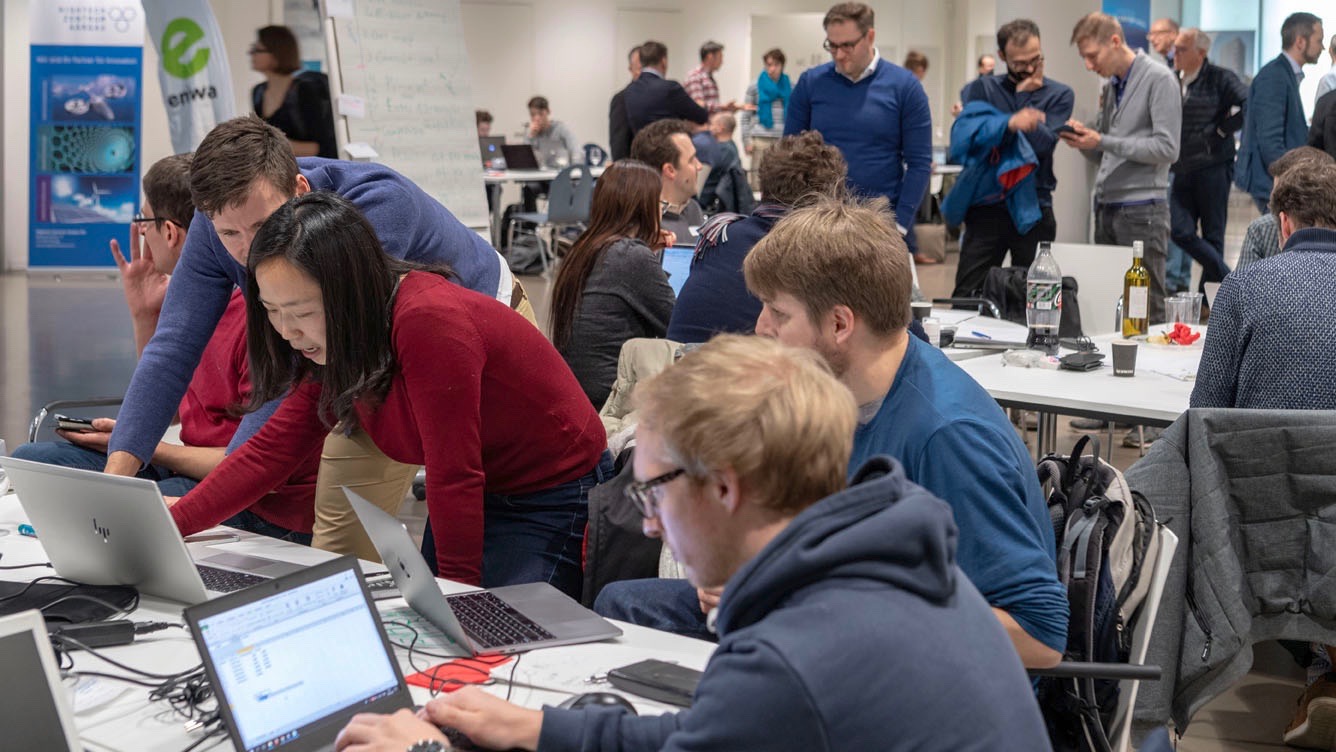
We will continue meeting in the mornings at Viscostadt. Marked in green are periods where you can work on your data projects from the library or from home - just keep updating your progress on our platform. You can reach out for help any time.
----

With creative technologist [Markus Leutwyler](https://makehumantechnology.org/), on Tuesday and Wednesday we can build our own [open hardware](https://de.wikipedia.org/wiki/Open-Source-Hardware) sensors, connect to satellites or create wholly new data observations - and experience the whole process from beginning to end.
----
[](https://forum.opendata.ch/t/16-17-9-energy-data-hackdays-2022/844/1)
On Friday, we will have the opportunity to join the Energy Data Hackdays - to meet data providers (energy companies, government, scientists) and team up on hands-on prototyping projects. All the skills we learned in our workshop can be applied - beginners are very welcome. The optinal event is free (costs of transport are not covered) but places are limited so sign up soon.
----

This week there are interesting events on campus. You can visit the other Focus+ Modules, see exhibitions and hear presentations in Emmenbrücke:
- Stricken & Sticken (room 290a)
- Lasercutter & Schneideplotter (room 251)
- Visual Discovery Conference (Halle) ... and more!
----

Follow [@plusmodule_hslu](https://www.instagram.com/plusmodule_hslu/) on Insta for more impressions.
---

When we talk about data, we differentiate between **structured data** (secondary data, in science) and **raw measurements** (primary data). Remixing data typically happens higher up - but you can always start at the bottom and create new data, questioning the status quo. This update of the [DIKW pyramid](https://en.wikipedia.org/wiki/DIKW_Pyramid) may help you as a mental model in understanding where your data starts and ends.
---
<a name="remix"></a>
# Remixing & visualizing data
This week we introduce tools and methods of data visualization - with first of all a look at communication from the human perspective. Who is your audience? What message is the data giving to them?
----
[](https://www.youtube.com/watch?v=yAv5pLO37mE&list=LL872uIXI4Bt5G9piCiOx9QQ&index=2)
[French 79 - Hometown](https://www.youtube.com/watch?v=yAv5pLO37mE&list=LL872uIXI4Bt5G9piCiOx9QQ&index=2) is a music video which may inspire some creative thinking about how people respond to signals - whether in the forms of numbers, colors, shapes, or more.
[Minority Report](https://www.imdb.com/title/tt0181689/) is often cited as a film which popularized working with complex data visualizations (or at least people like seeing Tom Cruise energetically waving arms around in AR).
----
[](https://vimeo.com/45232468)
Teaching to See ([Vimeo](https://vimeo.com/45232468) or [YouTube](https://www.youtube.com/watch?v=ldSkPqZKBl0)) is a wonderful documentary on visualizing data featuring designer [Inge Druckrey](https://en.wikipedia.org/wiki/Inge_Druckrey) produced by [Edward Tufte](https://en.wikipedia.org/wiki/Edward_Tufte). We watched a clip in class on the topic of Swiss maps.
----

Classic visualizations like [Charles Minards Flow Map](https://datavizblog.com/2013/05/26/dataviz-history-charles-minards-flow-map-of-napoleons-russian-campaign-of-1812-part-5/) focus on explaining the past. Who is the audience? In fact, our ancestors have been making charts and graphs based on quantities and qualities for many centuries in the past. [The Beauty of Diagrams](https://www.bbc.co.uk/programmes/b00w5675) is a BBC program covers influential drawings of [Florence Nightingale](https://en.wikipedia.org/wiki/Florence_Nightingale) (above) and more.
----

We acknowledge that data can inspire us to see the world in a new light. Books like [The Truthful Art](http://www.thefunctionalart.com/p/the-truthful-art-book.html) by Alberto Cairo, [Visualize This](https://flowingdata.com/book/) by Nathan Yau, and [Information is Beautiful](https://www.informationisbeautifulawards.com/showcase/1476-where-does-data-visualization-come-from) by David McCandless - which we used in class - are a good starting point for us to learn how professionals remix their data into compelling, impactful visualizations that tell a story.
----

Notice how dataviz is used in various disciplines of humanities & science, and the interplay of influences: _"good artists copy, great artists steal!"_ There are some excellent further resources in the `175 Data Design & Art` and `33D Infografik` sections of the D&K library downstairs.
---
<a name="produce"></a>
# Production for good & for profit
----
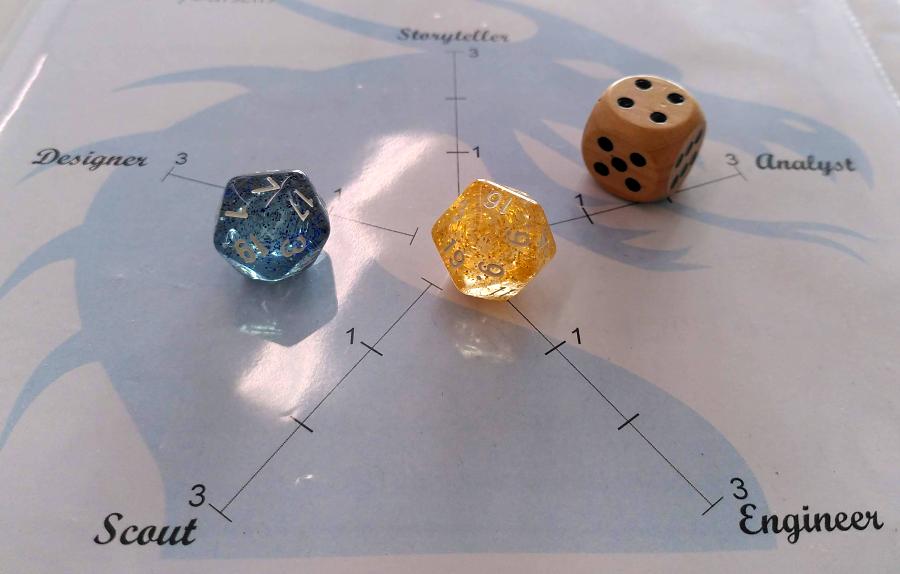
[The Data Oracle](https://dda.schoolofdata.ch/project/75) is now ready for you to consult! Just use the app with the numbers you rolled in class, which are pasted in a table below. Please pull the curtain behind you as you walk in. We wish you good fortune!
----

We classified visualization tools between 'point and click' or 'out of the box' tools (Datawrapper, Tableau, Excel ..), the most popular programming languages for visualization (R, Python, Julia), and **no code** tools ([Cables.gl](https://cables.gl), shown above, [vvvv](https://visualprogramming.net/), [NodeBox](https://www.nodebox.net/node/documentation/using/data-visualization.html), or [MicroBlocks](https://microblocks.fun/get-started) as explained by Markus).
All of these allow you to be flexible and expressive in your visualization work, as the old idea of [Flow based programming](https://en.wikipedia.org/wiki/Flow-based_programming) gets rebooted by the #nocode trend.
----
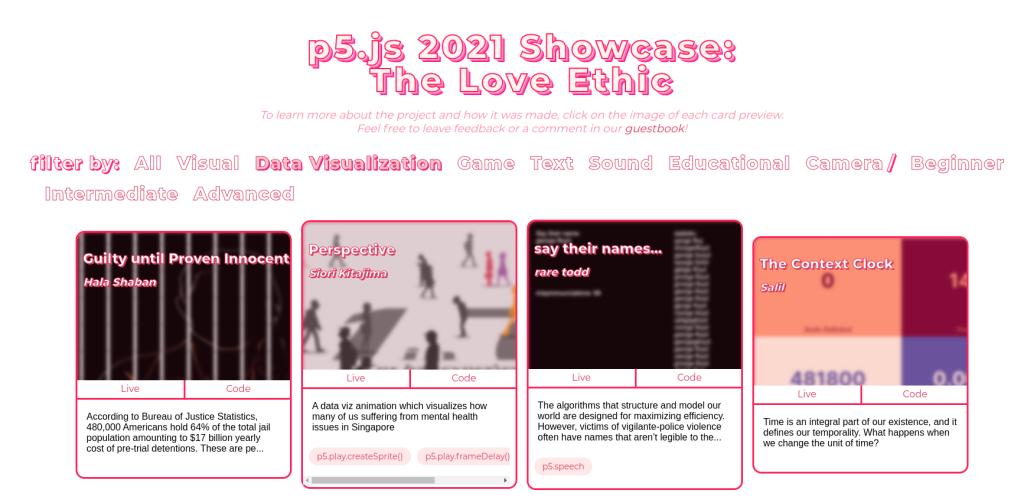
Data Design+Art students get introduced to P5.js (based on the Processing language), which is terrific for many kinds of visualization and animation. Check out our students projects and other showcases in our [DDA resource](https://dda.schoolofdata.ch/project/29).
----

Speaking of animation, this is a little known, [Data GIF Maker](https://datagifmaker.withgoogle.com/) is a fun and easy little [tool from Google](https://blog.google/outreach-initiatives/google-news-initiative/make-your-own-data-gifs-our-new-too/). See also https://ezgif.com/
----
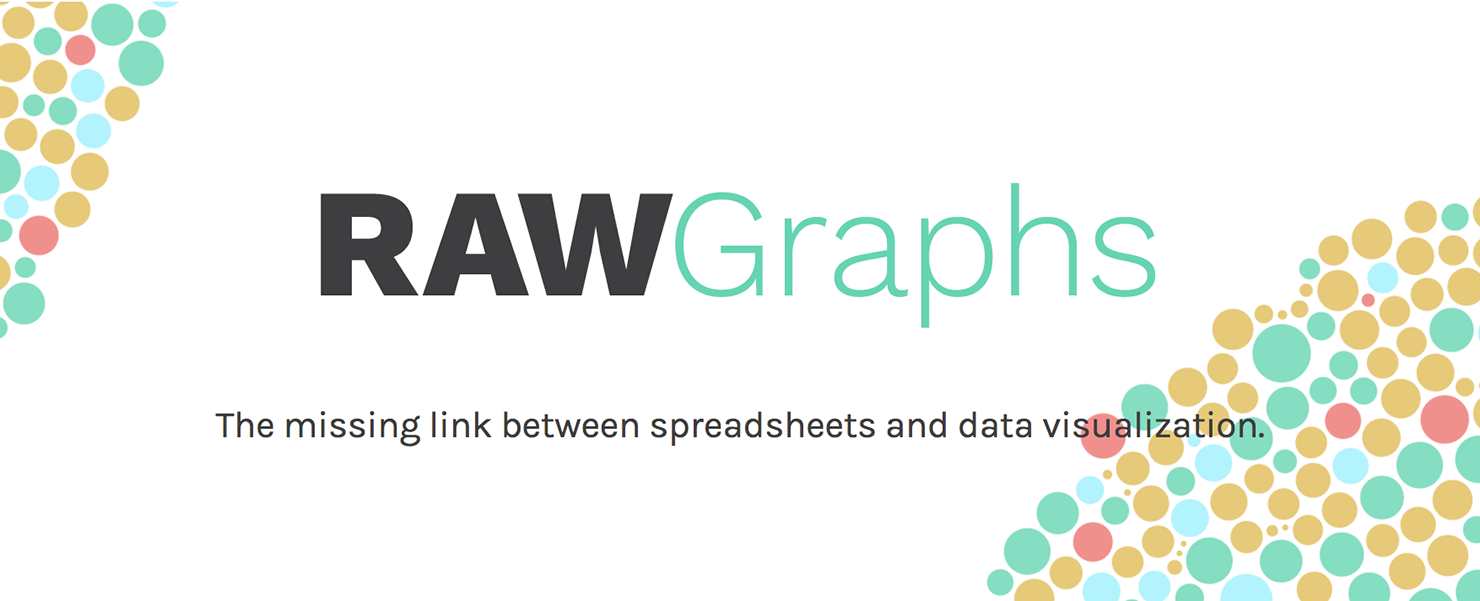
The free tool [RAWGraphs](https://www.rawgraphs.io/) is similar to DataWrapper, it produces charts from a large toolbox based on open formats. It produces excellent [layered SVGs](https://densitydesign.org/research/raw/) which you can modify in an illustration program. It has a ton of options and some [great tutorials](https://www.rawgraphs.io/learning).
----

Building up on your initial SVG visualization using Adobe Illustrator or [Inkscape](https://inkscape.org/) - shown above with a RAWGraph loaded - is how most infographics are made by designers. In the [Data Illustration](https://dda.schoolofdata.ch/project/76) project I showed another quick example of this.
----

[Vega](https://vega.github.io/) is a "declarative format" for designing visualizations based on the **[Grammar of Graphics](https://medium.com/visumd/creating-interactive-visualizations-should-be-easier-137212ef1fb1)**. You describe [your chart](https://vega.github.io/vega/examples/bar-chart/) in JSON, creating metadata to visualize your data. We tried the [Vega Editor](https://vega.github.io/editor/#/edited) and the [DataVoyager](https://vega.github.io/voyager) application to get started.
----

The [Plot library](https://observablehq.com/@observablehq/plot?collection=@observablehq/plot) by the Observable team is also inspired by the Grammar of Graphics and Vega Lite. See our dedicated [Observable](https://dda.schoolofdata.ch/project/80) page for more tips.
----
<a name="impact"></a>
# Accelerating your social data impact
It is easy to be interested in collecting and publishing works based on data. A big open question remains: what happens next? How do you measure your success - or, conversely, how do you check that your data research isn't being manipulated and misused?
---

Our projects are coming together on the Data Skills [dribdat site](https://dda.schoolofdata.ch/event/11), where we are tracking our progress in collecting, cleaning, applying data using the School of Data Pipeline. If last week we managed to brainstorm, discover, collect and package data, this week our goal can be to analyse, visualise and share our work. The last part in particular - "to share" - is more than a one way street.
----
<img width="60%" src="https://i.imgur.com/PTTbqYP.png"><img width="40%" src="https://i.imgur.com/4VPJV0M.jpg">
The [Data Oracle](https://dda.schoolofdata.ch/project/75) app is an example of a simple **hashing** algorithm, which are a fundamental mechanism ensuring security on the Internet. We looked at how [MD5 check-sums](https://www.intel.com/content/www/us/en/support/programmable/articles/000078103.html) work with a practical example that can help you to ensure your data remains true to it's source when shared online. We briefly compared this to image watermarks.
---
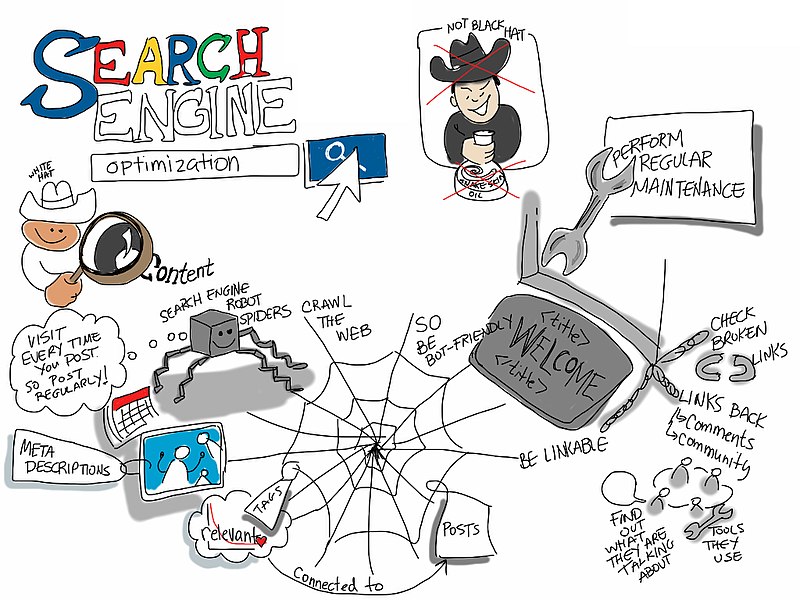
> By Giulia Forsythe - Demystifying Search Engine Optimization [viz notes #wcyvr](https://commons.wikimedia.org/w/index.php?curid=97648541), CC0
Learning about [Search engine optimization](https://en.wikipedia.org/wiki/Search_engine_optimization) is a fundamental topic in digital marketing. There are one or two salient points about the use of data in this area: it is highly prized and often manipulative in nature, and at the end of the day the [Web of Data](https://www.ted.com/talks/tim_berners_lee_the_next_web) is an incredibly powerful way to connect with the world.
----
[](https://opensea.io/assets/matic/0x2953399124f0cbb46d2cbacd8a89cf0599974963/17474022494596850118414168489788012521356153066704923319304507448499808239617)
These days data doesn't get much more (anti?)social than Non-Fungible Tokens, the fastest way to get attention online and lose some money. We would need a whole class to get into this properly, but obliged a quick look at a few datavis projects. Be careful out there, sailor.
----

There are a lot of places to showcase your own data work, from [DataHub](https://datahub.io/collections) and [GitHub](https://github.com) to [Quilt](https://open.quiltdata.com/) and [data.world](https://data.world/), [Dribbble](https://dribbble.com) to [Behance](https://behance.com) and [various](https://data.stadt-zuerich.ch/showcase) [open data](https://data.bs.ch/pages/reuses/) [portals](https://opendata.swiss/en/showcase). Find an audience that you click with, and participate in the commons. Share the beauty and wonder of data, demand high quality and reproducibility - not just glitzy and glamorous widgets.
----

Understanding "data frictions" in social networks allows us to gain more control of our data and measure impact. Tweet, notify, like, retweet. [GitHub](https://www.toolsqa.com/git/git-fork/) forks and stars are similar to the impact ratings in academia, such as [Altmetrics](https://www.altmetric.com/audience/researchers/) pictured above. Projects such as the [Metadata Quality](https://data.europa.eu/mqa/) analysis of [data.europa.eu](https://data.europa.eu) aim to regularly evaluate and score datasets.
----

Upload a [package](https://frictionlessdata.io/introduction/#who-uses-frictionless), set up an automation, pick up a [badge](https://repository.frictionlessdata.io/docs/badges.html), get a [pull request](https://howchoo.com/webdev/how-and-why-to-use-pull-requests-in-github). This is how many interesting feedback loops and data remixes begin.
The charts in the [COVID-19 tracker](https://covid-tracker.frictionlessdata.io/) shown above are Data Packages visualized with Vega and published with [Livemark](https://livemark.frictionlessdata.io/). See also:
:books: [Handbook for Researchers](https://raniere-phd.gitlab.io/frictionless-data-handbook/)
----
<img border="2" style="border:1px solid black;margin-bottom:1em" src="https://i.imgur.com/0aUiyEz.png">
Perhaps this is easier to understand in a more tangible context. As we saw last week, not all apps allow us to easily extract and reuse the data they collect. Sometimes it is just a matter of a large difference in context. We learned to differentiate how open they are as tools for data gathering. In the future we can look for certifications like [Better IoT](https://betteriot.wordpress.com/tool/) to guide our decisions.
----

At the conclusion of our module, we looked again at the [Data Skills Framework](https://theodi.org/article/data-skills-framework/) to assess how well this structure worked for us, and where the learning paths ahead may lead us.
----

Don't get dissuaded by bugs and early failures! All the players crash and burn some of the time. Let yourself be guided by both shared wisdom and your hard-earned experience. Some additional references that might help you get through the next hurdle:
- [Hands-on Dataviz](https://handsondataviz.org/introduction.html)
- [Kieran Healy's book](https://socviz.co/index.html#preface)
- [Data Carpentry](https://datacarpentry.org/)
----

Follow your motivation, do what you think is right, not just what you hear in a [TED talk](https://www.ted.com/playlists/201/art_from_data) ... Fail 99 times to get it right that 1 time, make something [awesome](https://www.onezoom.org/about.html), and you might just find yourself on a stage like this someday! Most importantly: enjoy the journey ...
:mountain: ☮️
----
[](https://dda.schoolofdata.ch/event/11)
Thanks for working hard on your Data Packages, and transforming them into compelling [Data Projects](https://dda.schoolofdata.ch/event/11). I hope this was a positive and encouraging experience for you, and wish you well in further travels in the _dataverse_ ...
---
:thumbsup: :thumbsdown: oleg.lavrovsky@hslu.ch
<a rel="license" href="http://creativecommons.org/licenses/by/4.0/"><img alt="Creative Commons Licence" style="border-width:0" src="https://opendata.utou.ch/presentations/digiges%202019.2/88x31.png" align="left" /></a><br>This presentation by Oleg Lavrovsky and, unless otherwise stated, all contents are licensed under a <a rel="license" href="http://creativecommons.org/licenses/by/4.0/">Creative Commons Attribution 4.0 International License</a>.
 Sign in with Wallet
Connect another wallet
Sign in with Wallet
Connect another wallet