# Report 33 - Modelling the allocation and impact of a COVID-19 vaccine
###### tags: `articles`
## Introduction
Explore the potential public health impact of different vaccine characteristics, level of incomes, and population-targeting strategies.
## Methods
### Mathematical Model
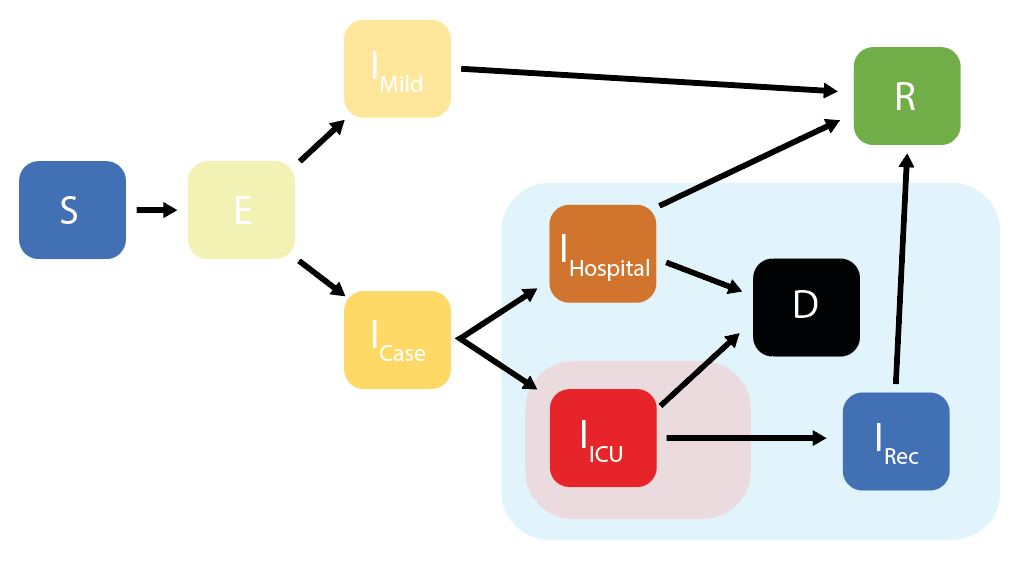
**Stochastic** SEIR model
:::warning
Neither the __content__ nor its __supplementary material__ introduces the detail of the model.
so instead, I'll explain the model which is mentioned in the [paper](https://www.science.org/doi/full/10.1126/science.abc0035) it cited.
:::
[Code of this model is available](https://github.com/mrc-ide/squire)
| Compartment | Meaning |
| --------------------- | --------------------------------------------------------------- |
| $S$ | Susceptibles |
| $E$ | Exposed(latent infection) |
| $I_{\text{Mild}}$ | Mild infections (not requiring hospitalisation) |
| $I_{\text{Case}}$ | Infections requiring hospitalisation (but not yet hospitilised) |
| $I_{\text{ICU}}$ | Hospitalised infection (requiring an ICU bed) |
| $I_{\text{Hospital}}$ | Hospitalised infection (requiring a general hospital bed) |
| $I_{\text{Rec}}$ | Hospitalised infection (requiring a general hospital bed after recovering from ICU stay) |
| $R$ | Recovered |
| $D$ | Dead |

```graphviz
digraph schema
{
node [shape = box] Population
node [shape = circle] age_group1, age_group2, age_group3, age_group4
subgraph submodel
{
node [shape = triangle, color = "gray", style = "filled"] submodel1, submodel2, submodel3, submodel4
submodel1:s -> {submodel2, submodel3, submodel4} [arrowhead = none]
submodel2:s -> {submodel3, submodel4} [arrowhead = none]
submodel3:s -> {submodel4}[arrowhead = none]
rank = "same"
}
Population -> {age_group1, age_group2, age_group3, age_group4} [label = "split"]
age_group1 -> submodel1 [label = "simulation"]
age_group2 -> submodel2 [label = "simulation"]
age_group3 -> submodel3 [label = "simulation"]
age_group4 -> submodel4 [label = "simulation"]
rankdir = "TB"
}
```
| Parameter | Symbol | Value | Description |
|:------------------------------------------------------------------ |:------------------------:| --------- |:--------------------------------------------- |
| Transmission parameter | $\beta$ | | Calculated from $R_0$ |
| Mean Latent Period | $1 \over \alpha$ | 4.6 days | |
| Mean Duration of Mild Infection | $1\over{\gamma_1}$ | 2.1 days | |
| Mean Duration of Severe Infection prior to Hospitalisation | $1 \over {\gamma_2}$ | 4.5 days | |
| Mean Duration of Hospitalisation for non-critical cases if survive | $1 \over {\gamma_{3,1}}$ | 9.5 days | |
| Mean Duration of Hospitalisation for non-critical cases if die | $1 \over {\gamma_{3,0}}$ | 7.6 days | |
| Mean Duration in ICU if survive | $1 \over {\gamma_{4,1}}$ | 11.3 days | |
| Mean Duration in ICU if die | $1 \over {\gamma_{4,0}}$ | 10.1 days | |
| Mean Duration in Recovery after ICU | $1 \over {\gamma_{5}}$ | 3.4 days | |
| Kronecker delta function | $\delta(\cdot)$ | 1 or 0 | Equals 1 if there is capacity and 0 otherwise |
| Probability of requiring hospitalisations | $\phi_1(a)$ | | age dependent |
| Probability of requiring ICU | $\phi_2(a)$ | | age dependent |
| Probability of dying | $\mu(a)$ | | age dependent |
:::warning
There's no explanation on these equations.
so I could only "GUESS" the meanings.
:::

---
The model of this report is basically extending the model mentioned above to include vaccination.
### Parameterisation
#### Stratify the countries into four groups
1. High-income countries (HIC)
2. Upper-middle income countries (UMIC)
3. lower-middle income countries (LMIC)
4. low-income countries(LIC)
The country with the median GDP in each group represent the whole group.
### Vaccine Allocation
Consider the optimal allocation of the vaccine within a country under different supply constraints.
1. Divide population into 5-year groups
2. Generate scenarios in which two contiguous "bands" of age groups could be selected
3. Calculate the deaths averted over the time horizon
4. Select the most efficient allocation.
## Results
- **Figure 2: Vaccine Efficacy and Herd Immunity.**<br>
- (B): HIC setting
- Other assumptions:<br>**Figure S8: Vaccine Efficacy and Herd Immunity by Income Setting.**<br>
- **Figure 3: Epidemic Characteristics at Vaccine Introduction.**<br>
- **Figure 4: Age-targeting of Vaccine Introduction.**<br>
 Sign in with Wallet
Connect another wallet
Sign in with Wallet
Connect another wallet