# What and Why
Hierarchical clustering is based on the general concept of finding a hierarchy of partial clusters, built using either a bottom-up or a top-down approach.
* **Agglomerative clustering**: The process starts from the bottom (each initial cluster is made up of a single element) and proceeds by merging the clusters until a stop criterion is reached. In general, the target has a sufficiently small number of clusters at the end of the process
* **Divisive clustering**: In this case, the initial state is a single cluster with all samples and the process proceeds by splitting the intermediate cluster until you hit the desired number of clusters.
**Scikit-learn implements only the agglomerative clustering.**
However, this is not a real limitation because the complexity of divisive clustering is higher and the performances of agglomerative clustering are quite similar to the ones achieved by the divisive approach.
* The standard algorithm for hierarchical agglomerative clustering has a time complexity of O(n3) and require O(n2) memory, which makes it too slow for even medium data sets.
* Divisive clustering with an exhaustive search is O(2n)
Initially, we treat all n data points as n clusters and calculate the distances between all pairs of n clusters.
Common distances:
* Euclidean or L2
* Manhattan or L1
* Cosine distance (or 1 – cosine similarity)
# Agglomerative Clustering
After distances had been determined, we need to aggregate different clusters based on some strategy (called linkage).
* single linkage
* complete linkage
* average linkage
* Ward’s linkage
Single linkage: For each pair of clusters, the algorithm computes and merges the minimum distance between the clusters
Complete linkage: For each pair of clusters, the algorithm computes and merges them to minimize the maximum distance between the clusters (in other words, the distance of the farthest elements)
Average linkage: It's similar to complete linkage, but in this case the algorithm uses the average distance between the pairs of clusters
Ward's linkage: The distance between clusters is defined as the sum of squared distances of all points to the centroid of the merged cluster after combining two clusters. The two clusters with the smallest increase in this sum are then merged.
```
from sklearn.datasets import make_blobs
import numpy as np
np.random.seed(1000)
nb_samples = 3000
X, _ = make_blobs(n_samples=nb_samples, n_features=2, centers=8, cluster_std=2.0)
from sklearn.cluster import AgglomerativeClustering
# complete linkage
ac = AgglomerativeClustering(n_clusters=8, linkage='complete')
Y = ac.fit_predict(X)
import matplotlib.pyplot as plt
def plot_clustered_dataset(X, Y):
fig, ax = plt.subplots(1, 1, figsize=(10, 8))
ax.grid()
ax.set_xlabel('X')
ax.set_ylabel('Y')
markers = ['o', 'd', '^', 'x', '1', '2', '3', 's']
colors = ['r', 'b', 'g', 'c', 'm', 'k', 'y', '#cccfff']
for i in range(nb_samples):
ax.scatter(X[i, 0], X[i, 1], marker=markers[Y[i]], color=colors[Y[i]])
plt.show()
# Plot the clustered dataset
plot_clustered_dataset(X, Y)
```
```
from sklearn.datasets import make_blobs
from sklearn.cluster import AgglomerativeClustering
from sklearn.metrics import silhouette_score
import numpy as np
import matplotlib.pyplot as plt
# Generate the dataset
np.random.seed(1000)
nb_samples = 3000
X, _ = make_blobs(n_samples=nb_samples, n_features=2, centers=8, cluster_std=2.0)
# Define linkages to compare
linkages = ['single', 'average', 'ward','complete']
# Function to evaluate and plot clusters
def evaluate_linkage(X, linkages):
scores = {}
for linkage in linkages:
ac = AgglomerativeClustering(n_clusters=8, linkage=linkage)
Y = ac.fit_predict(X)
score = silhouette_score(X, Y)
scores[linkage] = score
# Plot clustered dataset
plot_clustered_dataset(X, Y, title=f'Linkage: {linkage}, Silhouette: {score:.3f}')
return scores
def plot_clustered_dataset(X, Y, title=""):
fig, ax = plt.subplots(1, 1, figsize=(10, 8))
ax.grid()
ax.set_xlabel('X')
ax.set_ylabel('Y')
markers = ['o', 'd', '^', 'x', '1', '2', '3', 's']
colors = ['r', 'b', 'g', 'c', 'm', 'k', 'y', '#cccfff']
for i in range(nb_samples):
ax.scatter(X[i, 0], X[i, 1], marker=markers[Y[i] % len(markers)], color=colors[Y[i] % len(colors)])
ax.set_title(title)
plt.show()
# Evaluate linkages
scores = evaluate_linkage(X, linkages)
# Print the results
print("Silhouette Scores for different linkages:")
for linkage, score in scores.items():
print(f"{linkage}: {score:.3f}")
```
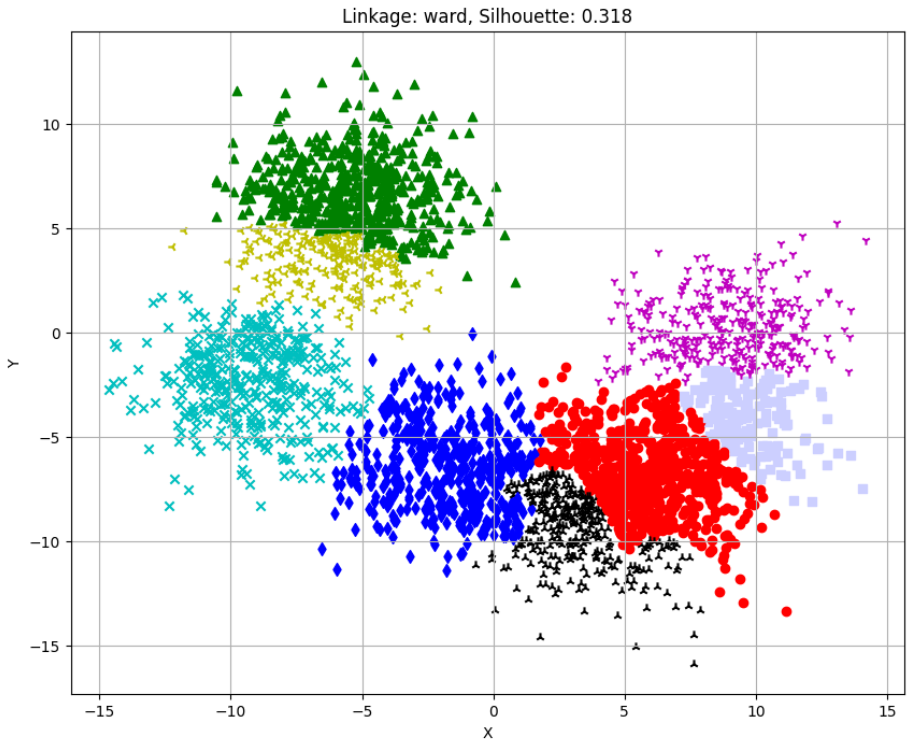
Silhouette Scores for different linkages:
single: -0.378
average: 0.320
ward: 0.318
complete: 0.352
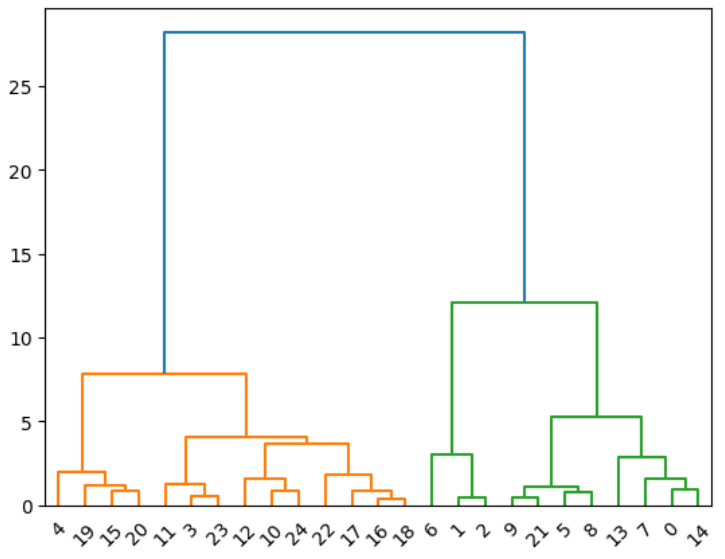
# Scipy-Dendrogram
```
from sklearn.datasets import make_blobs
import numpy as np
np.random.seed(1000)
nb_samples = 25
X, Y = make_blobs(n_samples=nb_samples, n_features=2, centers=3, cluster_std=1.5)
from scipy.spatial.distance import pdist
Xdist = pdist(X, metric='euclidean')
from scipy.cluster.hierarchy import linkage
Xl = linkage(Xdist, method='ward')
from scipy.cluster.hierarchy import dendrogram
Xd = dendrogram(Xl)
```
 Sign in with Wallet
Connect another wallet
Sign in with Wallet
Connect another wallet