# [Gauntlet] Weekly Market Update - (2024-04-22 through 2024-04-28)
Gauntlet would like to provide the community with an update on this market over the previous week. Gauntlet is continuing to monitor this market.
## Summary
This table gives high-level statistics over the time frame in question. Bold lines correspond to weekly average supply/borrow cap usage over 75%.
| Asset | Current Borrow Cap | Current Supply Cap | Average Borrow Cap Usage (Past Week) | Average Supply Cap Usage (Past Week) | Average Utilization | Current DEX 25% Slippage (USD) |
|-------|------------|------------|------------------|------------------|---------------------------|------------------------|
| USDC | 52.00M | 56.00M | 58.39% | 63.05% | 85.98% | $10.56M |
| USDbC | 4.00M | 5.00M | 7.53% | 8.51% | 70.73% | $8.43M |
| DAI | 1.50M | 2.00M | 58.62% | 63.21% | 69.55% | $444.54K |
| WETH | 28.00K | 40.00K | 66.70% | 69.99% | 66.70% | $4.59M |
| **cbETH** | 2.10K | 7.20K | 56.49% | **75.71%** | 21.76% | $4.01M |
| **wstETH** | 1.25K | 4.00K | 43.52% | **85.83%** | 15.84% | $3.30M |
| rETH | 250.00 | 1.00K | 68.45% | 74.19% | 23.06% | $2.11M |
## Top Movers
- rETH's borrow balance increased WoW by 66% from $509K to $843K.
- USDbC's borrow balance decreased WoW by 14% from $328K to $281K.
- WETH's supply balance increased WoW by 38% from $68M to $95M.
- USDbC's supply balance decreased WoW by 16% from $460K to $387K.
- rETH's utilization increased WoW by 23% from 21% to 26%.
- cbETH's utilization decreased WoW by 10% from 23% to 21%.
## Liquidations
| Liquidated Asset | Liquidated Amount (Tokens) | Liquidated Amount (USD) |
|-------|----------|----------|
| mWETH | 0.58 | $1.82K |
| mUSDC | 1.71K | $1.71K |
| mwstETH | 0.07 | $279.38 |
## Weekly Annualized Reserve and Interest Projections

## Protocol Growth
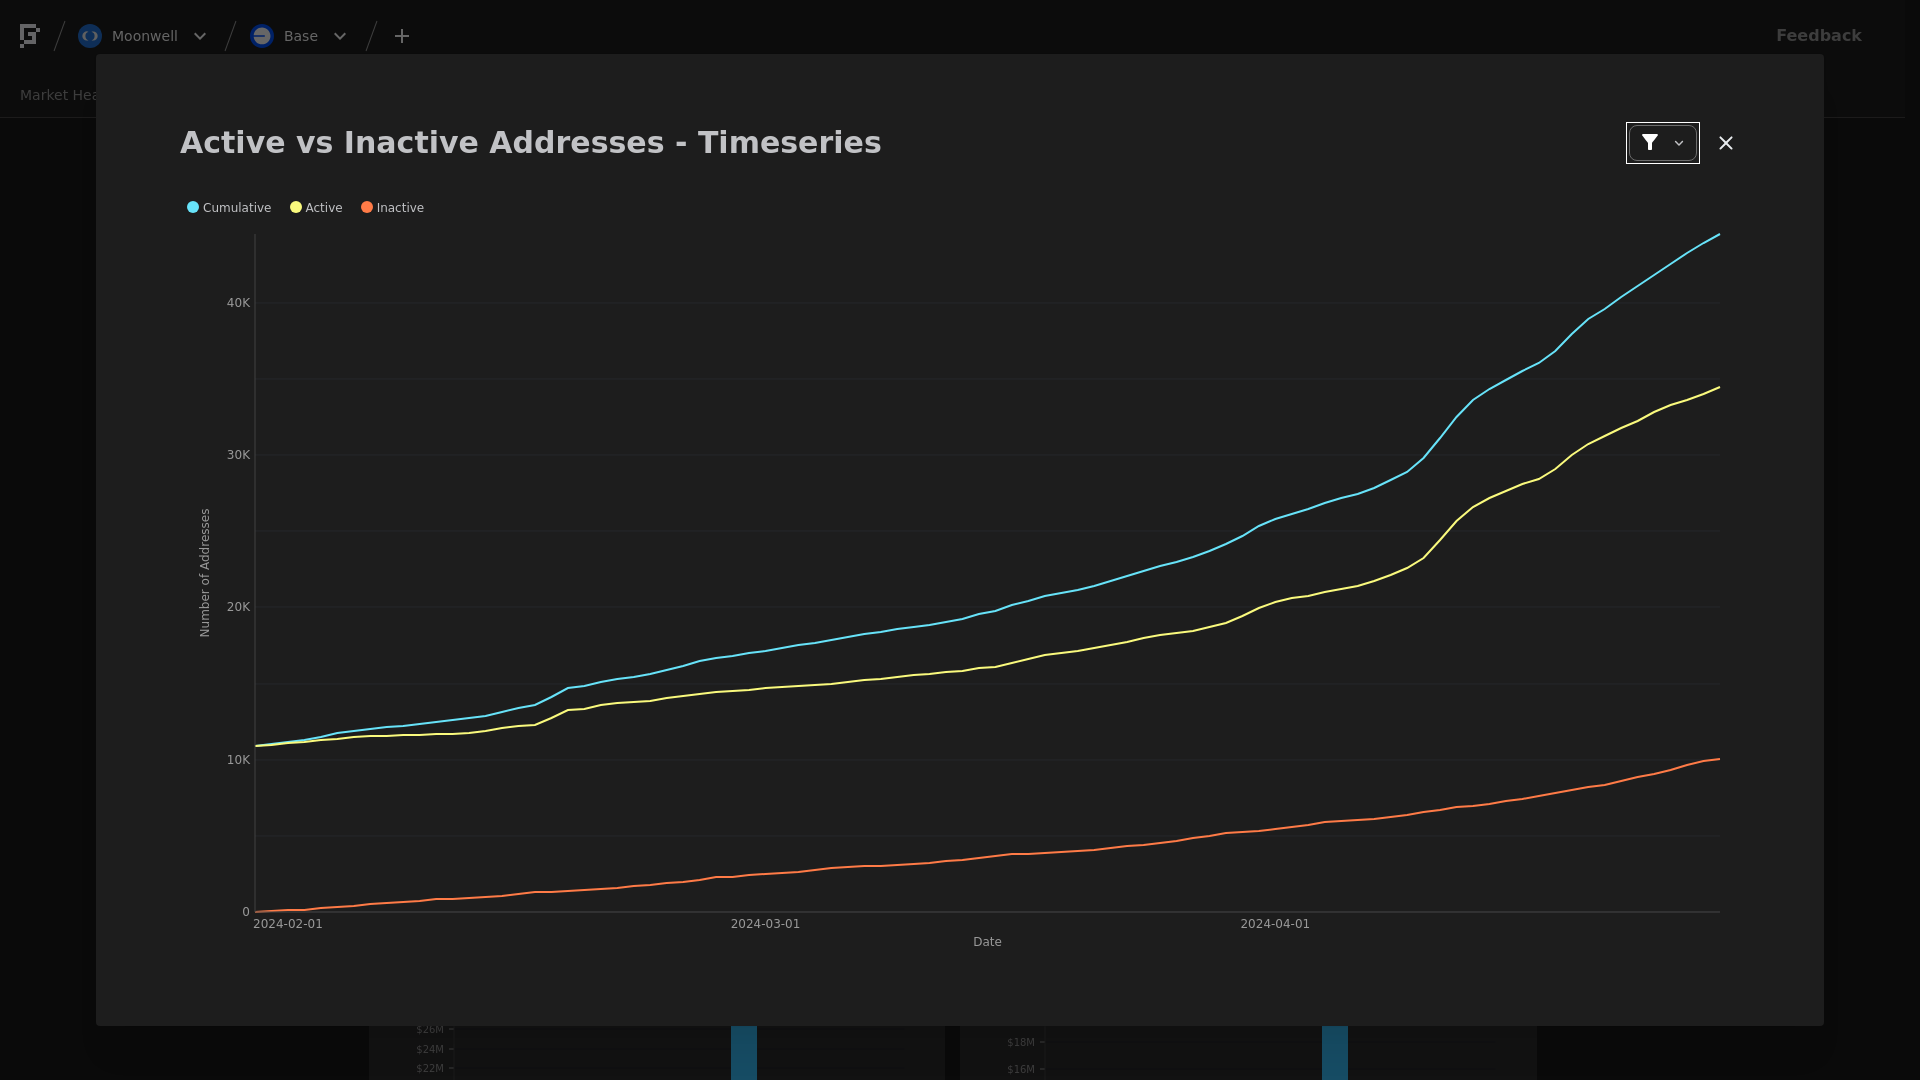
To see updated statistics, please see the live version of this graph [here](https://risk.gauntlet.network/protocols/moonwell/markets/base?fullscreen=market_health_timeseries_accounts).
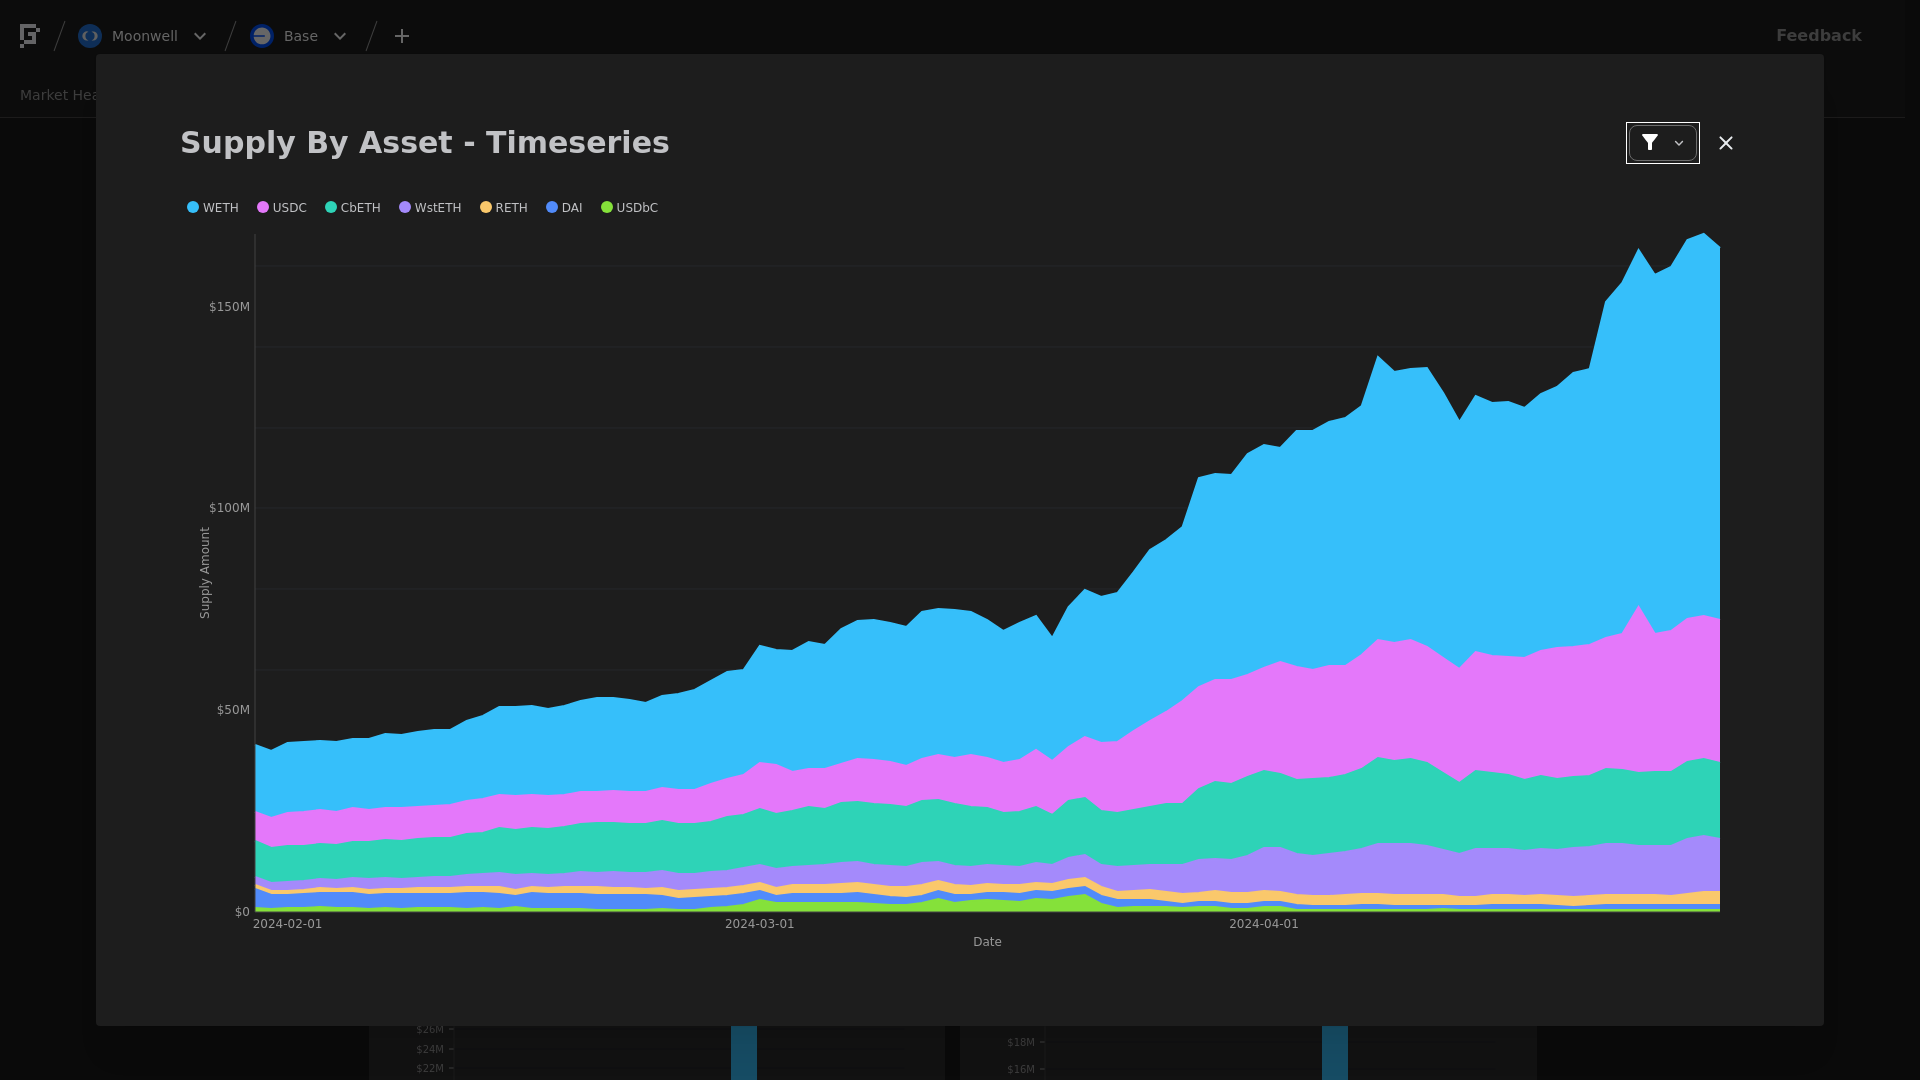
## Supply Trend
This graph shows the total supply of all assets over the time frame in question. To see updated statistics, please see the live version of this graph [here](https://risk.gauntlet.network/protocols/moonwell/markets/base?fullscreen=market_health_timeseries_asset_supply).
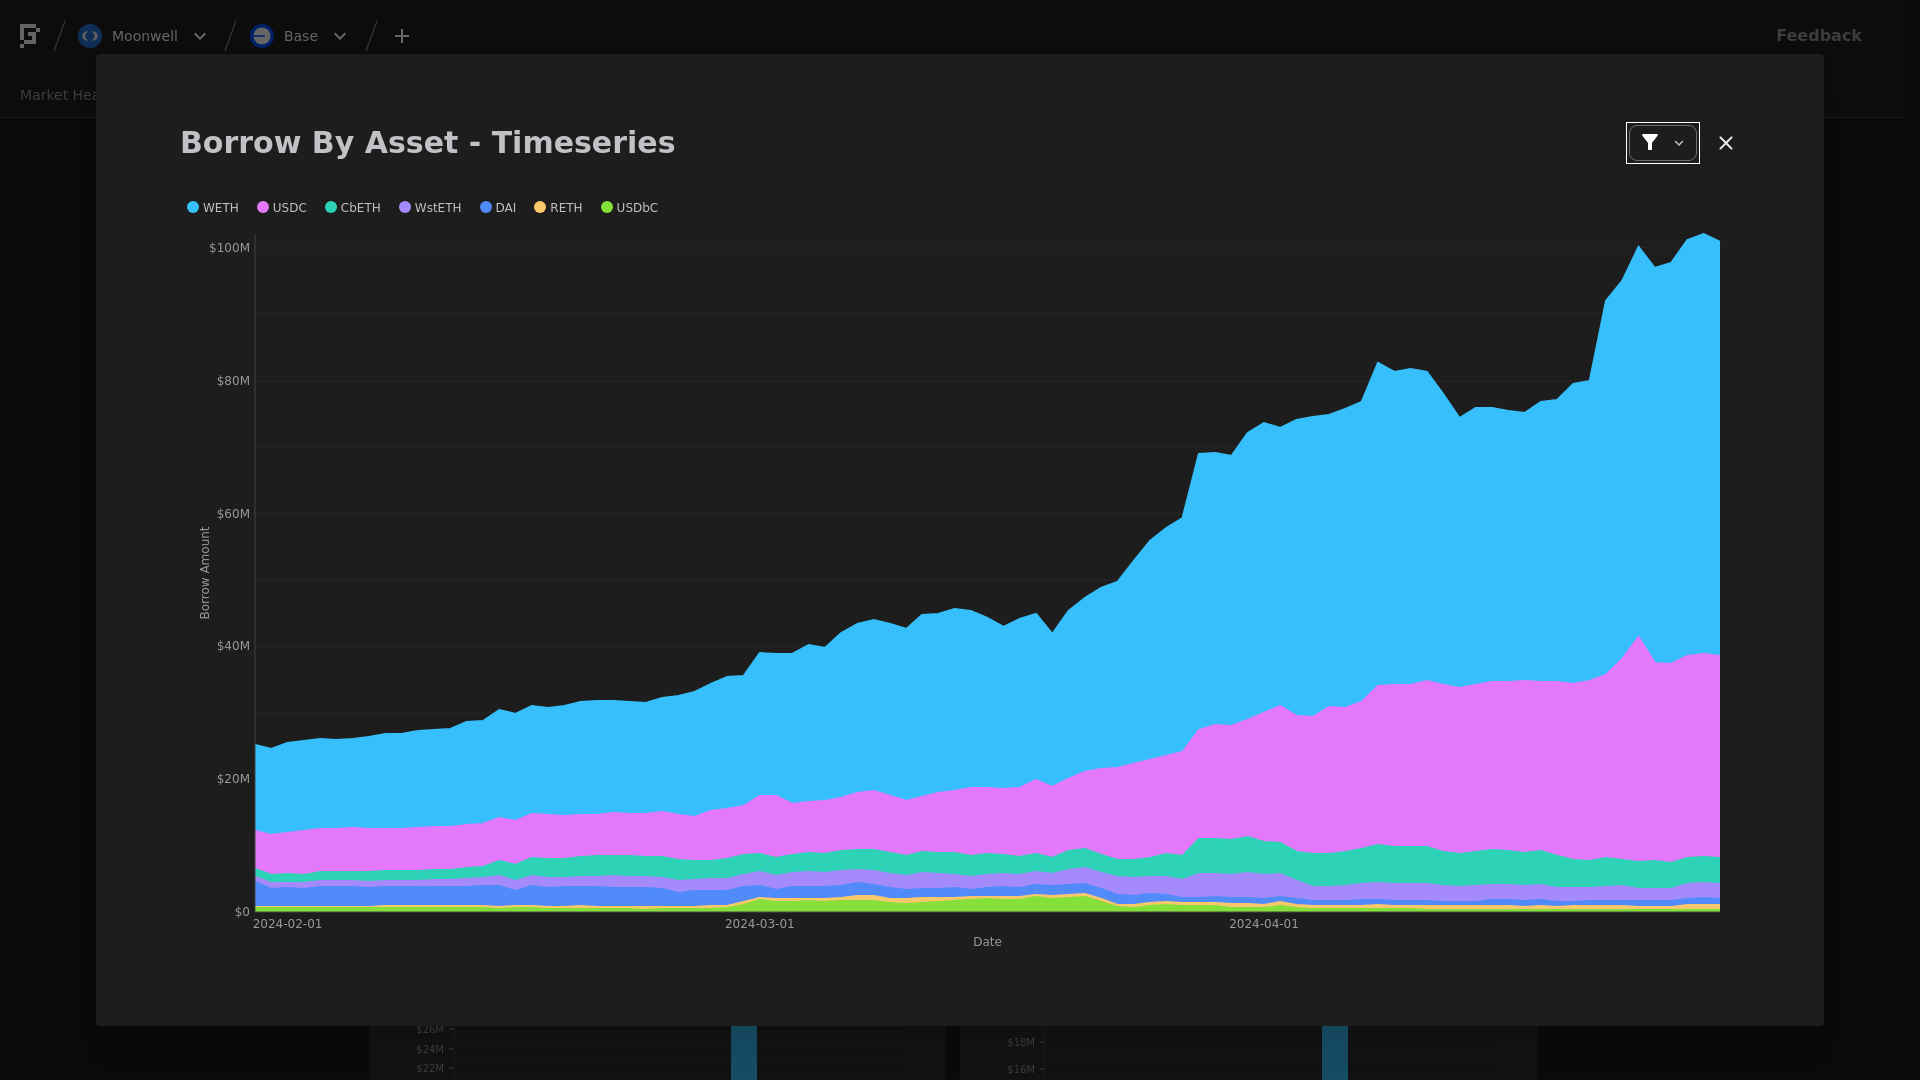
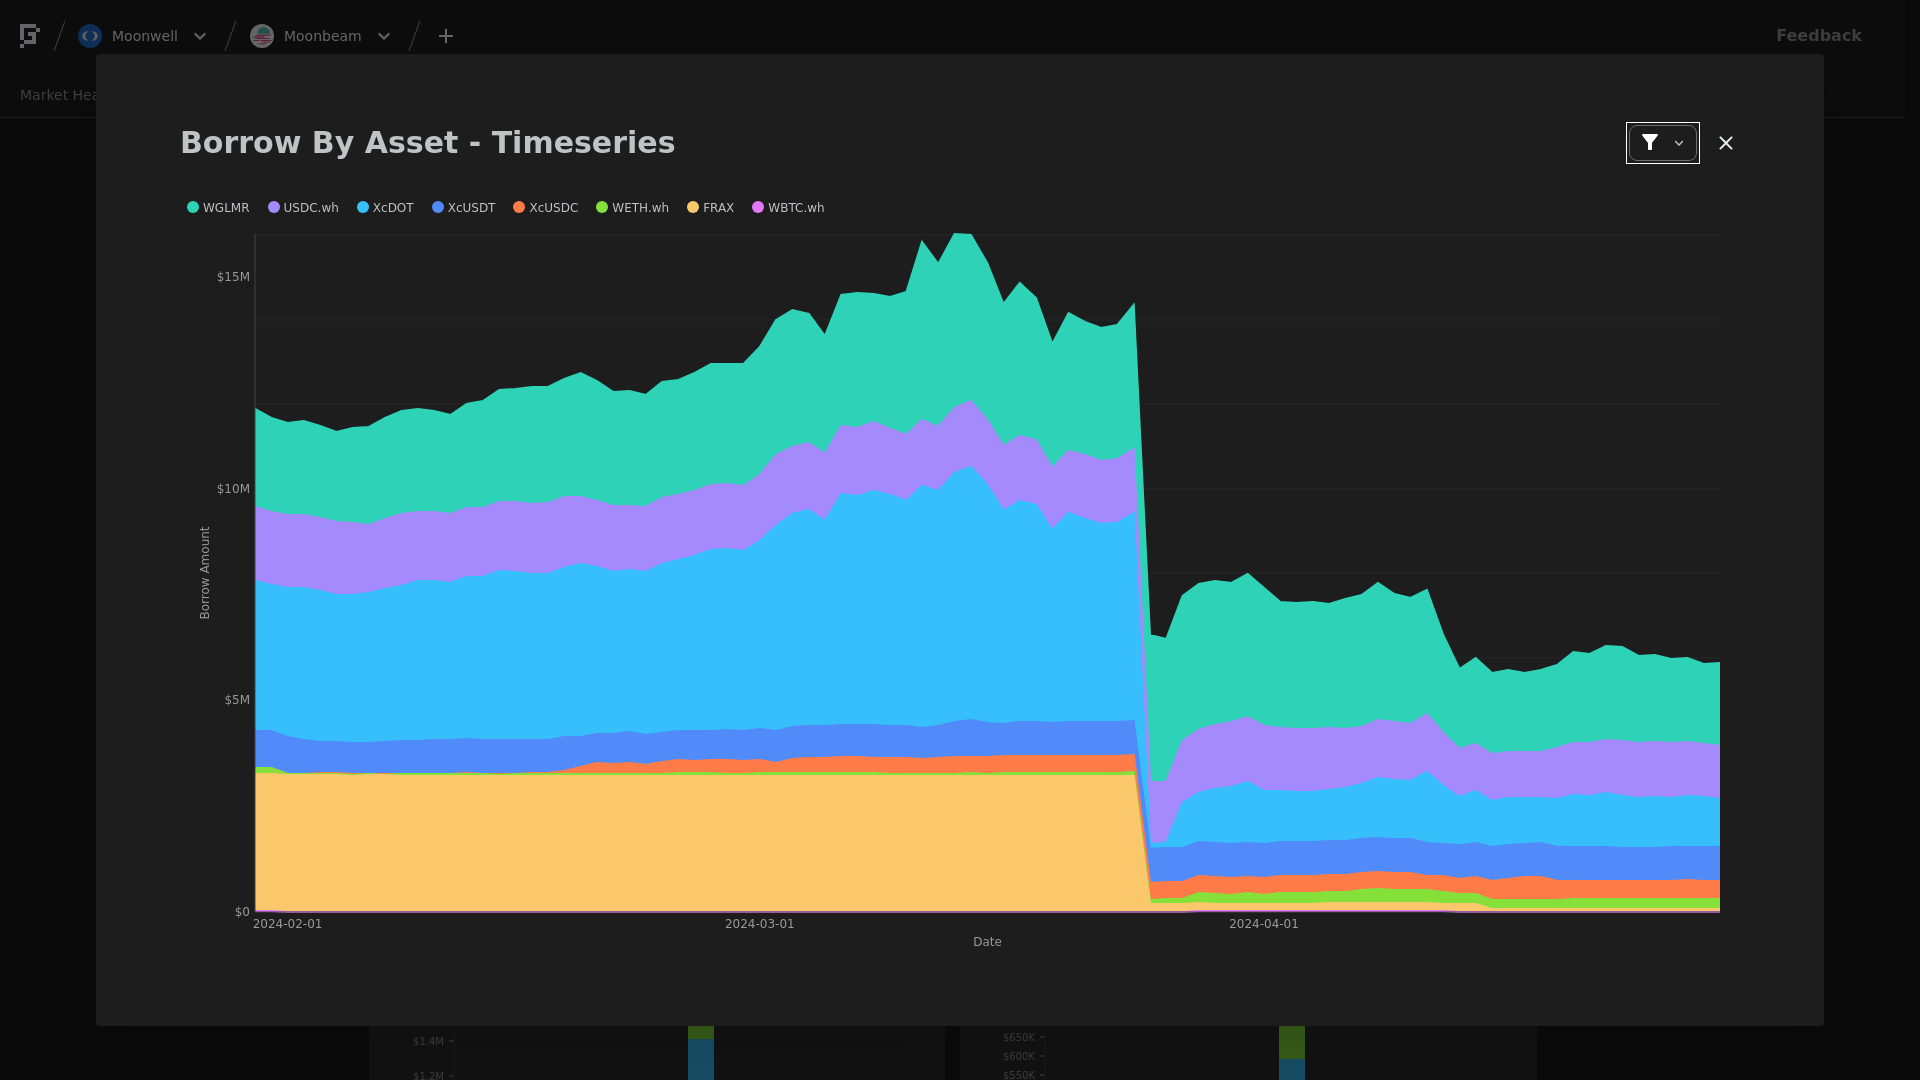
## Borrows Trend
This graph shows the total borrows of all assets over the time frame in question. To see updated statistics, please see the live version of this graph [here](https://risk.gauntlet.network/protocols/moonwell/markets/base?fullscreen=market_health_timeseries_asset_borrows).
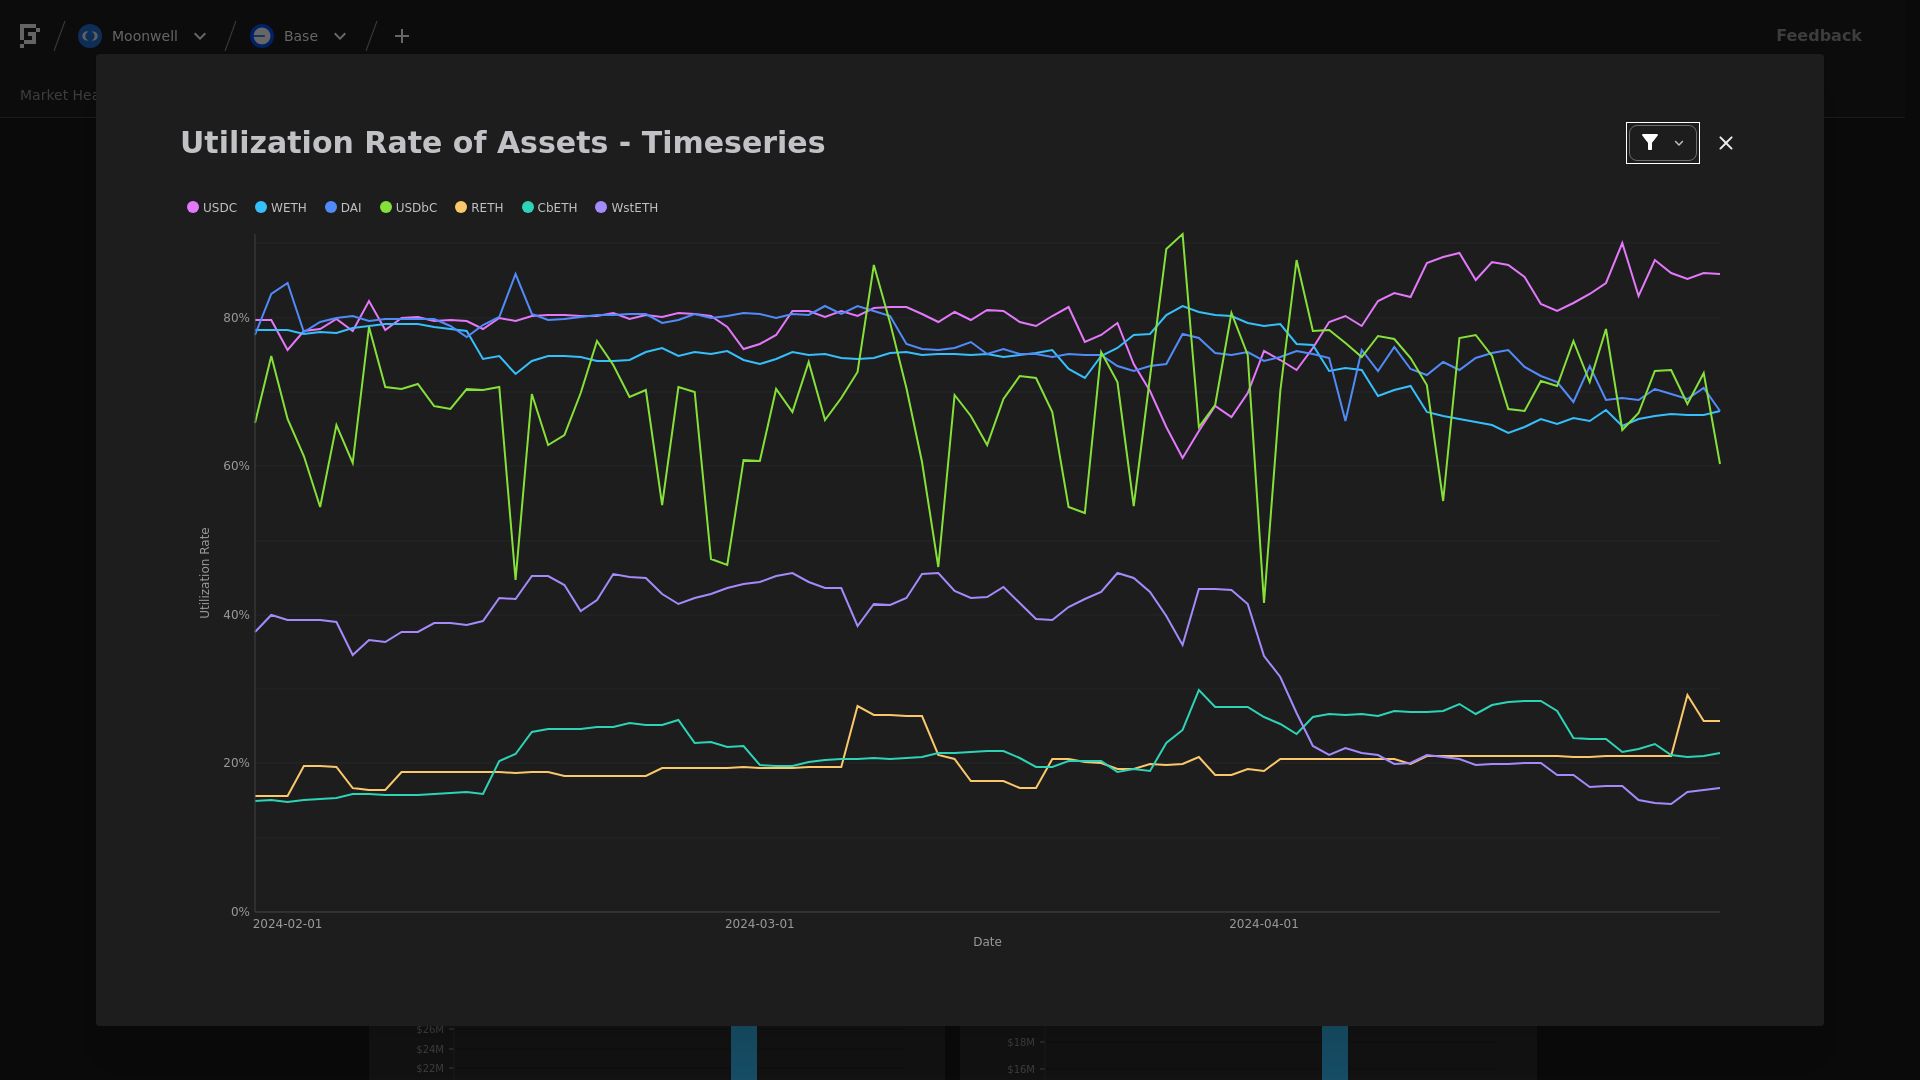
## Utilization Trend
This graph shows the utilization (borrow / supply) of all assets over the time frame in question.
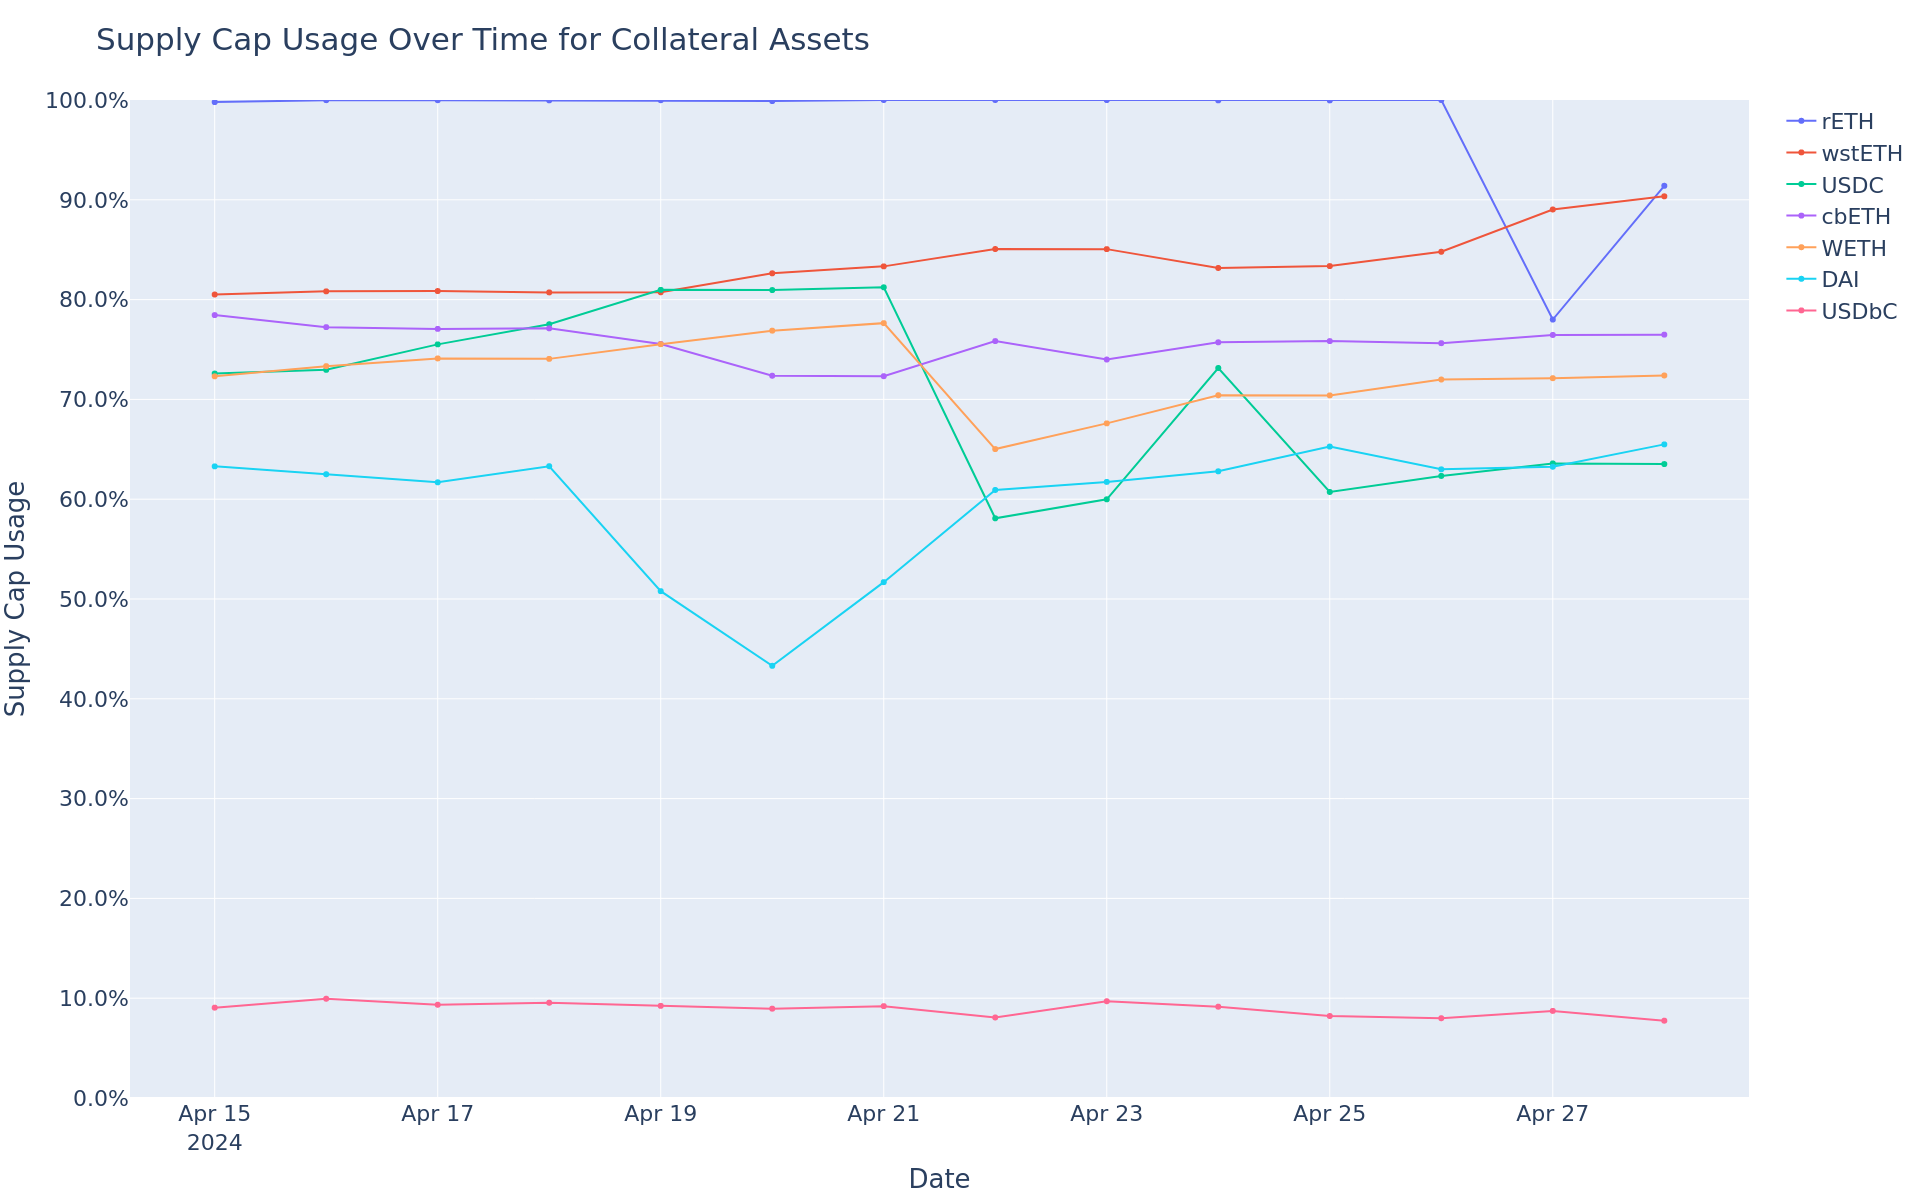
## Supply Cap Usage Trend
This graph shows the supply cap usage (supply / supply cap) of all assets over the time frame in question.
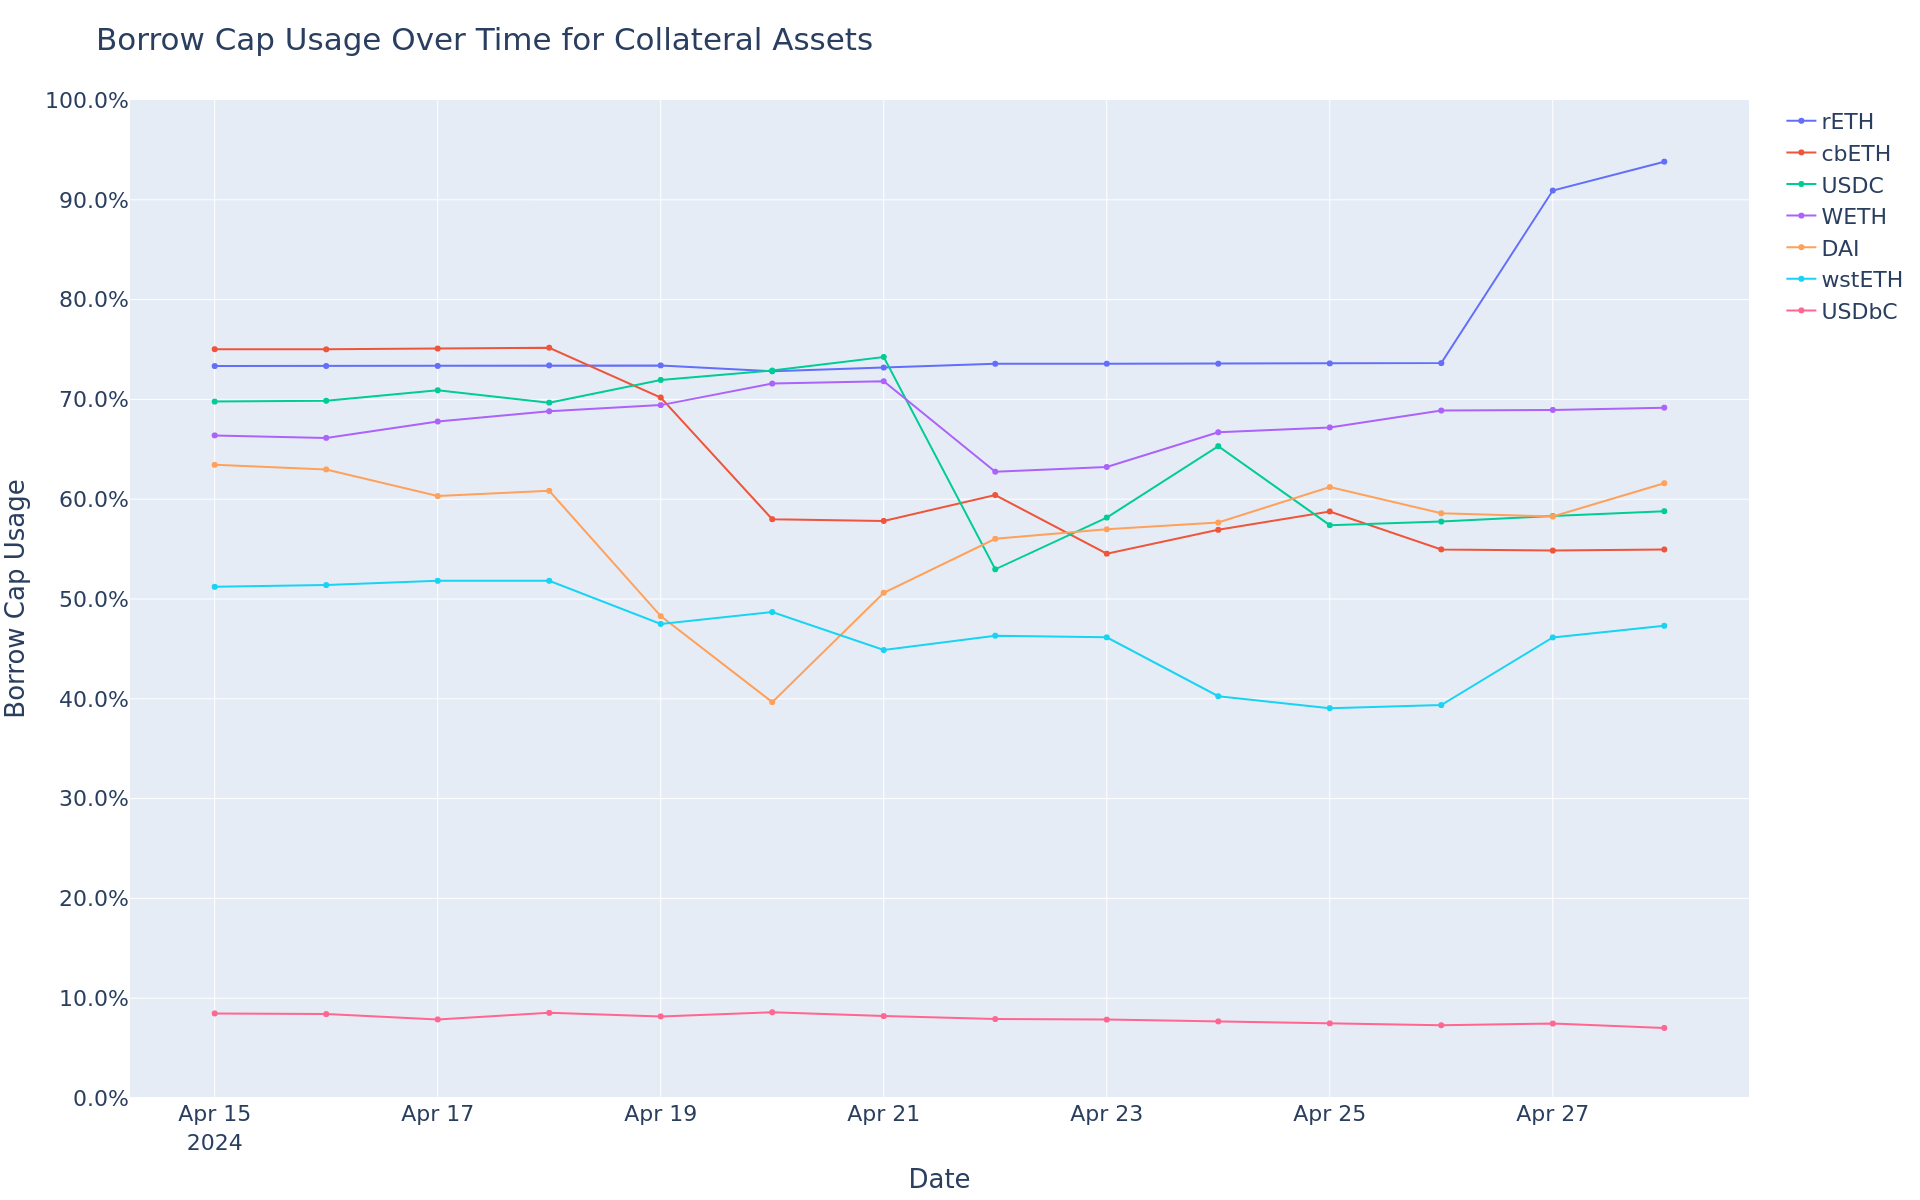
## Borrow Cap Usage Trend
This graph shows the borrow cap usage (borrow / borrow cap) of all assets over the time frame in question.
# Moonbeam
Gauntlet would like to provide the community with an update on this market over the previous week. Gauntlet is continuing to monitor this market. At this time, we do not recommend any parameter updates, but will keep the community informed.
## Summary
This table gives high-level statistics over the time frame in question. Bold lines correspond to weekly utilization over 75%.
| Asset | Current Borrow Cap | Average Borrow Cap Usage (Past Week) | Average Supply Balance (Past Week) | Average Utilization | Current Global 2% Depth (USD) |
|-------|------------|------------|------------------|------------------|------------------|
| WGLMR | 22.55M | 28.25% | 26.60M | 23.95% | $42.95K |
| FRAX | 5.25M | 1.18% | 1.31M | 4.71% | $2.61M |
| USDC.wh | 2.40M | 53.45% | 1.78M | 72.21% | $412.23M |
| xcDOT | 850.00K | 20.24% | 1.51M | 11.39% | $61.18K |
| **xcUSDT** | **800.00K** | **100.04%** | **1.03M** | **77.98%** | **$3.30K** |
| xcUSDC | 560.00K | 75.58% | 654.73K | 64.64% | $412.23M |
| WETH.wh | 500.00 | 14.70% | 335.80 | 21.89% | $115.18M |
| WBTC.wh | 50.00 | 0.35% | 130.89 | 0.13% | $48.70M |
## Top Movers
- WETH.wh's borrow balance increased WoW by 5% from $228K to $239K.
- WGLMR's borrow balance decreased WoW by 10% from $2M to $2M.
- WETH.wh's supply balance increased WoW by 5% from $1M to $1M.
- WGLMR's supply balance decreased WoW by 32% from $10M to $7M.
- WGLMR's utilization increased WoW by 33% from 22% to 29%.
- xcDOT's utilization decreased WoW by 2% from 12% to 11%.
## Liquidations
| Liquidated Asset | Liquidated Amount (Tokens) | Liquidated Amount (USD) |
|-------|----------|----------|
| mGLMR | 40.84K | $12.58K |
| mDOT | 60.45 | $404.72 |
## Weekly Annualized Reserve and Interest Projections

## Protocol Growth

To see updated statistics, please see the live version of this graph [here](https://risk.gauntlet.network/protocols/moonwell/markets/moonbeam?fullscreen=market_health_timeseries_accounts).
## Supply Trend
This graph shows the total supply of all assets over the time frame in question. To see updated statistics, please see the live version of this graph [here](https://risk.gauntlet.network/protocols/moonwell/markets/moonbeam?fullscreen=market_health_timeseries_asset_supply).

## Borrows Trend
This graph shows the total borrows of all assets over the time frame in question. To see updated statistics, please see the live version of this graph [here](https://risk.gauntlet.network/protocols/moonwell/markets/moonbeam?fullscreen=market_health_timeseries_asset_borrows).
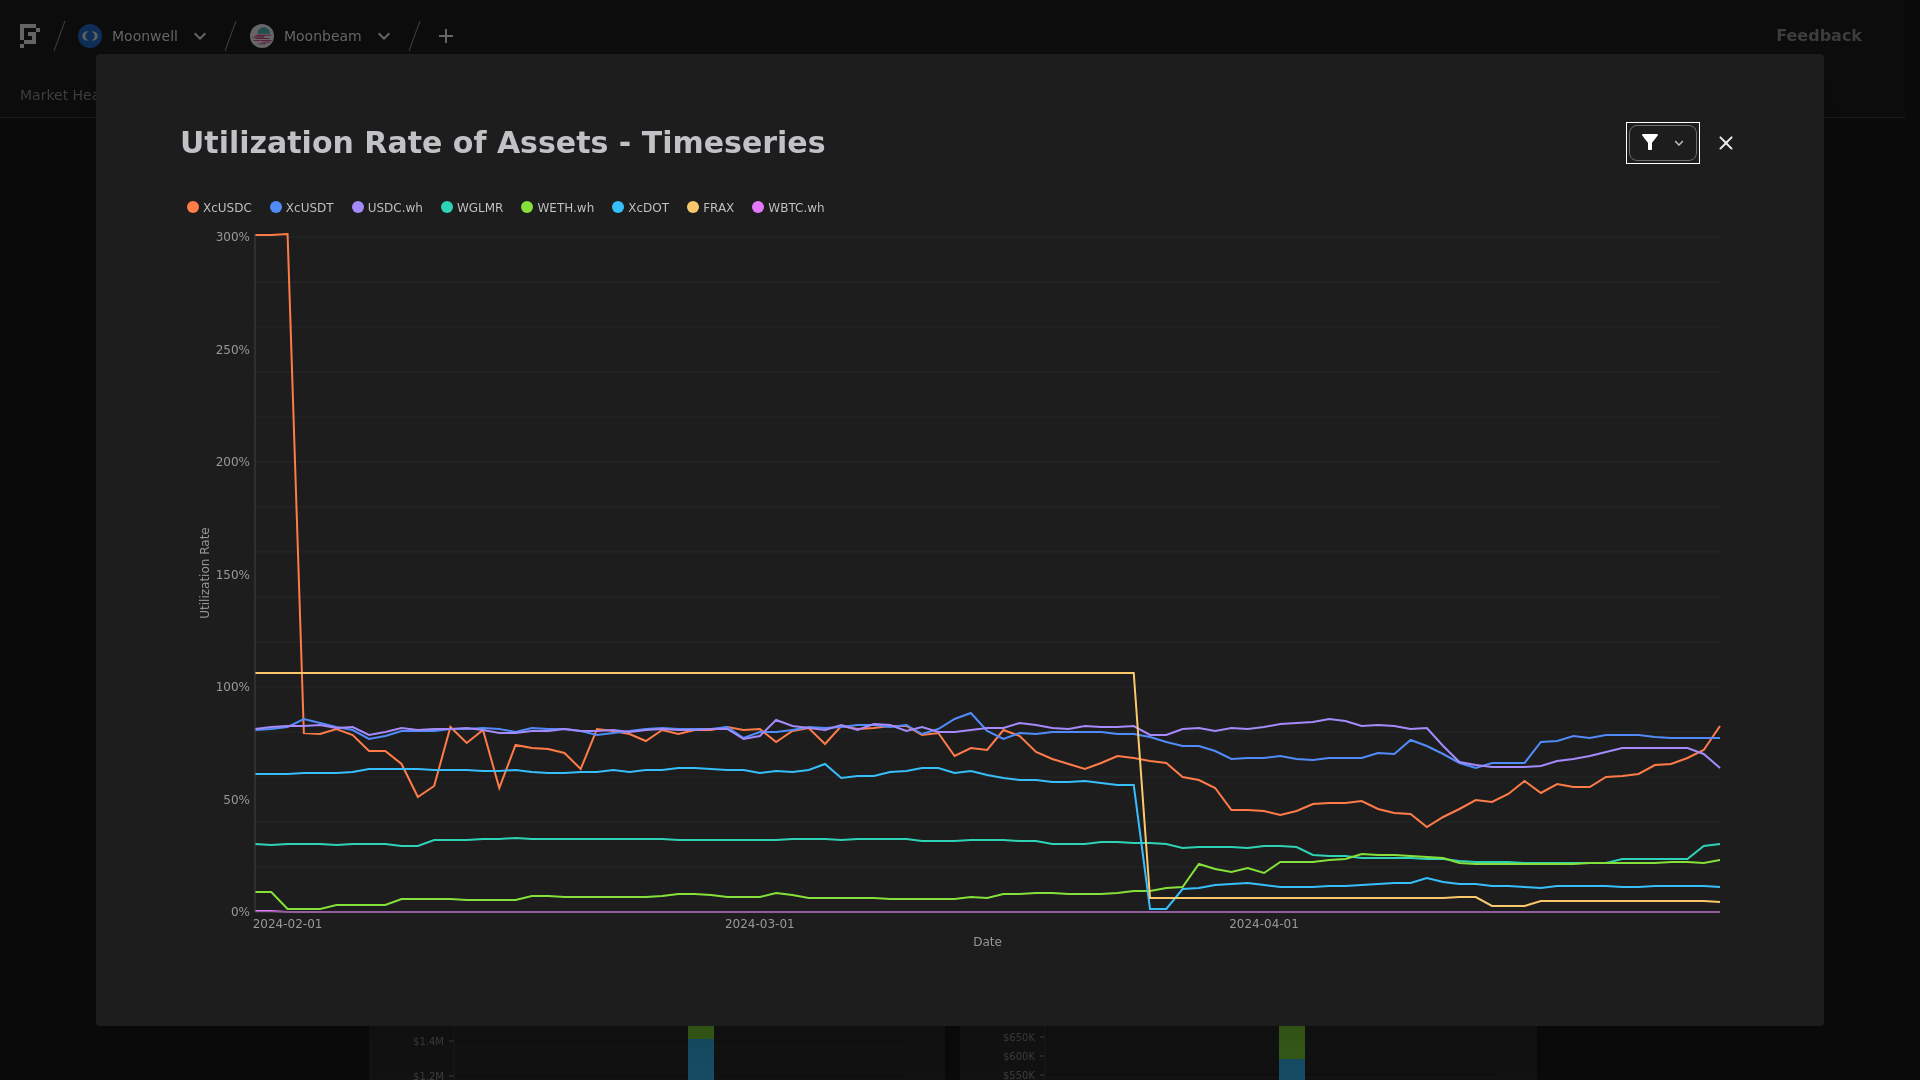
## Utilization Trend
This graph shows the utilization (borrow / supply) of all assets over the time frame in question.
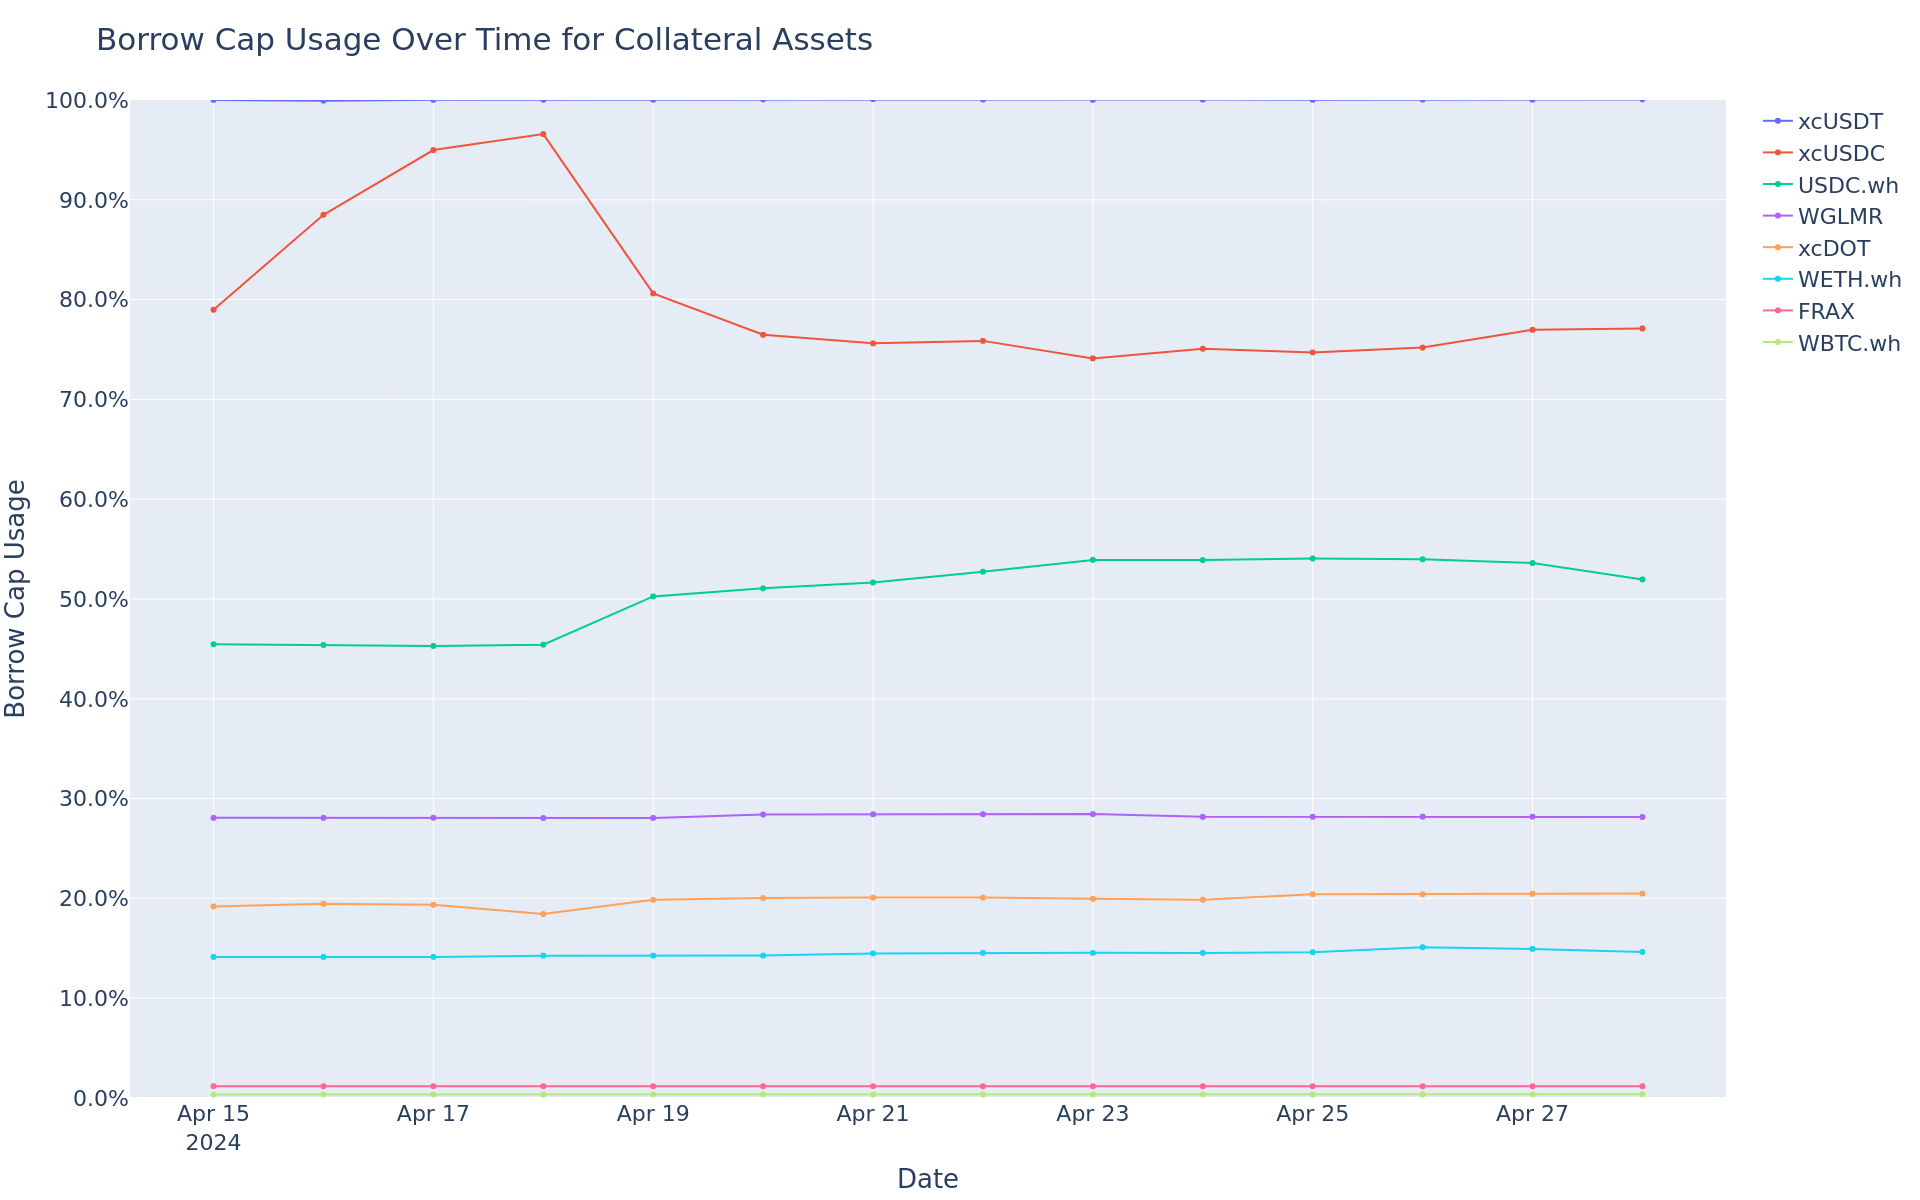
## Borrow Cap Usage Trend
This graph shows the borrow cap usage (borrow / borrow cap) of all assets over the time frame in question.
# Moonriver
Gauntlet would like to provide the community with an update on this market over the previous week. Gauntlet is continuing to monitor this market. At this time, we do not recommend any parameter updates, but will keep the community informed.
## Summary
This table gives high-level statistics over the time frame in question. Bold lines correspond to weekly utilization over 75%.
| Asset | Current Borrow Cap | Average Borrow Cap Usage (Past Week) | Average Supply Balance (Past Week) | Average Utilization | Current Global 2% Depth (USD) |
|-------|------------|------------|------------------|------------------|------------------|
| **FRAX** | **270.00K** | **53.02%** | **161.10K** | **88.85%** | **$2.61M** |
| WMOVR | 20.00K | 67.10% | 154.29K | 8.70% | $578.01K |
## Top Movers
- FRAX's borrow balance decreased WoW by 6% from $145K to $137K.
- FRAX's supply balance decreased WoW by 17% from $185K to $154K.
- FRAX's utilization increased WoW by 13% from 79% to 89%.
- No Asset has supply or borrow cap usage above 75%.
## Liquidations
| Liquidated Asset | Liquidated Amount (Tokens) | Liquidated Amount (USD) |
|-------|----------|----------|
| mMOVR | 7.85 | $107.03 |
| mxcKSM | 3.32 | $95.88 |
## Weekly Annualized Reserve and Interest Projections

## Protocol Growth

To see updated statistics, please see the live version of this graph [here](https://risk.gauntlet.network/protocols/moonwell/markets/moonriver?fullscreen=market_health_timeseries_accounts).
## Supply Trend
This graph shows the total supply of all assets over the time frame in question. To see updated statistics, please see the live version of this graph [here](https://risk.gauntlet.network/protocols/moonwell/markets/moonriver?fullscreen=market_health_timeseries_asset_supply).

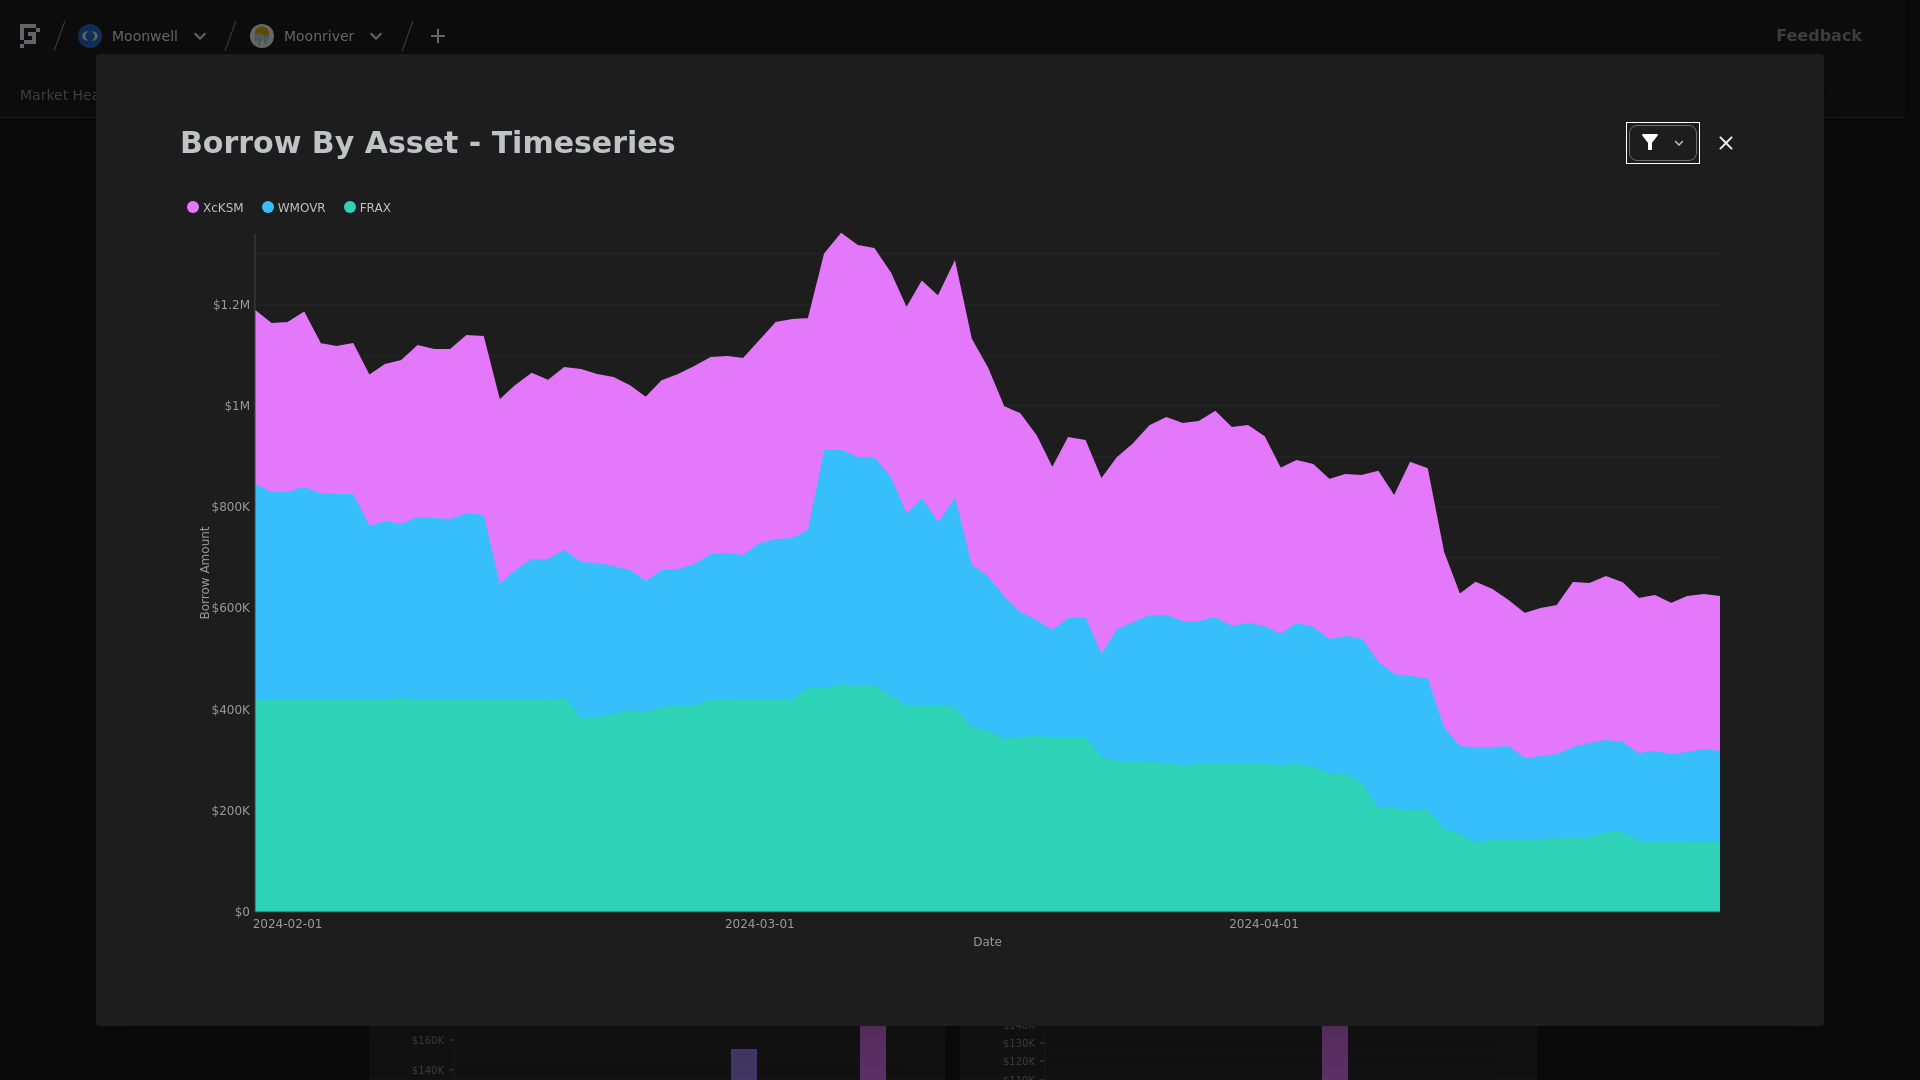
## Borrows Trend
This graph shows the total borrows of all assets over the time frame in question. To see updated statistics, please see the live version of this graph [here](https://risk.gauntlet.network/protocols/moonwell/markets/moonriver?fullscreen=market_health_timeseries_asset_borrows).
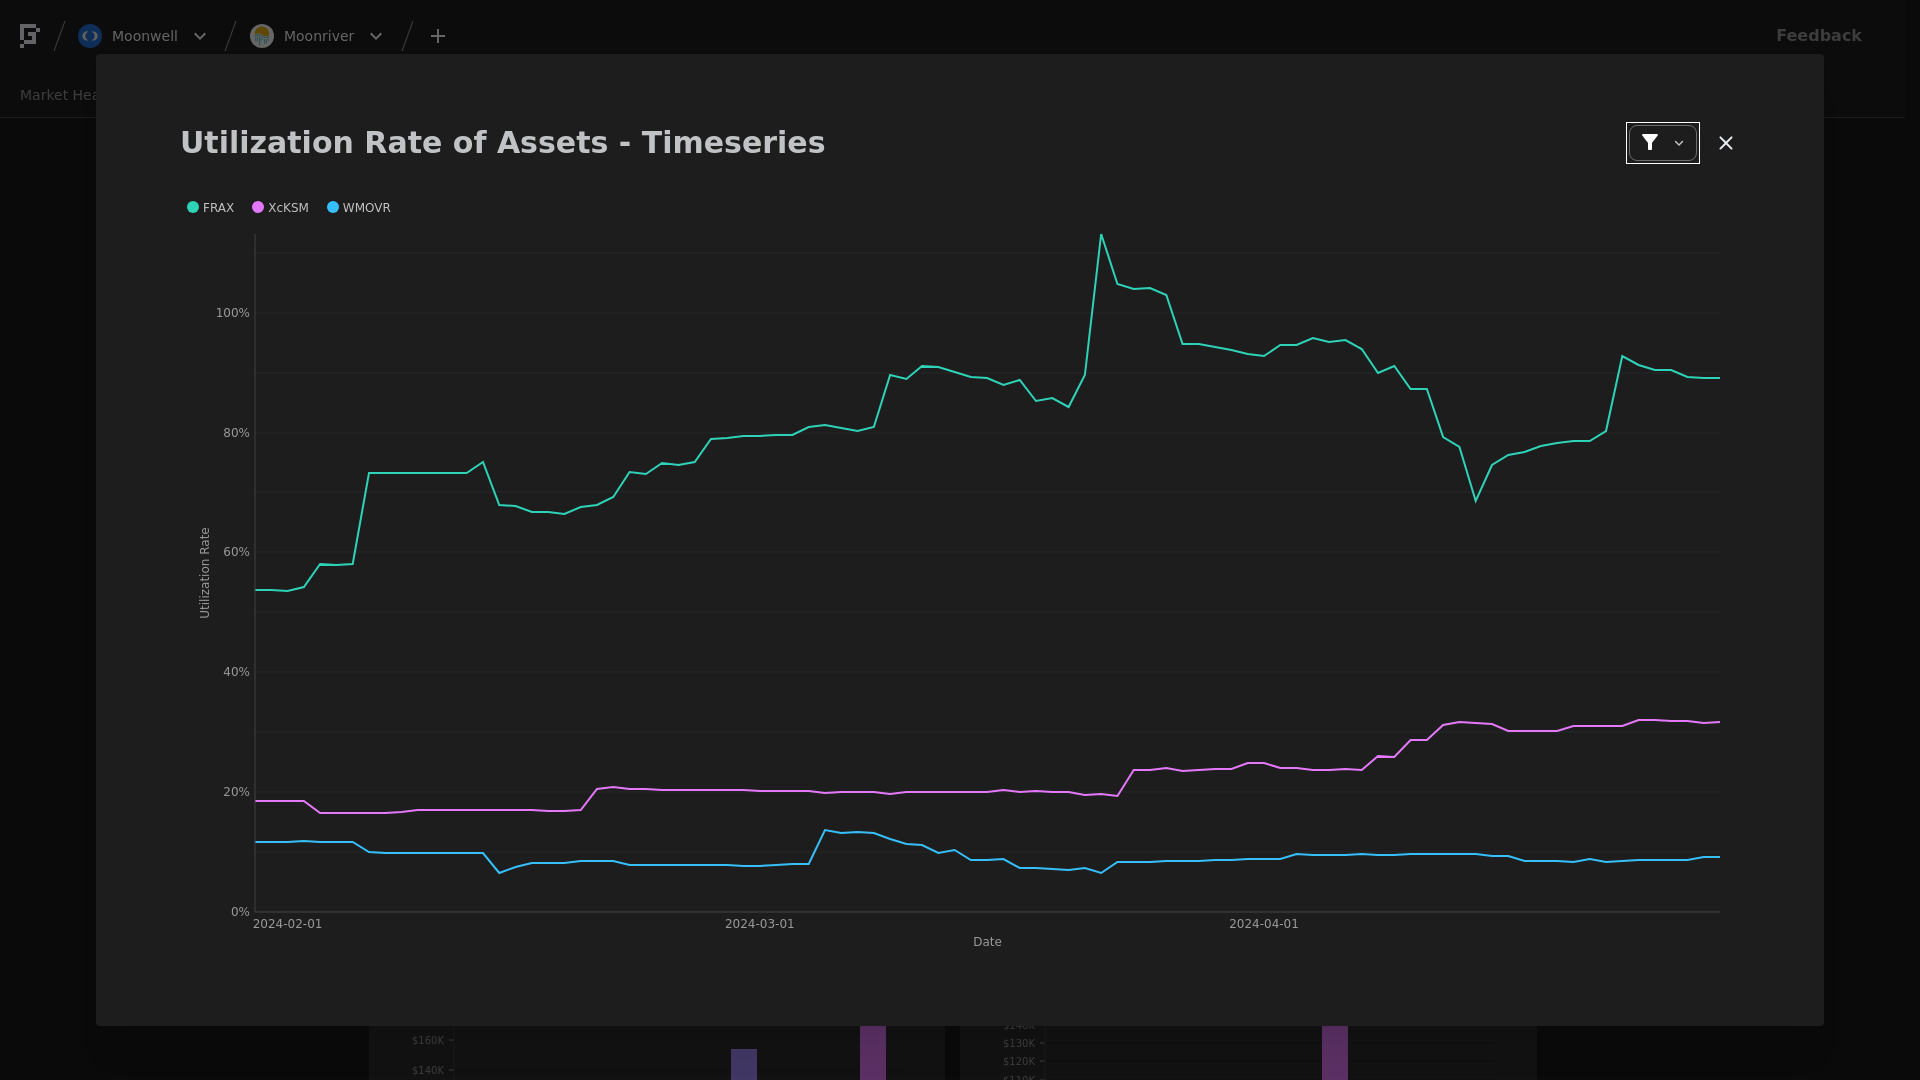
## Utilization Trend
This graph shows the utilization (borrow / supply) of all assets over the time frame in question.
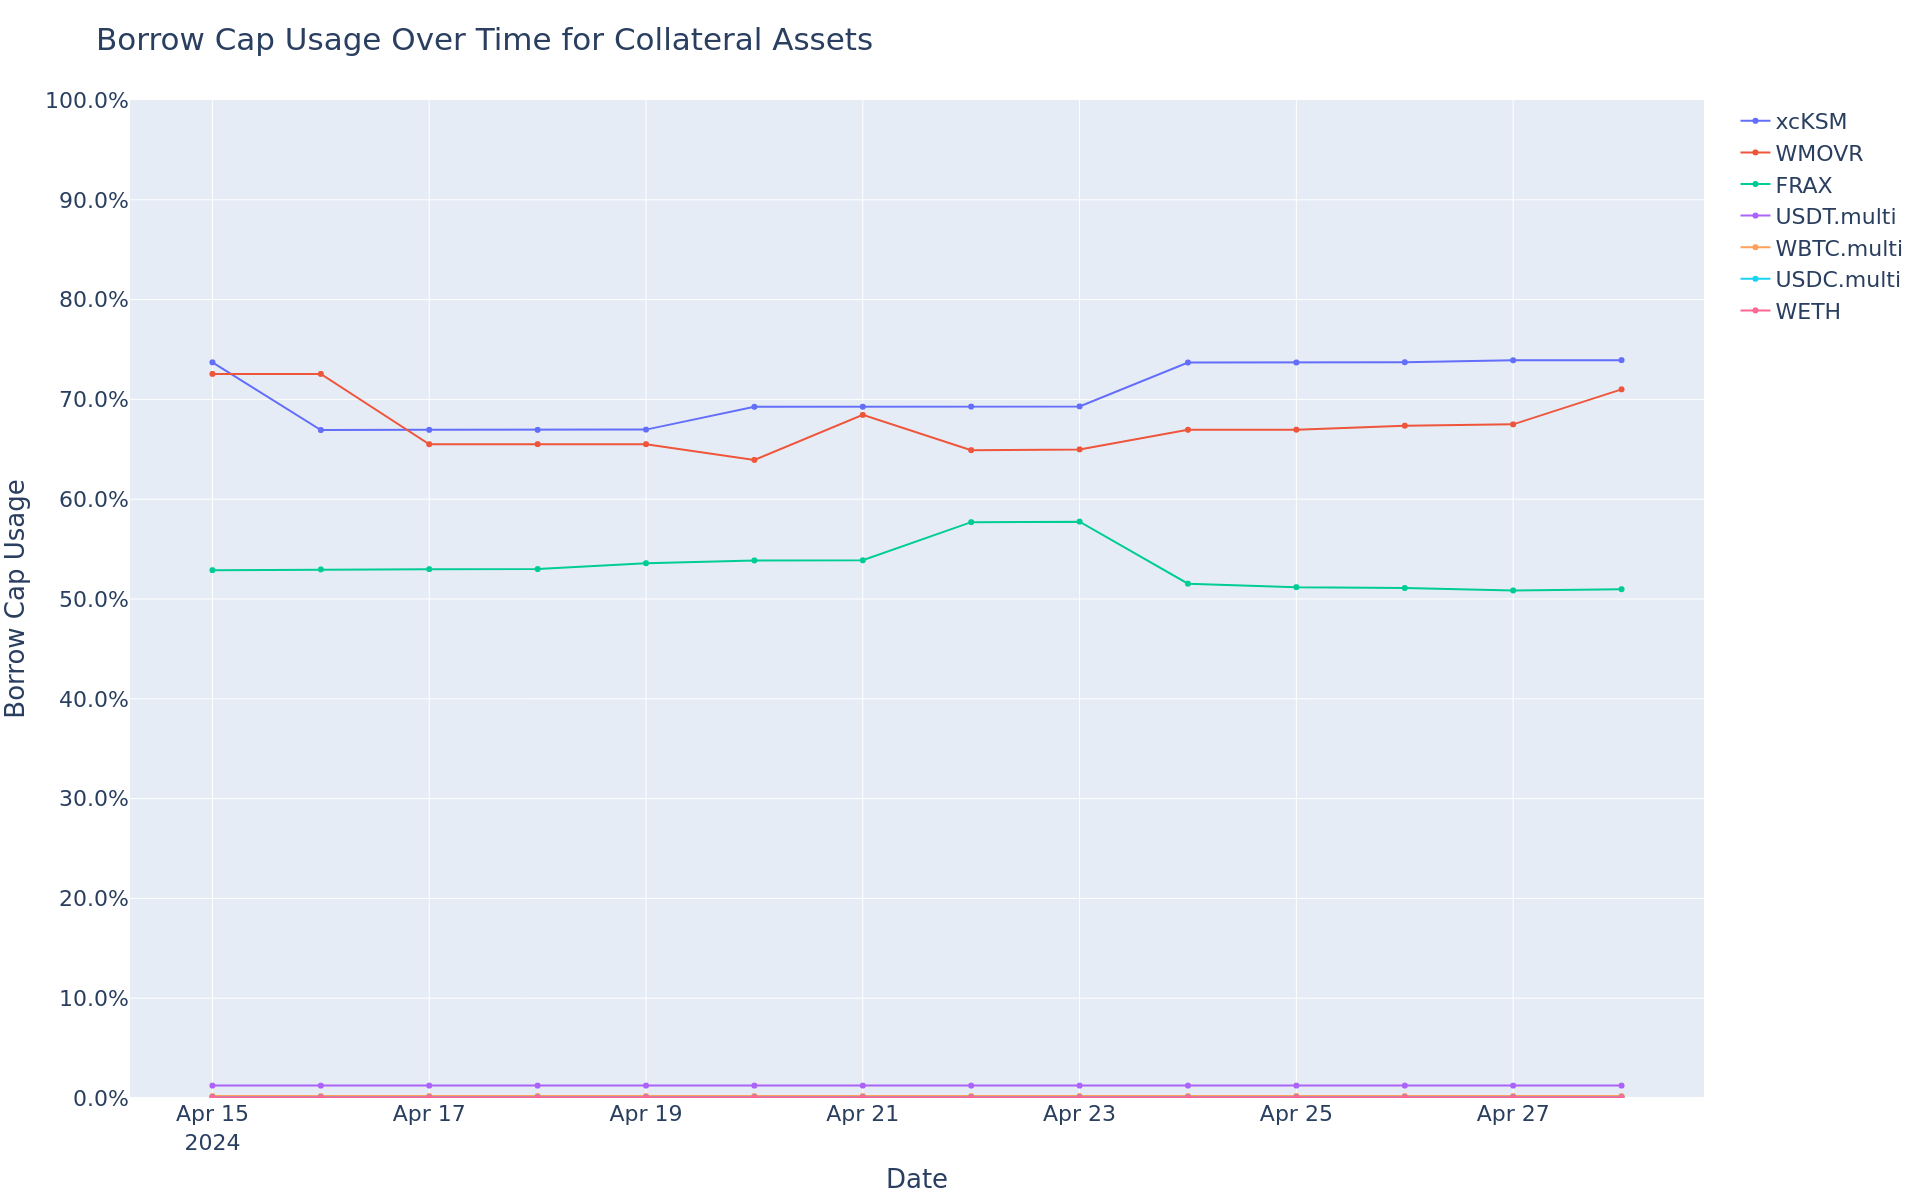
## Borrow Cap Usage Trend
This graph shows the borrow cap usage (borrow / borrow cap) of all assets over the time frame in question.
 Sign in with Wallet
Connect another wallet
Sign in with Wallet
Connect another wallet