# A basic guide for Python profiling
* A dynamic performance analysis that measures the behavior (incl. time and space complexity) of a program.
* Commonly, this technique serves for performance optimization.
* 程式好慢... 慢在哪裡 (Hotspot analysis)?為什麼慢 (Performance bottleneck)?怎麼加速 (Optimization)?
* 忽快忽慢?下次 Jsaon 分享 pytest-benchmark
## Motivation: Knowing the behavior to plan an optimization strategy
* Find the **hotspot** of a program.
* **Amdahl's law**: Don't spend too much effort on minor things. 
* Do profiling in a **top-down** manner, instead of bottom-up.
* Find the reason for the slowness (**bottleneck**).
* **Von Neumann architecture**

* **xxx-bound / xxx is the bottleneck**: The device on which the program spends the most. (e.g., CPU-bound, memory-bound, IO-bound, GPU-bound)
## Hotspot analysis
* Find the hot code segment.
### cProfile
* Documentation: https://docs.python.org/3/library/profile.html
* Why **c**Profiler? It’s a C extension with less overhead.
* **Record the trace of a program.**
* Profile the entire program.
```bash
python -m cProfile -o output_file (-m module | myscript.py)
```
* Profile a code segment.
```python
# Python 3.8+
import cProfile
with cProfile.Profile() as pr:
...
pr.dump_stats("stats")
```
```python
import cProfile
pr = cProfile.Profile()
pr.enable()
# ...
pr.disable()
pr.dump_stats("stats")
```
* **Flat report**
* Enter the interactive shell of `Stats`.
```bash
python3 -m pstats STATS_FILE
```
* Commands
* help
* sort (cumtime | tottime | ...)
* **cumtime**: Accumulated time incl. subroutines. Commonly used to find the hotspot in a high level.
* **tottime**: Accumulated time not incl. subroutines. Commonly used to find the exact hotspot.
* reverse: Reverse the list.
* stats [n]: Print the report (with the leading n rows).
* Result

* **Call-graph report**
* `gprof2dot` is a powerful tool to visualize a variety of profiler outputs, including `gprof`, `cProfile`, `Valgrind`.
* Repo: https://github.com/jrfonseca/gprof2dot
* Usage:
```bash
gprof2dot -f pstats STATS_FILE | dot -Tpng -o output.png
```
* Result:

### line_profiler
* Line-by-line profiling
* Repo: https://github.com/rkern/line_profiler
* Usage
* Annotate the function of interest.
```python
@profile
def foo():
...
```
* Collect the trace of the program
```bash
kernprof -l program.py
```
* Get the flat report
```bash
python -m line_profiler program.py.lprof
```
* Result

### Pitfalls
* Mind the caches (e.g., application cache, page cache)
* Mind the lazy evaluation (e.g., NumPy)
* Mind the input sensitivity (e.g., excisional biopsy slides vs needle biopsy slides)
* Mind the noises (e.g., chenchc is running a program named thrashing.py)
## Find the performance bottleneck: Scratch the surface through system monitoring
* Quantitatively collect metrics of the whole program to roughly determine **the bottleneck of a program with nearly no effort**.
* CPU-bound
* Memory-bound
* IO-bound
* Background
* **Program**: A sequence or a set of instructions. CPU can only identify machine codes, so high-level programs must be compiled (C/C++) or interpreted (Python) before execution.
* **User-space** and **kernel-space**:
* A user program can only access ALU and its memory space (i.e., user-space operations) without a system call.

* **Interrupt**: A request for the processor to interrupt the currently executing process.
* **TL;DR: Interrupts are expensive and mostly related to inefficient memory access and IO.**
* Common interrupt types:
* **System call (a.k.a. trap)**: e.g., requesting the OS to open a file.
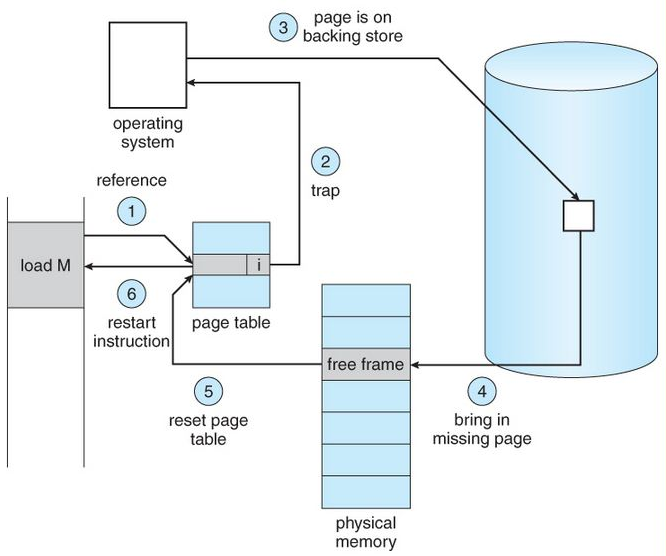
* **Page fault**: e.g., accessing the newly opened file through memory mapping. (這個水很深...)
* **IO signal**: e.g., the SSD has read the requested page of the file and signals the CPU to handle it.
* **Exception**: e.g., 1.0 / 0.0 raises a divided-by-zero exception.
* **Timer interrupt**: For scheduling.
* Handling interrupt is time-consuming.
* Common metrics:
* **Execution time (a.k.a. wall-clock time, real time)**
* **User-space CPU time (a.k.a. CPU time, user time)**
* **CPU time**: Summation of the time spent on each CPU core.
* **User-space time**: Time spent in the running state, not including sleep state caused by interrupts.
* If user time / (real time * parallelism) ~ 1.0, the program is CPU-bound.
* **Kernel-space CPU time (a.k.a. sys time)**
* Time dealing with interrupts.
* If this value is extremely high, the whole system will be stuck. The situation is called **thrashing**. Mostly, the direct reason is **excessive page faults**, and the reason behind is **the huge number of inefficient memory accesses**.
* **Memory consumption (a.k.a., working set size, residence set size)**
* Tools (I think you should be already familiar with these.)
* time (bash command)
* `time python foo.py`
* /usr/bin/time
* `/usr/bin/time python foo.py`
* 
* top
* htop

* timeit (Python module)
* `python -m timeit -- 'from foo import bar; bar()'`
* ```python
import timeit
from foo import bar
if __name__ == "__main__":
print(timeit.timeit(bar))
# or `timeit.Timer(bar).autorange()` to automatically select a proper number of iterations.
```
* IPython
```python
In [1]: from foo import bar()
In [2]: %timeit bar()
```
* 
## Strategy for optimization
* **CPU-bound** (a.k.a., compute-bound)
* Implement the algorithm with less **time** complexity.
* Use an application-level cache: Trade space for time.
* Use C-based libraries.
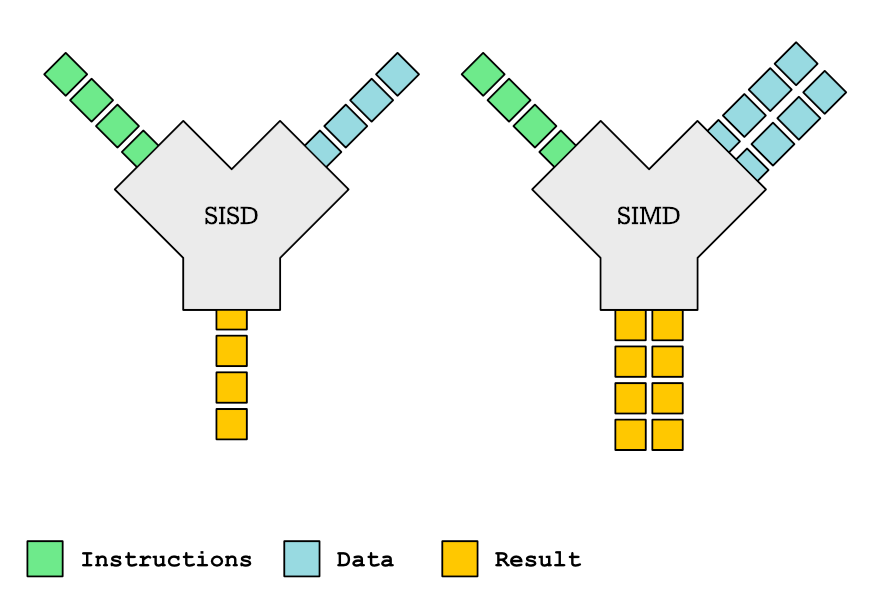
* Compilation enables the program to optimize instruction-level parallelism (ILP) and data-level parallelism (DLP).
* Exploit thread-level parallelism (TLP).
* multiprocessing
* concurrent.futures
* OpenMP (in C/C++)
* GPU offloading.
* Use PyTorch operations to replace compute-intensive NumPy operations.
* **Memory-bound**
* Implement the algorithm with less **space** complexity.
* Use an application-level cache.
* Use C-based libraries.
* Compilation enables the program to optimize cache friendliness.

* Increase the **locality** of memory access.
* Bad
```python
patch = image[10000:12345, 10000:12345, :]
new_patch = complex_preprocess(patch)
```
* Good
```python
patch = image[10000:12345, 10000:12345, :].ascontiguousarray()
new_patch = complex_preprocess(patch)
```
* **Multithreading and GPU can make it worse!**
* **IO-bound**
* Use an application-level cache.
* Increase the **locality** of data access.
* Sequential access is better than random access.
* **Multithreading and GPU can make it worse!**
* Use cash $$$
 Sign in with Wallet
Connect another wallet
Sign in with Wallet
Connect another wallet