# DIOTP - C7
## C7 - Data source
---
# Motivation
Automate dataflow to analytic services.
---
# Data source in IoT
- Host utilization (Metrics)
- Log files (Events)
- Web-traffic
- System services
- Etc...
---
# TICK Stack
- Telegraf: Data collecting agent
- InfluxDB: Time-series database
- Chronograf: Data visualization and dashboard
- Kapacitor: Real-time streaming and alerting engine.
[Introduction to TICK stack](https://www.influxdata.com/blog/introduction-to-influxdatas-influxdb-and-tick-stack/)
---
# Practice part
Prerequisites:
1. Remote access to a VPS (SSH)
3. Access to InfluxDB Dashboard (SSH Tunnel)
```bash
# Configured SSH tunnel
cat ~/.ssh/config
# Connect to SSH tunnel
ssh username@vps-tunnelname
```
---
# Data agent
[Telegraf](https://www.influxdata.com/time-series-platform/telegraf/)
Maps data source to designated storage. Data source must be active e.g., know how to send data to telegraf input. Can modify the incoming data before storing. Many supported storage types. InfluxDB works well as destination storage.
1. Install telegraf
2. Get started with telegraf
3. View data in InfluxDB Dashboard
Telegraf documentation
---
## 1. Install telegraf
[https://docs.influxdata.com/telegraf/v1/install/](https://docs.influxdata.com/telegraf/v1/install/)
---
## 2. Get started with Telegraf
1. Configure telegraf
2. Set environment variables
3. Start telegraf
Documentation: [https://docs.influxdata.com/telegraf/v1/get-started/](https://docs.influxdata.com/telegraf/v1/get-started/)
---
### 2.1. Configure telegraf
Documentation: [https://docs.influxdata.com/telegraf/v1/get-started/#configure-telegraf](https://docs.influxdata.com/telegraf/v1/get-started/#configure-telegraf)
Using `sample-config` with input-filter `cpu:mem`.
---
# Telegraf config parts
Configuration sections:
1. Agent - Controls agent's general behaviour
2. Input - Data source
3. Output - Data output to destinations.
4. Aggregate - Combines metrics into one
5. Processor - Modifies/transforms collected data
[https://docs.influxdata.com/telegraf/v1/configuration/](https://docs.influxdata.com/telegraf/v1/configuration/)
---
## Data collecting <-> Agent analogy
1. Agent or "detective" is hired to gather clues (data)
2. Agent travels around to collect meaningful information (input)
3. Agent may handle information (Aggregate/Process) into more meaningful format
4. Agent reports(output) information back to the central location (DB) for further analysis
---
## Telegraf config example
Configuration looks like TOML. It contains agent, input, output, aggregate and processor sections. Some sections are optional.
```conf
[agent]
interval = "10s"
flush_interval = "10s"
[[inputs.cpu]]
percpu = true
totalcpu = true
collect_cpu_time = false
report_active = false
[[inputs.mem]]
[[outputs.influxdb]]
urls = ["http://localhost:8086"] # InfluxDB Instance
database = "telegraf"
bucket = "BUCKET_NAME_HERE"
token = "AUTH_TOKEN_HERE"
```
---
## Agent configuration 1/3
Agent behaviour e.g. time interval
```conf
# https://github.com/influxdata/telegraf/blob/master/docs/CONFIGURATION.md#agent
[agent]
interval = "10s"
flush_interval = "60s"
```
---
## Input plugins 2/3
Inputs are handled with plugins. Each plugin has their own options.
```conf
# https://github.com/influxdata/telegraf/tree/master/plugins/inputs/cpu
[[inputs.cpu]]
percpu = true
totalcpu = true
collect_cpu_time = false
report_active = false
# https://github.com/influxdata/telegraf/blob/master/plugins/inputs/mem
[[inputs.mem]]
```
---
## Output plugins 3/3
Outputs are handled with plugins. Each plugin has their own options.
```conf
# https://github.com/influxdata/telegraf/tree/master/plugins/outputs/influxdb_v2
[[outputs.influxdb]]
urls = ["http://localhost:8086"] # InfluxDB Instance
database = "telegraf"
bucket = "BUCKET_NAME_HERE"
token = "AUTH_TOKEN_HERE"
```
---
### 2.2. Set environment variables
Documentation: [https://docs.influxdata.com/telegraf/v1/get-started/#set-environment-variables]
(https://docs.influxdata.com/telegraf/v1/get-started/#set-environment-variables)
---
### 2.3. Start telegraf
```
# Set config. Consider test.
telegraf --config path/to/telegraf.conf
# Start and check service
sudo systemctl start telegraf.service
sudo systemctl status telegraf.service
# Set service to boot on server restart / failure (if configured)
sudo systemctl enable telegraf.service
```
Documentation: [https://docs.influxdata.com/telegraf/v1/get-started/#start-telegraf](https://docs.influxdata.com/telegraf/v1/get-started/#start-telegraf)
---
## 3. View data in InfluxDB Dashboard
Navigate to the InfluxDB Dashboard
---
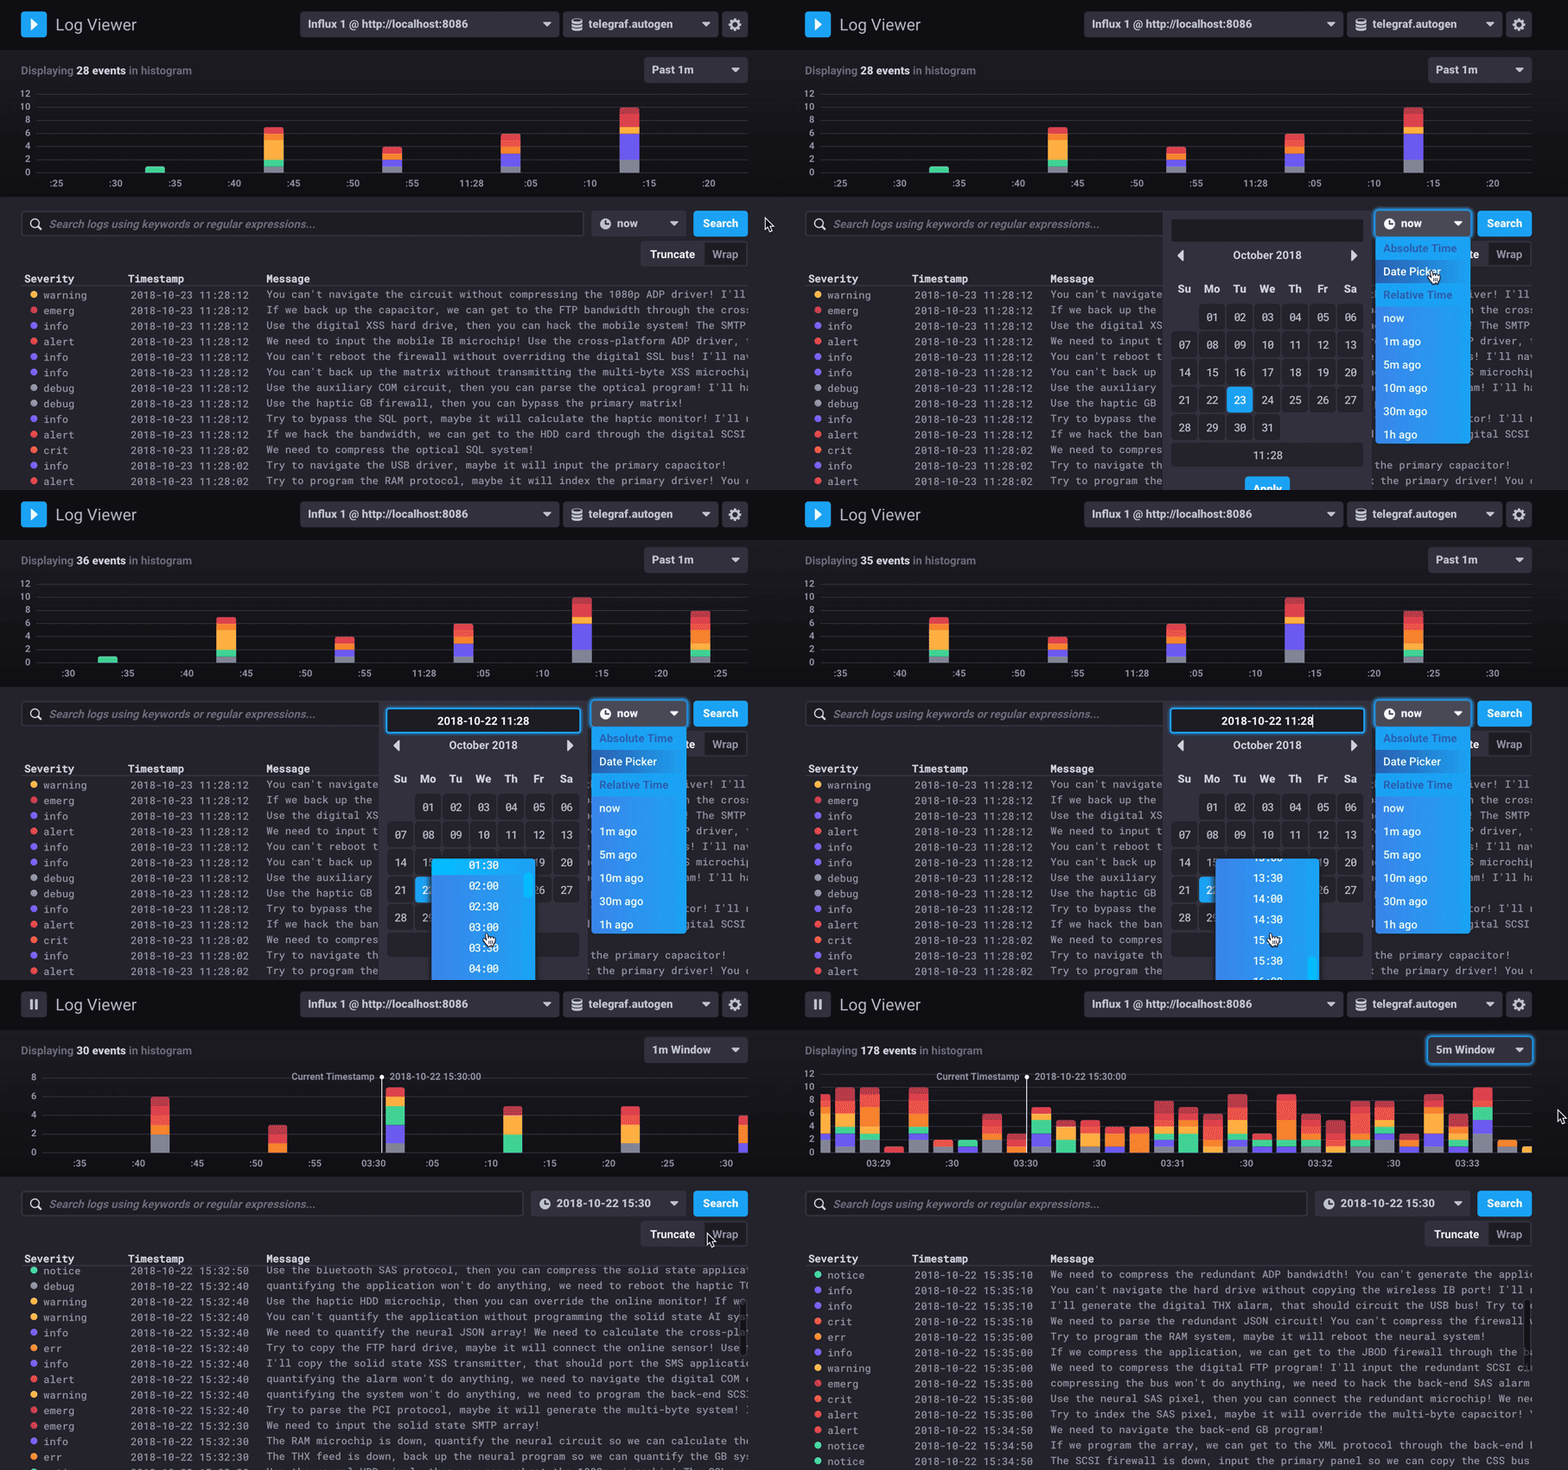
# Extra - Chronograf
Visualize web-server logs in Chronograf.
[https://docs.influxdata.com/chronograf/v1/guides/analyzing-logs/#set-up-logging](https://docs.influxdata.com/chronograf/v1/guides/analyzing-logs/#set-up-logging)
---
## Extra diff 1/2 - CLI
CLI Based solution is straight forward for web-server log observing
```bash
# Nginx access logs - CTRL + C to exit
tail -f /var/log/nginx/access.log
# Nginx error logs - CTRL + C to exit
tail -f /var/log/nginx/error.log
```
Shows latest logs in Nginx web server.
---
## Extra diff 1/2 - GUI

Log visualising in Chronograf (image from [influxdata.com](https://docs.influxdata.com/img/chronograf/1-7-log-viewer-specific-time.gif))
---
{"description":"Automate dataflow to analytic services.","title":"DIOTP - C7","contributors":"[{\"id\":\"fbb84115-3bd5-44ec-9f36-beb474a8f5e3\",\"add\":6626,\"del\":1018}]","slideOptions":"{\"theme\":\"white\",\"transition\":\"fade\",\"slideOptions\":{\"spotlight\":{\"enabled\":true}}}"}