# DIOTP - C8
## Dashboard
---
# Motivation
Visualize collected data.
---
# Topics to cover
1. Visualising in Influx Dashboards
2. More data sources (event based)
3. Installing Chronograf & Kapacitor
---
# Cloud services

---
# Steps to visualize

---
# OEE Example
OEE = Overal Equipment Efficiency

---
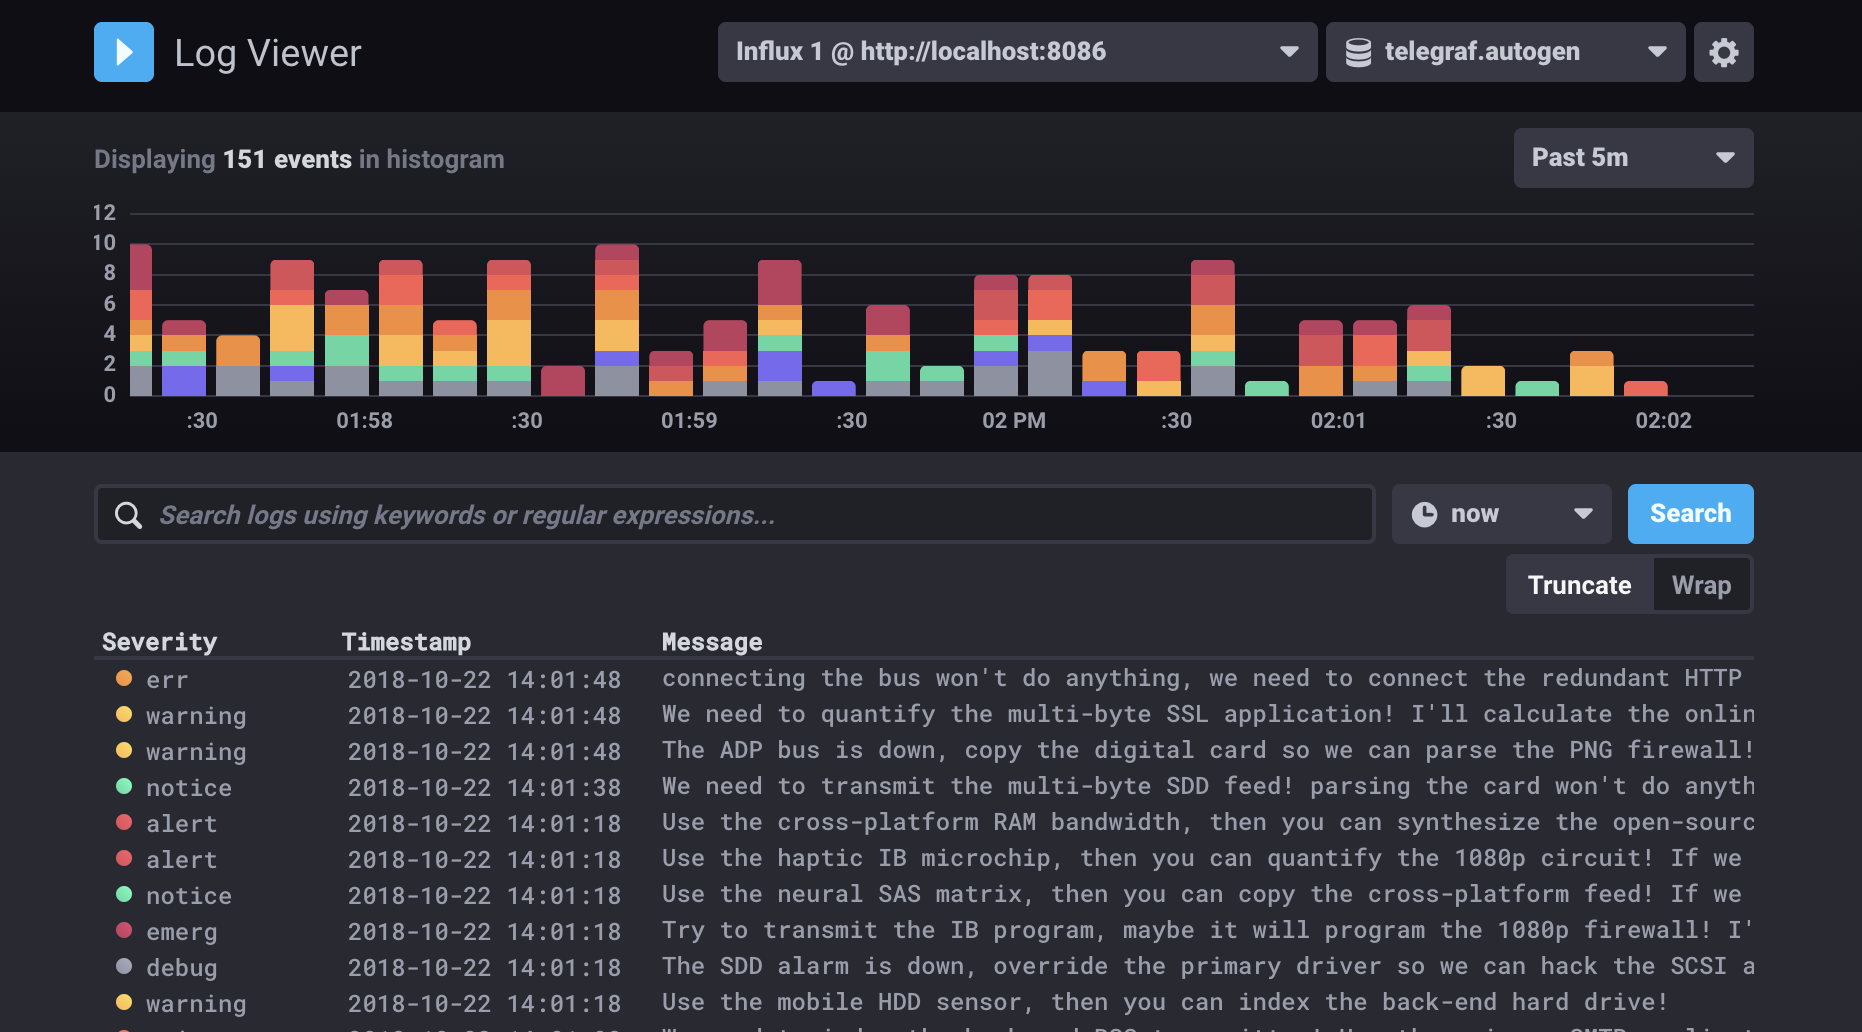
# Nginx Logs
[Analyse logs in chronograf](https://docs.influxdata.com/chronograf/v1/guides/analyzing-logs/)
---
# Connect server
```bash=
# Look for SSH-TUNNEL
cat ~/.ssh/config
# Connect to the tunnel
ssh tunnel_name_here
```
---
# Login to the InfluxDB
Navigate to the InfluxDB URL: http://localhost:8086
Login with username and password
---
# Tail log
[Set up logging with tail](https://github.com/influxdata/telegraf/tree/master/plugins/inputs/tail/README.md)
---
## Define telegraf to collect input
```bash
# Create telegraf config to collect Nginx Logs
sudo nano /etc/telegraf/telegraf.d/nginx_logs.conf
```
---
## Nginx input config
```toml
[agent]
# interval = "10s"
flush_interval = "60s"
[[inputs.tail]]
files = ["/var/log/nginx/access.log","/var/log/nginx/error.log"]
watch_method = "inotify"
character_encoding = "utf-8"
from_beginning = false
# What exactly does this do? Parses the log file
data_format = "grok"
grok_patterns = ["%{COMBINED_LOG_FORMAT}"]
grok_custom_patterns = '''
COMBINED_LOG_FORMAT %{IPORHOST:client_ip} %{USER:ident} %{USER:auth} \[%{HTTPDATE:timestamp}\] "(?:%{WORD:method} %{NOTSPACE:request}(?: HTTP/%{NUMBER:http_version})?|%{DATA})" %{NUMBER:status} (?:%{NUMBER:bytes}|-) %{QS:referrer} %{QS:agent}
'''
[[outputs.influxdb_v2]]
urls = ["http://localhost:8086"]
bucket = "BUCKET_NAME_HERE"
organization = "LAB"
token = "TOKEN_HERE"
```
---
### Grok input data format
https://docs.influxdata.com/telegraf/v1/data_formats/input/grok/
Custom pattern for Nginx logs:
```
%{IPORHOST:client_ip} # 1. Collects IP or HOSTNAME
%{USER:ident} # 2. User identifier, default '-'
%{USER:auth} # 3. Auth header, default '-'
[%{HTTPDATE:timestamp}\] # 4. Timestamp e.g.[29/Oct/2024:11:26:40 +0000]
"(?:%{WORD:method} # 5.1 HTTP Method
%{NOTSPACE:request} # 5.2 ?
(?: HTTP/%{NUMBER:http_version})?|%{DATA}) # 5.3 HTTP version (1.0, 2.0, 3.0)
%{NUMBER:status} # 6. Response status code
(?:%{NUMBER:bytes}|-) # 7. Amount of bytes (response?)
%{QS:referrer} # 8. ?
%{QS:agent} # 9. Browser identifier
```
---
---
# Chronograf
Visualizes data
- Documentation: [https://docs.influxdata.com/chronograf/v1/](https://docs.influxdata.com/chronograf/v1/)
---
## Add telegraf config
Create config for telegraf to collect Nginx logs:
```
# mod main telegraf config
sudo nano /etc/telegraf/telegraf.conf
# or add new config
sudo nano /etc/telegraf/conf.d/nginx_events.conf
```
---
## Define telegraf config
```toml
[agent]
# interval = "10s" # Use for polling if other inputs exists.
flush_interval = "60s"
[[inputs.tail]]
files = ["/var/log/nginx/access.log","/var/log/nginx/error.log"]
watch_method = "inotify" # Enables real-time file monitoring
character_encoding = "utf-8"
from_beginning = false
# What exactly does this do? Parses the log file
data_format = "grok"
grok_patterns = ["%{COMBINED_LOG_FORMAT}"]
grok_custom_patterns = '''
COMBINED_LOG_FORMAT %{IPORHOST:client_ip} %{USER:ident} %{USER:auth} \[%{HTTPDATE:timestamp}\] "(?:%{WORD:method} %{NOTSPACE:request}(?: HTTP/%{NUMBER:http_version})?|%{DATA})" %{NUMBER:status} (?:%{NUMBER:bytes}|-) %{QS:referrer} %{QS:agent}
'''
[[outputs.influxdb_v2]]
urls = ["http://localhost:8086"]
bucket = "system_events"
organization = "LAB"
token = "TOKEN_HERE"
```
---
{"title":"DIOTP - C8","description":"… hext here","slideOptions":"{\"theme\":\"white\",\"transition\":\"fade\",\"slideOptions\":{\"spotlight\":{\"enabled\":true}}}","contributors":"[{\"id\":\"fbb84115-3bd5-44ec-9f36-beb474a8f5e3\",\"add\":6229,\"del\":2121}]"}