# 2023-01-14 Python筆記
###### tags: `python` `notes`
# Python 基礎
### 基礎變數類型
1. `int` (整數)
2. `float` (小數/浮點數)
3. `String` (字串)
4. `boolean` (True / False)
```python
# 宣傳變數,不用加int float在前面
var1 = 123
var2 = 123.0
var3 = "Alfred Leong"
var4 = True
```
```python
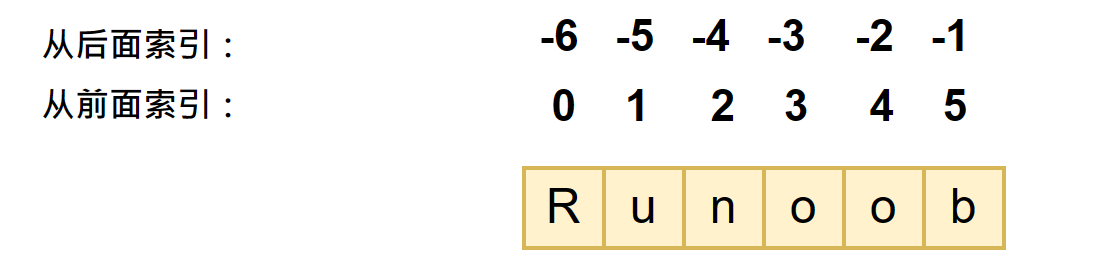
# 訪問字串,用 [] 表示
# 向前數 : 索引由 0 開始
# 由後向前數:索引由 1開始
var5 = "Runoob"
print(var[0]) #R
print(var[-1]) #b
```
---
### 數組
#### `list`
```python
# 空數組
list_a = []
# 數組中可以包含任意類型的 data
list_b = [1,2,3,4,6]
list_c = ["Hello", "World", 1,3,5,7]
# 訪問數組,用 [] 表示
# 向前數 : 索引由 0 開始
# 由後向前數:索引由 1開始
print(list_c[0]) # Hello
print(list_c[-1]) # 7
```

#### `dict`
字典 `{}` 是另一種可變容器模型,且可存儲任意類型對像。
一個 `key` => `value`
```python
dict_a = {
'name': 'LiLi',
'sex': "boy",
'birYear' : 1996,
'work': 'IT'
}
# 輸出dict用 key
print(dict_a['sex']) # boy
print(dict_a['birYear']) # 1996
```
# matplotlib
畫圖用,其中每一個import plt 為一張空白的圖,可於plt中設置各種元素
`import套件`
```python
import matplotlib.pyplot as plt
```
### matplotlib 圖表類型
> https://steam.oxxostudio.tw/category/python/example/matplotlib-index.html
折線圖 `plot`
https://steam.oxxostudio.tw/category/python/example/matplotlib-line-plot.html
散點圖 `Scatter`
https://steam.oxxostudio.tw/category/python/example/matplotlib-scatter-plot.html
長條圖 `Bar`
https://steam.oxxostudio.tw/category/python/example/matplotlib-bar.html
圓餅圖 `Pie`
https://steam.oxxostudio.tw/category/python/example/matplotlib-pie.html
---
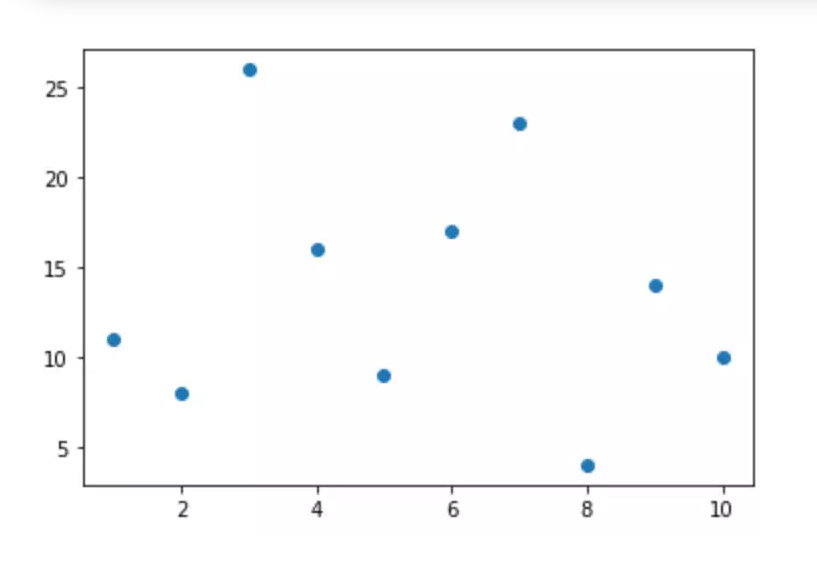
以散布圖 `Scatter`為例
```python
import matplotlib.pyplot as plt
x = [1,2,3,4,5,6,7,8,9,10]
y = [11,8,26,16,9,17,23,4,14,10]
# 當只想畫一種圖時,直接使用 plt.圖名稱
plt.scatter(x,y,color='blue')
plt.show()
```
---
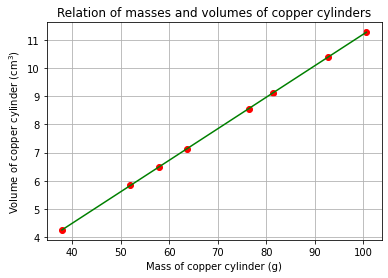
### 如要在 1 個 plt 中畫 2 個圖
```python
# import 套件
import matplotlib.pyplot as plt
# X, Y 資料
mass = [37.91, 52, 57.98, 63.69, 76.36, 81.35, 92.77, 100.62]
volume = [4.25, 5.83, 6.5, 7.14, 8.56, 9.12, 10.4, 11.28]
# 必須打這句,令 plt 可以畫 2 個圖,後續使用 ax 做不同的設定
fig, ax = plt.subplots()
ax.scatter(mass, volume, color='red') # ax.scatter 散點圖
ax.plot(mass, volume, color='green') # ax.plot 折線圖
# 格線,不知為何要設定在 plt 但不用管,反正放在 plt
plt.grid()
# 設置 X Y 軸標籤
ax.set_xlabel('Mass of copper cylinder (g)')
ax.set_ylabel('Volume of copper cylinder (cm)')
ax.set_title('Relation of masses and volumes of copper cylinders')
plt.show()
```
---
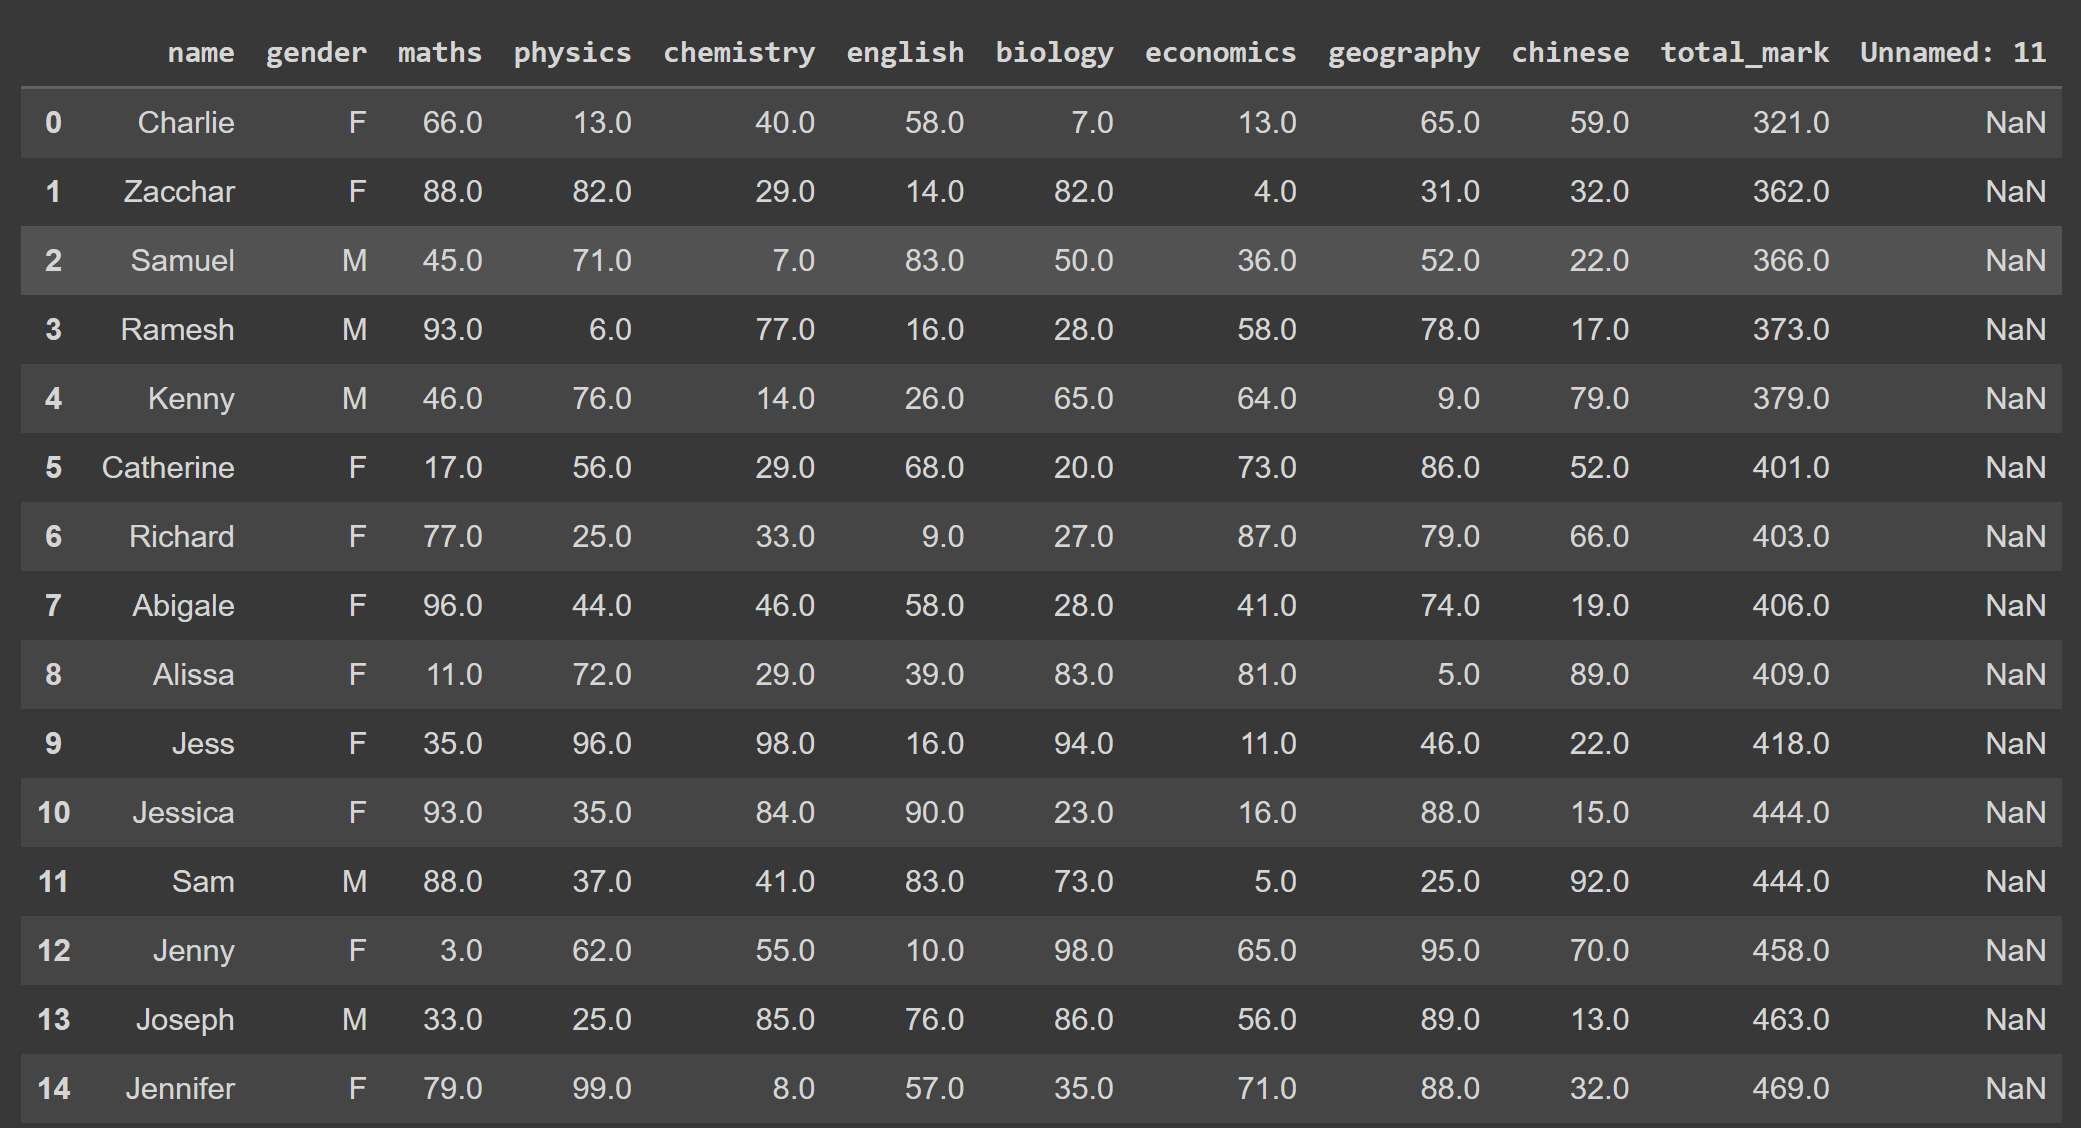
# Pandas - 數據處理的套件
### import 套件
```python
import pandas as pd
```
### 讀入資料
以這種方式導入的資料會以`DataFrame`的格式儲存,習慣用`df`作為變數名
```python
# 讀入Excel
df = pd.read_excel("a.xlsx")
# 讀入.csv
df2 = pd.read_csv("a.csv")
```
---
### 去除無效值
使用 `dropna` 方法
```python
# axis = 1 打直刪
df.dropna(how='all',axis=1, inplace=True)
# axis = 0 打橫刪
df.dropna(how='all',axis=0, inplace=True)
```
---
### 快速計算各項數據
使用 `describle` 方法
```python
df.describe(include='all')
```
---
### 快速對 DataFrame 做篩選
#### 選擇直行(Colmumn)的數據
`df.該行的名稱` 例:
```python
df.maths
df.total_mark
```
#### 選擇橫行(Row)的數據
使用`.loc[]`函數,注意,橫行中需要有名字,如橫行沒有名字,則用0,1,2,3,4...
```python
df.loc['Sam'] # 注意此處僅作例子,原數據中名字也是Col的一行,不能用作.loc
df.loc['0','1','2']
```
---
#### Ex 1 選出 `total_mark` 中的最大值和最小值
```python
total_max = df.total_mark.max()
total_min = df.total_mark.min()
```
#### Ex 2 選擇 English 分數小於50分的人
```python
df_Q2 = df.loc[df.english < 50]
print(df_Q2.name)
```
#### Ex 3 選擇 English 分數小於50分及中文小於50分的人
```python
df_Q3 = df.loc[(df.english < 50) and (df.chinese < 50)]
print(df_Q3.name)
```
 Sign in with Wallet
Connect another wallet
Sign in with Wallet
Connect another wallet