---
tags: meeting notes
---
# MDF MEETING NOTES 20211105
completely in-person! (and next week will be virtual)
## AGENDA
1. Updates
2. Show and Tell
- Zane
## UPDATES
### introductions
- Christine
- Christine loves film/tv/podcasts/novels/pop culture of all kinds. Send her recommendations!
- She's also workin on finishing a PhD herself, so you can also bring her academic questions.
- Ignacio
- "the future of . . . " events
- the classroom
- translation
- two more in the spring
- from these we will take out clips of the best conversations
- Zane
- Organic and Evolutionary Biology, G6
- web dev and datavis
- Xiaomeng
- Neuroscience, G5
- electromicroscopy
- graphical abstrat
## SHOW + TELL
### Zane

Zane started getting into web development last spring along with Lauren and Phil.
#### Seamonsters website
Seamonsters throughout the Ages is a class taught by Prof Pete Girguis at Harvard Extension School
It starts with students drawing their own terrifying sea monsters, and she made a gallery website that displays student monsters and blurbs about them, as well as a image memory game and an about the course and about Pete section.
#### Ocean Affinity Group website
Zane is also working on a website for the Ocean Affinity Group that will have info about people who are working on Ocean related projects at Harvard. Airtable is the backend of this! There are tables for Programs, Graduate students, People, Opportunities, Locations that will power a website with the goal of connecting folks doing similar work at Harvard and students looking for grants and other opportunities.
#### SEAS data visualization
Zane is working on some data visualizations for SEAS that visualize the departments, faculty members, and related research interests. It's in progress now and her current idea is to make a concentric donut visualization.
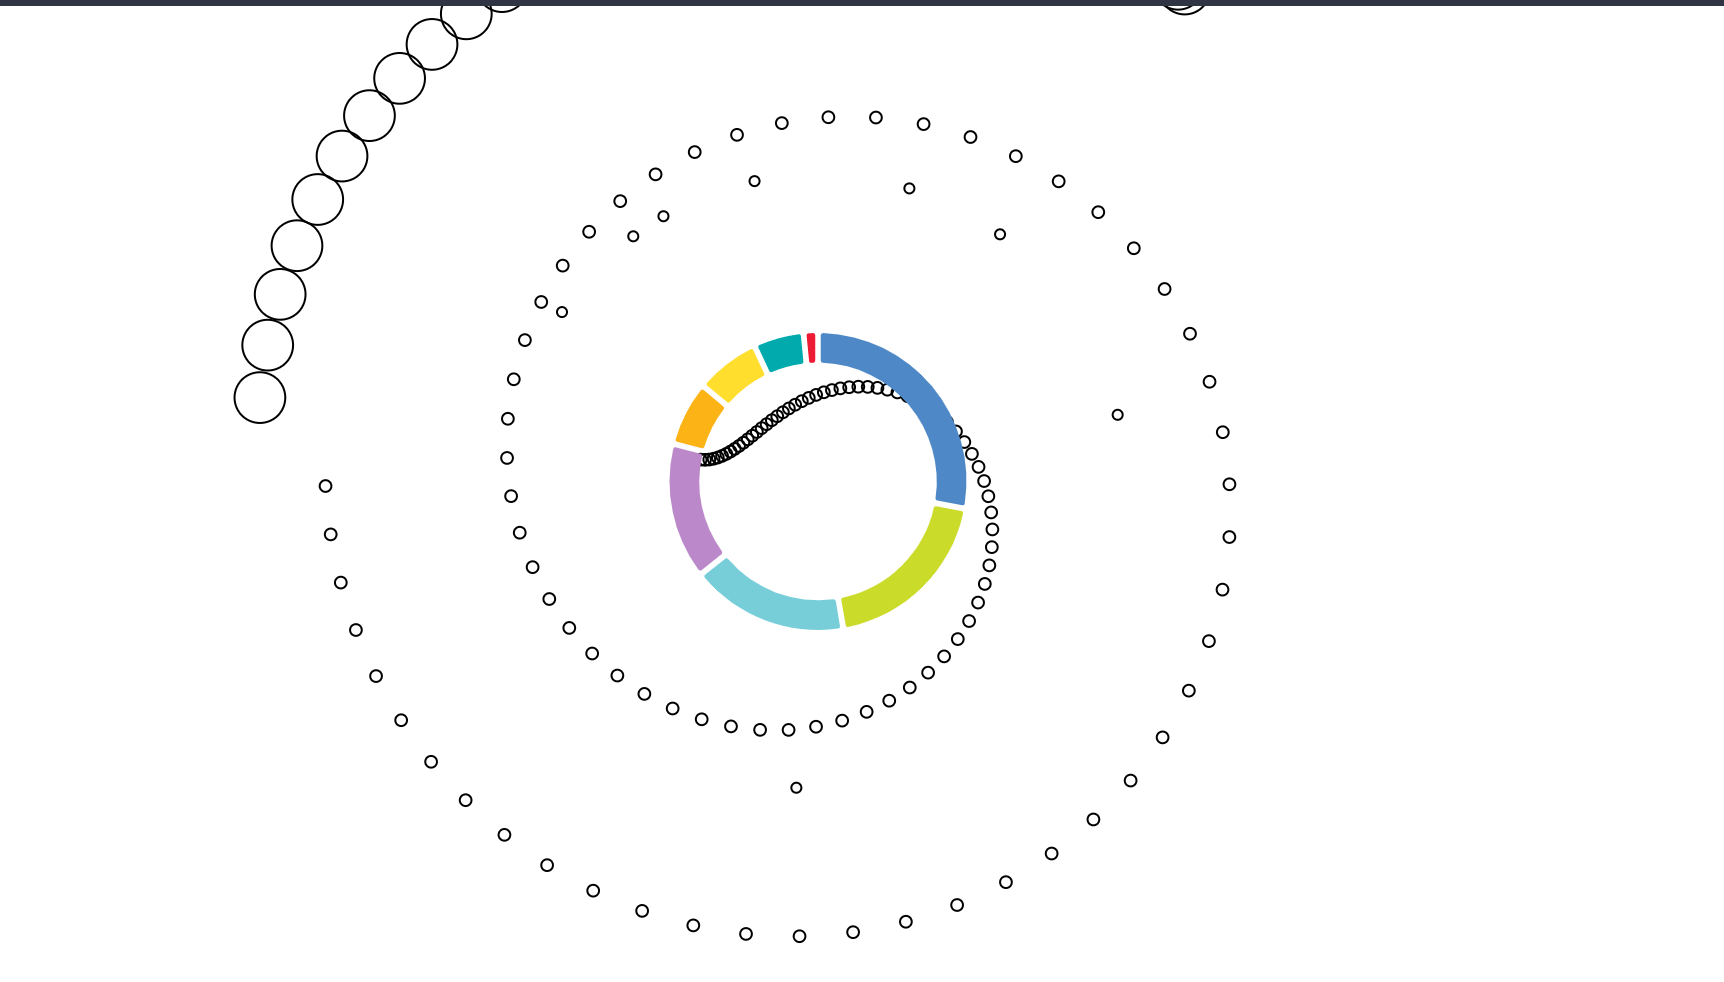
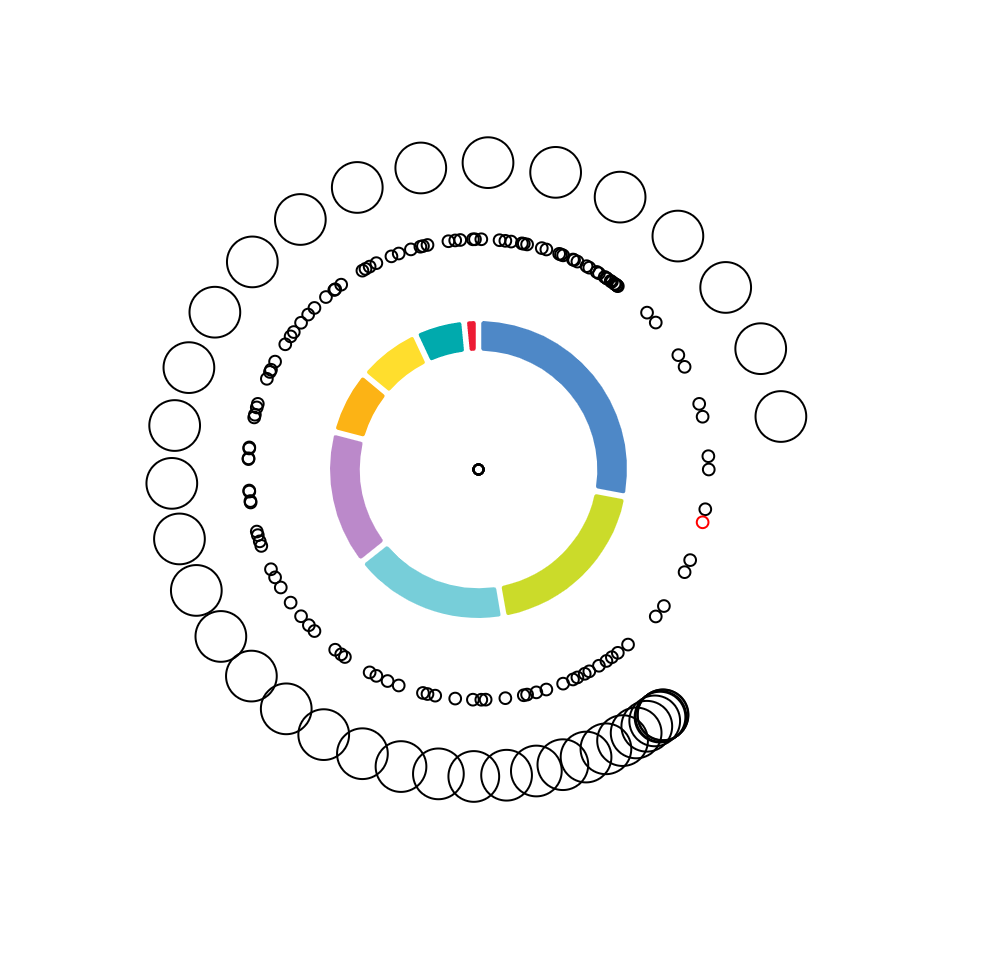
#### Zane's datavis activity:
Zane led us through an exercise that had us think about maps as a form of personal storytelling. Using the LL's drawing materials, we created narratives about ourselves, rendering on our maps: the places we've traveled, what we've done while traveling (e.g., recreational activities), where we're from, have lived and/or have loved ones, where we'd like to visit, and what nation's cultural works we've read and watched. Once we finished drawing our personal maps, we exchanged them with a partner and unpacked each other's stories by analyzing the map and its key. This helped us come to a better understanding of how an audience perceives visual information and how data can be conveyed in creative and unexpected ways to tell a story. We also found that this activity would work well as an icebreaker activity in the first week of a course. Students could create maps about their interests and experiences that they would share and interpret with their classmates.


> This activity was borrowed from Valentina D'Efilippo's datavis workshop, and all these images are hers.
An example:

#### Our maps:
 Sign in with Wallet
Connect another wallet
Sign in with Wallet
Connect another wallet