---
tags: orientation
---
# lookbook
## 3D object Tori & Alexia
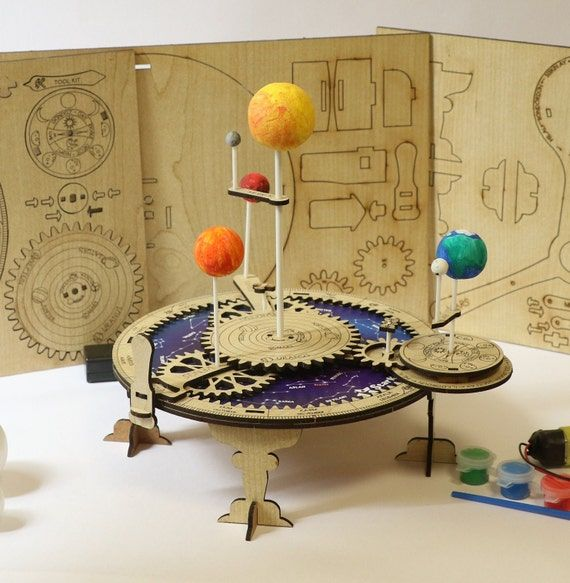
Things useful to learn with 3D:
- Dimensionnal/Scale Learning
- Submerssive: Learning from playing with model with the movement and mechanisnm
- Texture context: compositionnal awareness
- Accessible to persons/audience with disabilities
Activity ideas:
- collecting images (ie planets/celestial bodies for a solar system project or iconography/motif for AH project)
- data info to keep in mind: scale, color, compositional/materiality, dates, location and positional relationships, measuring units (size), narrative (story of work)
- choose one data topic to focus on in their final presentation alongside the final object image they create (ie: physics between planet and moon/features, chemistry of the planet, geological comp of core, history of space exploration and its relation to the object. IE iconographic/myth story, historical context, material and form, relation with environment)
- activity: select an object (comet, astroids, planet, moon. AH: painting, sculpture, architecture) tell the story of the object.
- making of 3D: computer 3d (digitial imaging - nonstatic 3D) vs 3d printings which requries a fixed final idea image.
- Final: give mini presentation or post to explain what makes it unique. its relationships to other objects and how it is different or what it is similar to. present along side 3d model that they made.
## Alexa and Arianna and Bes
Explainer video
<iframe src="https://player.vimeo.com/video/84585526?h=41197e4e47" width="640" height="360" frameborder="0" allow="autoplay; fullscreen; picture-in-picture" allowfullscreen></iframe>
<p><a href="https://vimeo.com/84585526">CreatureCast- Glaucus</a> from <a href="https://vimeo.com/user1747626">Casey Dunn</a> on <a href="https://vimeo.com">Vimeo</a>.</p>
Visual representation of things that require alot of jargon or specialized knowledge to explain in words
- Can show processes, sequential steps and consequences
- Visually attractive and captures your attention
- Alot of information in a short amount of time
- Accuracy of representation (e.g. of organisms, morphology)
- Can cater to multiple audiences (auditory and visual), accessibilty
- Objectivity
- Emphasize certain traits/characteristics
- Representation of things/processess that are "unseeable"
Moves / skills / exercises
- Picking a topic/identifying appropriate level and scope of focus (not too broad, not too complicated)
- distilling information
- video editing
- graphical design / animation
- visual analogies and metaphors for complicated concepts
- simplifying a process
Scaffolding ideas
- Show multiple examples and identify what is common/different between them
- Identifying the scope
- Is this about one process/one animal/one theme
- Including "bad examples" (too braod, too complex)
- Can they succinctly explain what the video they just watched was about
- Read a paragraph, and retell it in two sentences (or less)
- Retell your summary for: a group of 5 year olds, 12 year olds, general adult population, your peers in your field
- For each sentence in your summary
- pick sentences out of a hat and sketch one image per sentence to represent the general idea/info in the sentence
- order these in a story board
- Do this activity individually/in small groups and then come back all together to guess which of each others images go with what sentences to see how well your visual intrepration matches others.
- Transition between different "views"
- Identifying the steps between frames (etc. zooming in from organism to cell level)
## Graham and Laura
## Maps
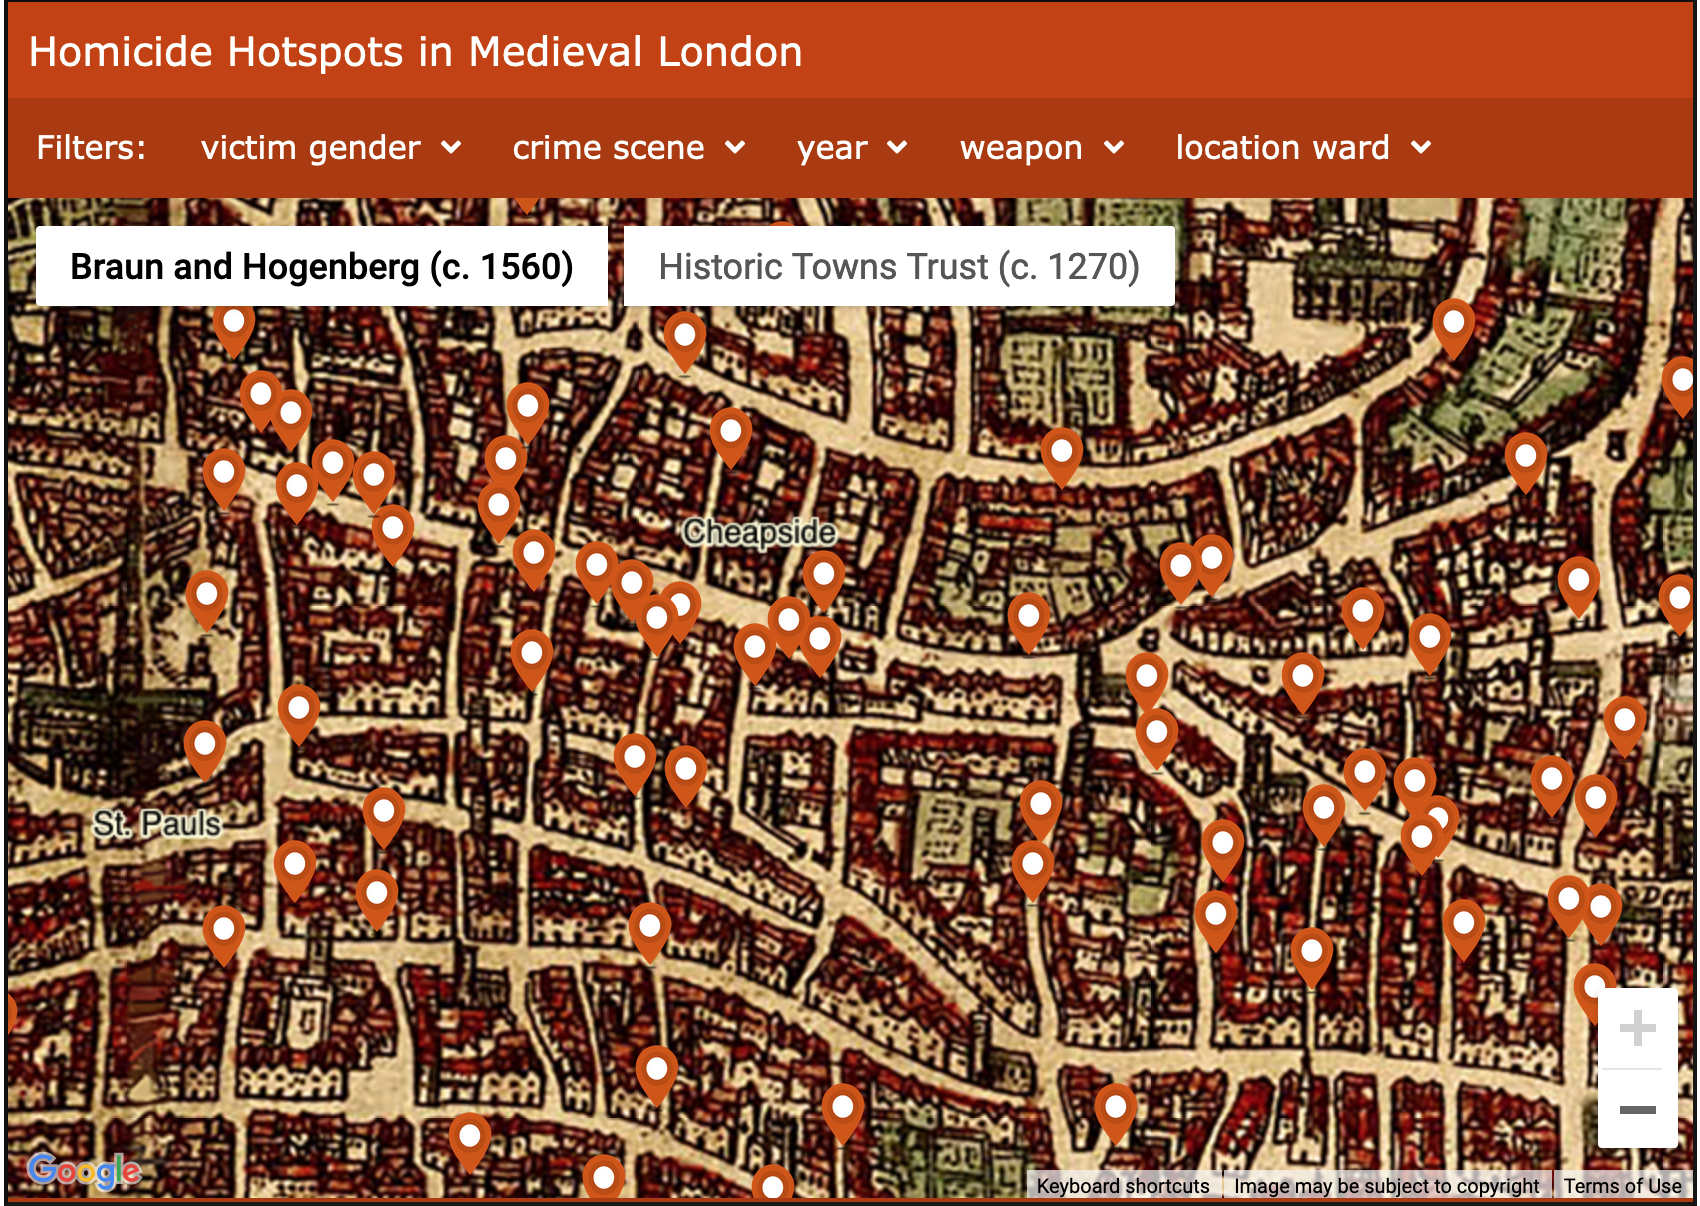
https://www.vrc.crim.cam.ac.uk/vrcresearch/london-medieval-murder-map
Things we like about this Historical GIS project
- Then/Now of the Street Map
- Like the street maps of Harvard Square on the first floor
- makes the map accessible in a visitable physical space
- Data filtering by a variety of data points
- Then/Now of the data itself
- Seeing it in three different time periods
- 1270
- 1560
- Today (cross reference with a modern dataset (i.e. how many people were killed by gun in Cheapside today vs. Knife in the 16th century))
Another example of Historical GIS:
- https://rcahmw.maps.arcgis.com/apps/webappviewer/index.html?id=c6a414a5042848e291bf2a3d0d626424
### What are some examples of scaffolding ideas?
**Draw a map of your route from home to work**
- add art, doodles, give directions
- Are there places on the map that hold meaning?
- what are they?
- restaurant where you met a friend
- your favorite coffee shop
- the corner where someone posted an add for a play that you're interested in going to
- Are there places nearby that hold meaning?
- Fill out the map two or three streets (or some other measurable unit)
- are there places in that space that hold meaning?
- monuments
- street names for notable persons
- local hangouts
- Ask yourself: what is meaning?
- Add story to two or three places.
- What was the reason for choosing these locations?
- Are there any other points in your experience there which are worth noting?
- These could be:
- landmarks
- places you are prompted to stop (or not)
- "Look Both Ways"
- Bus/transit stops (and routes)
- Places you're prompted to go around
- Fenway
- Harvard Yard
- Crossings
- Crosswalks
- Bike paths
- Rivers/Lakes/Swamps, e.g. The Charles
- Terrain/topography (how difficult is the path)
- do you change your route to avoid a hill?
- What are the patterns you see in your map?
- Identify repetitive stops or engagement
- common themes
- How can you turn that into data?
- What are the types of data being used in a GIS/Map form?
- Coordinates
- landmarks
- street names
- Let's digest all of this information
- What are the different layers you can make from what you've done?
- Points (the individual places that are meaningful to you)
- Your route
- Adjacent places of meaning
- Street names
- Landmarks
- Public Transit routes
- Landscape names
- Topography
- Now draw each of those as layers on transparent sheets
- As we layer them on top of one another, what do you see? How does the map change as you add or remove information?
- Transferring the exercise into a digital format
- picking an appropriate mode
- ArcGIS/ESRI
- QGIS
- Google Maps
- Leaflet
- StoryMaps (program through ArcGIS)
##
## xtine's example: the movie poster
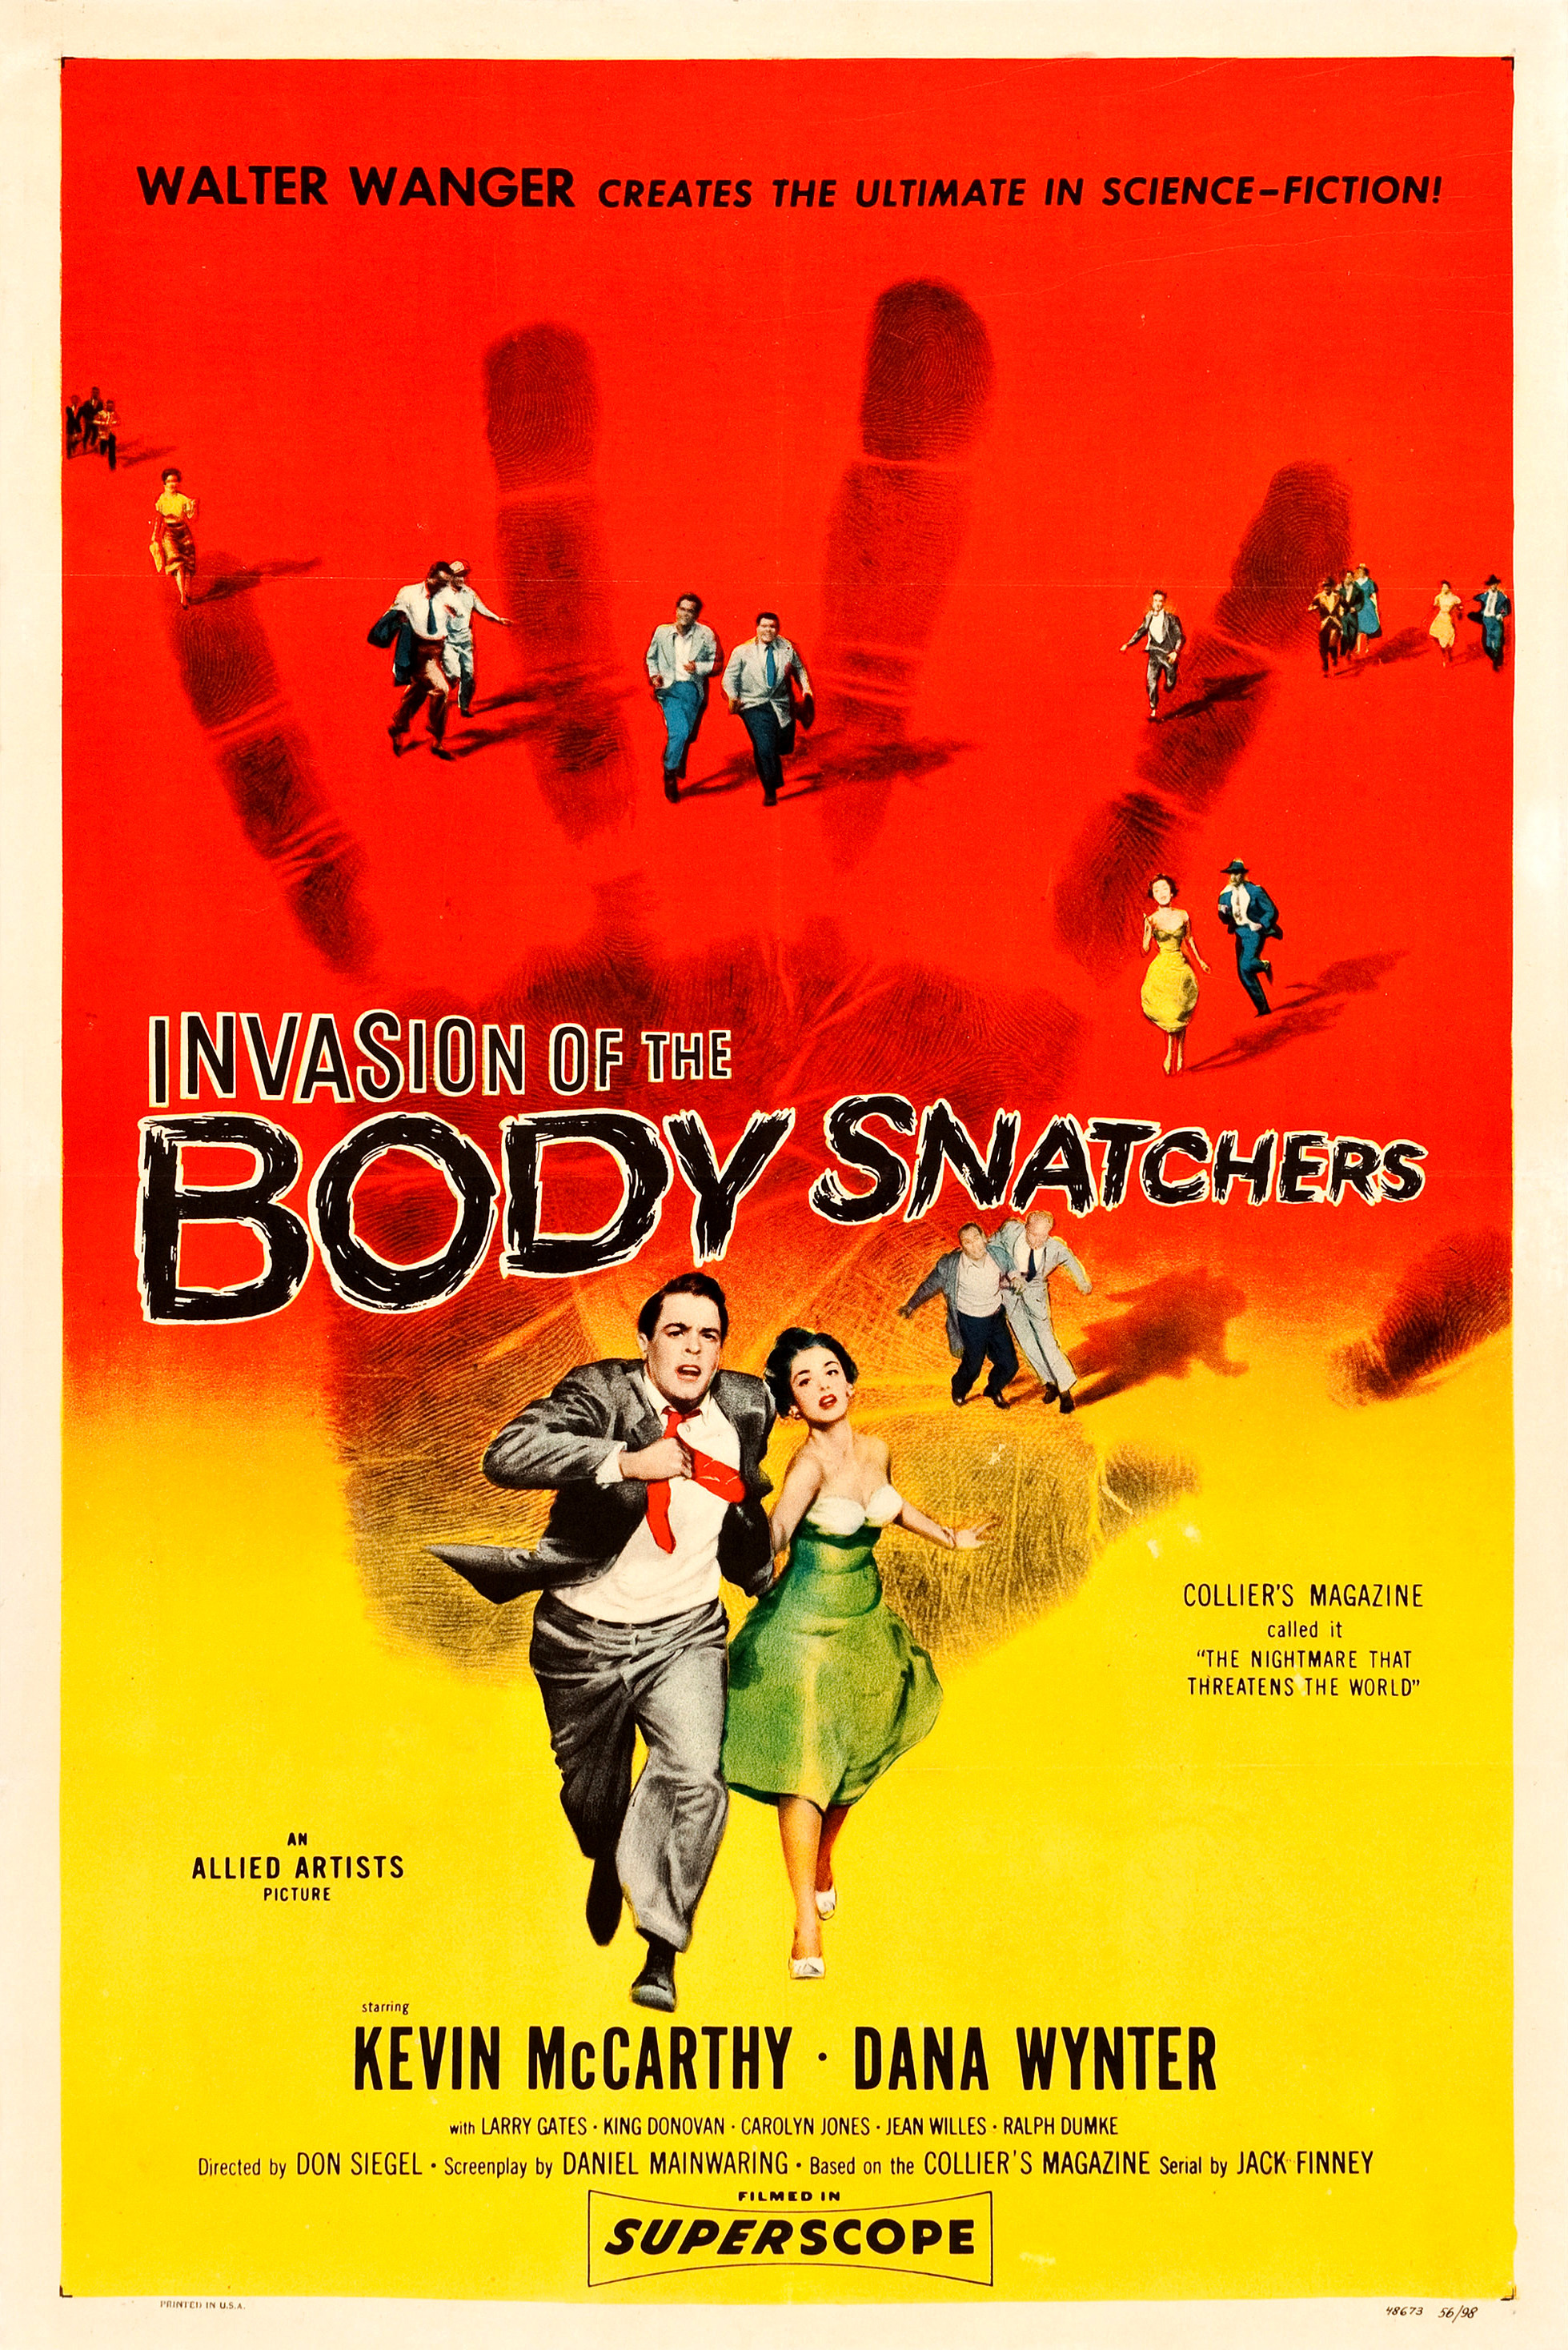
* single image from the film
* encourages close-looking
* requires deep knowledge about plot and character
* use of color and layout
* invokes tone of the film
* structures expectations re: genre
* key details of collective production
 Sign in with Wallet
Connect another wallet
Sign in with Wallet
Connect another wallet