# FRSEMR51R Scientific Presentation Workshop
###### tags: `emily`
## Course
FRSEMR51R Generating Biodiversity: Hands-On Research Experience in Speciation Biology
Instructor: Robin Hopkins
[Project Folder](https://drive.google.com/drive/folders/1RXB86kdhsCdwztynt-dH79RmXprksEdm)
## Event
Location: Learning Lab Main Studio
Time: Wednesday, March 8, 3:00-6:00 PM
Number of students: 9
## Purpose
Teach students how to...
* Simplify specialized, complicated ideas for a general/education audience
* Portray complex results visually
* Build a clear, engaging scientific story
* Share science orally with collegagues
## Outline of Workshop
**Part I: Get to know each other and the learning lab** (20 min)
* icebreaker with overhead and gets them working in groups: XY graph with binary oppositions and partners plot themselves on that graph
* think during this about viscomm and how these plots are thing and why they're used
* starbucks/DD, morning person/night person, sweet/savory, summer/winter, urban/rural, coffee/tea, chocolate/vanilla, cat/dog, bagel/donut (choose a card and put them on the axes)
* hop up on stage and they'll explain
**Part II: Viscomm in the sciences and visual storytelling** (30 mins)
* Unpack 3 skills to work on to create successful presentations
* **1. How to find the big ideas in complex scientific figures/writing**
* this is a critical reading/thinking challenge
* requires understanding a topic well enough to be able to distill it down to what is really important
* *how to help students understand:*
* the importance of distilling complex information (an act that itself displays a significant amount of proficiency in a subject)
* how creating visuals with intention can actually help you make new discoveries about the material/understand it in a way you might not otherwise
* learn through teaching others!
* introduce the paper
* thinking about the power of the grid
* critical reading strategies for scientific papers
* turn it over to Robin
* **2. How to portray visually complex results in a way people can understand**
* this is a graphics challenge
* requires an ability to understand principles like color contrast, signal to noise ratio, line, layout work
* *how to help students understand:*
* critique a figure live and show alternative figures
* Seven series of samples that are equally important, and we would like to show them all in order to visually compare them
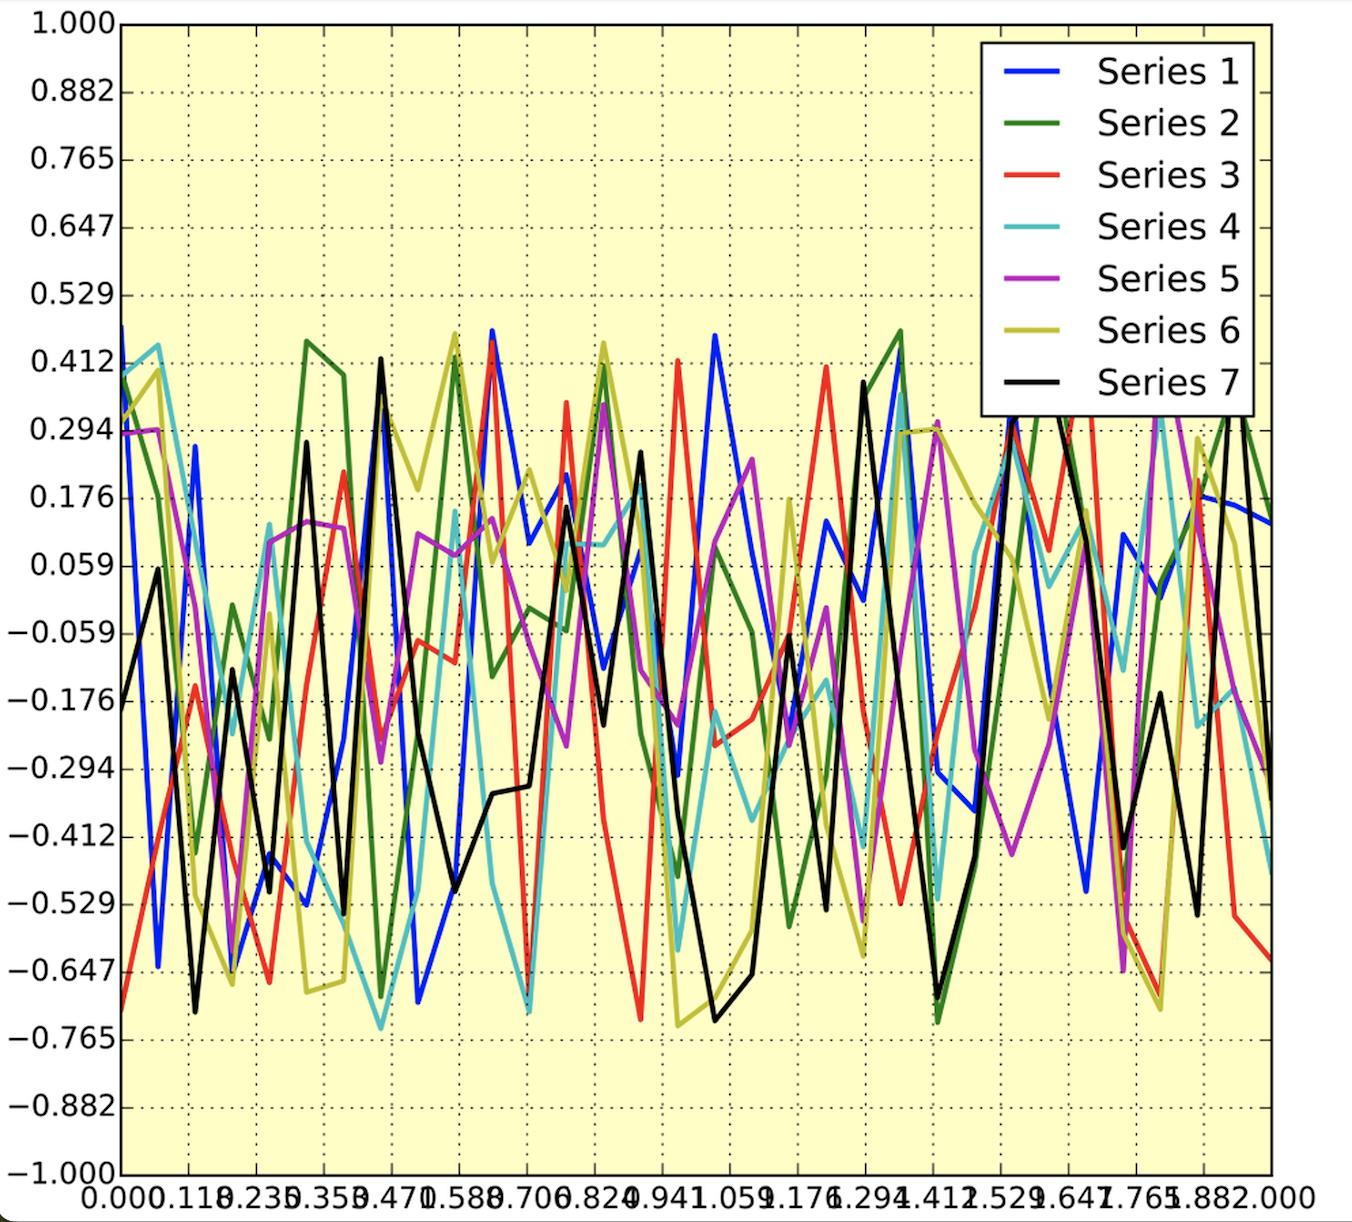
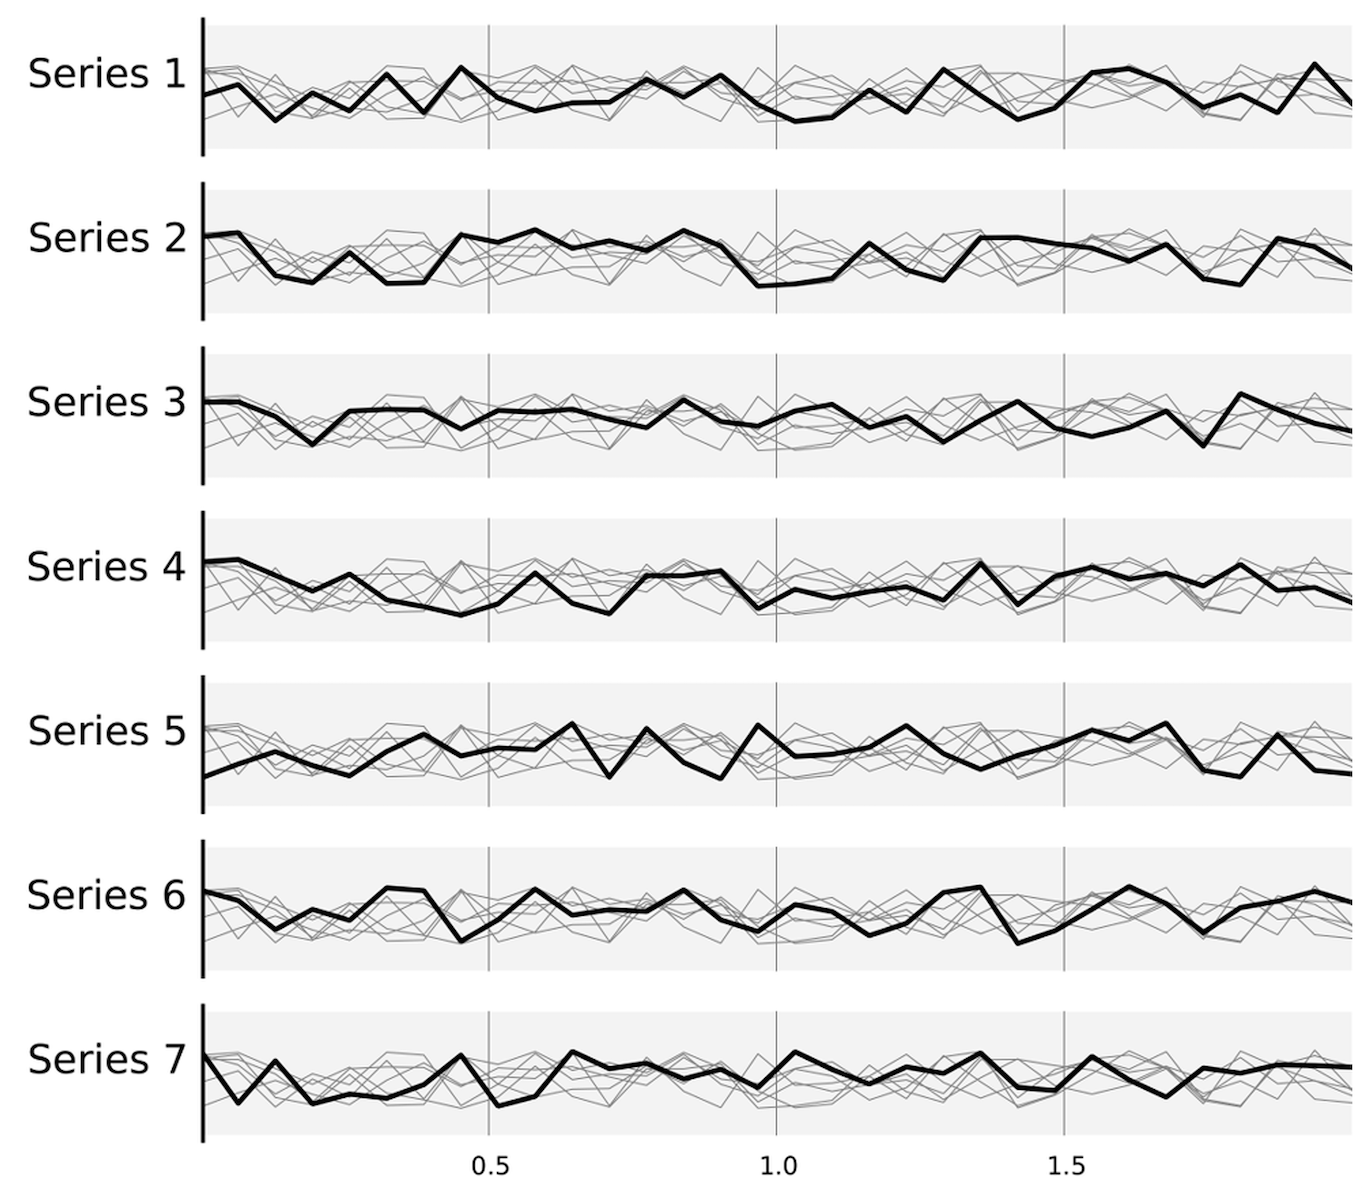
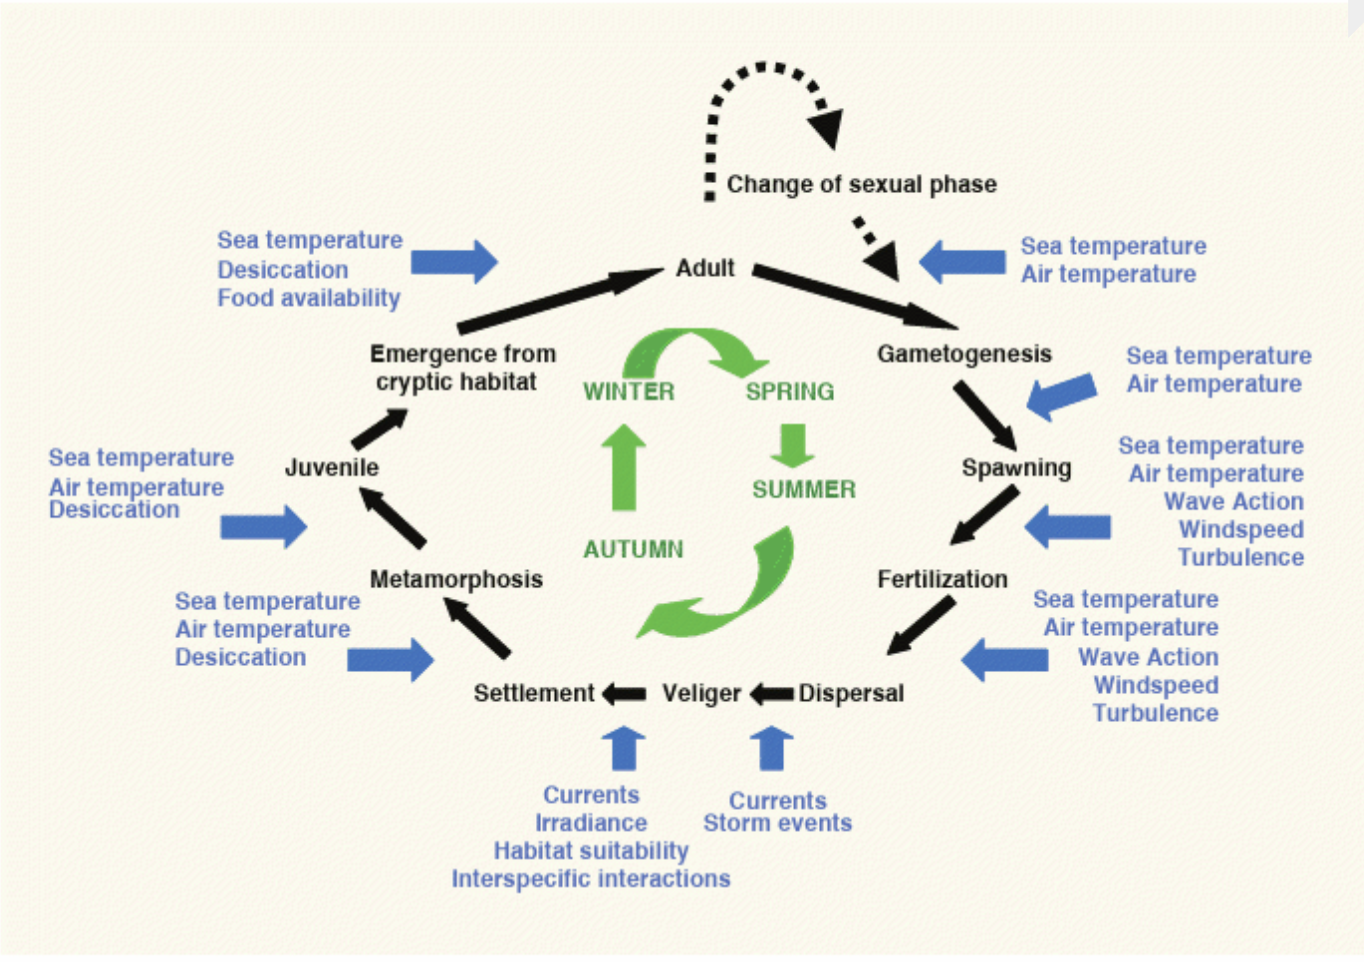
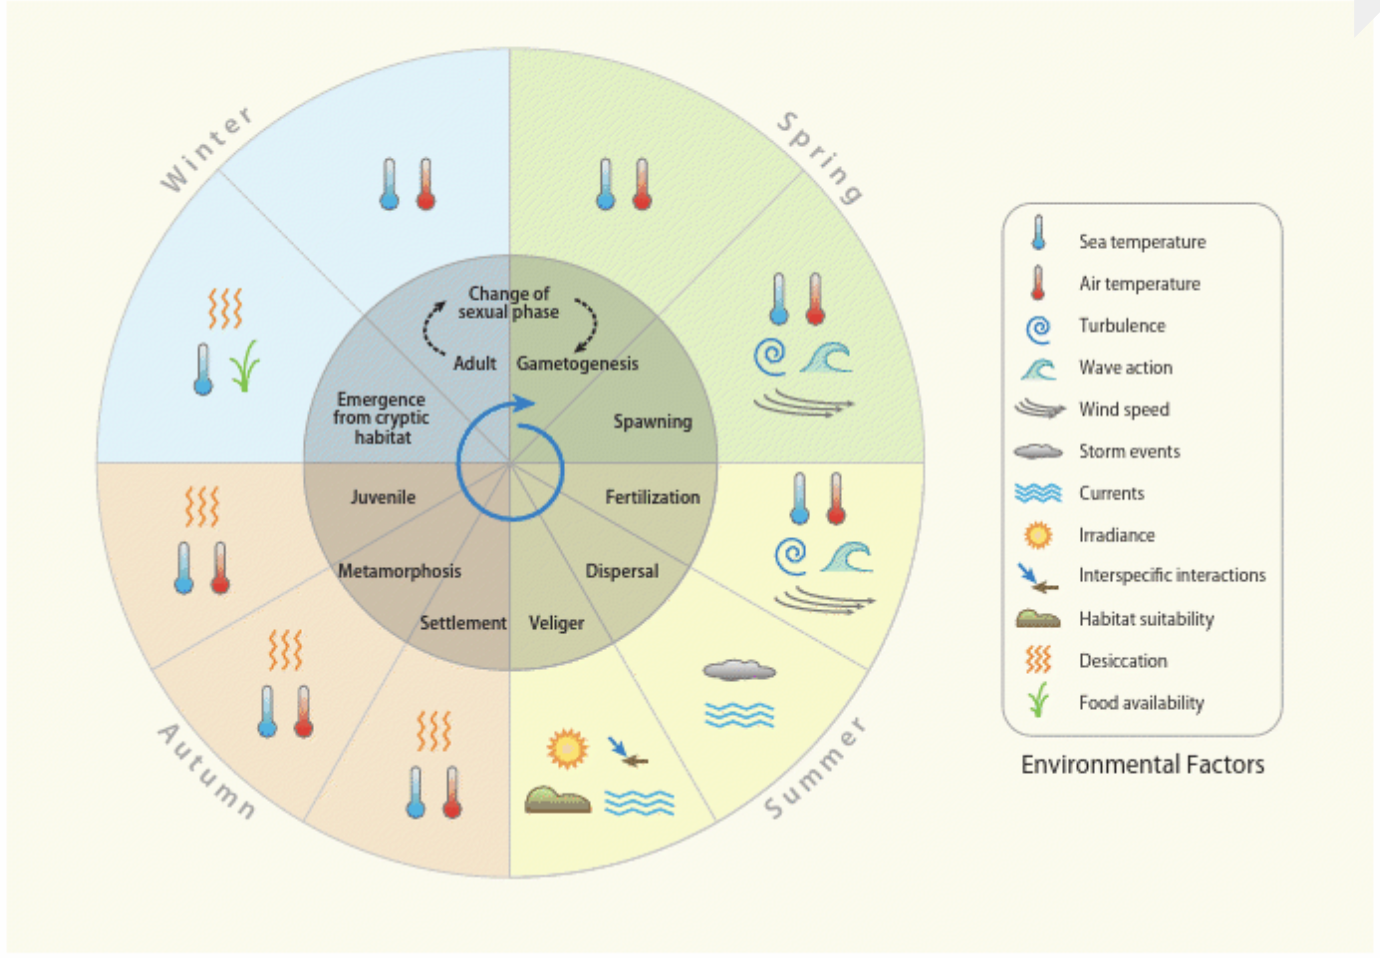
* Variable importance of multiple climatic and non climatic factors on physiological performance and survival of limpet during throughout its life history
* introduce some graphic design and viscomm principles (e.g., Jean Luc Dumont)
* **3. How to build a story**
* this is an writing/oral presentation challenge
* requires an ability to express ideas in a logical order for the audience
* done at a micro (single figure) and macro (whole presentation) level
* *how to help students understand:*
* critique part of the [video](https://www.youtube.com/watch?v=Uv_NtODQiss&t=2548s) they watched for class
* time points: 4:40-5:10 AND 23:21-24:12
* what does the speaker do more successfully in her intro (first time point) that she could do to help the audience better understand the data (second time point)?
* she breaks up a complicated idea into its component parts, orders it into a logical way, and has the visuals on the screen appear as she explains it
**Part III: Craft a presentation** (1 hour)
Try applying the skills we have discussed today by creating a 3 minute presentation for a general audience based on one of the results that Lowry et al. are conveying in Table 1.
* Find one of the big ideas in this table
* what is the result? what background information would we need to understand the result? why does this result matter?
* check in to share what result you picked
* Portray the result in a way people can understand
* choose a visual "homebase" - core visual you could imagine keeping on screen for some amount of time as you build up audience's understanding over time
* sometimes you need to implement visual strategies the original paper does not use to make the big idea more obvious
* sometimes you need to make a new figure that wasn't in the original paper
* just like DD/Sbux example - the payoff of designing these visuals is you can plot a bunch of people on it
* check in to share a static version of visual homebase- bring up to overhead
* Build a story
* turn that static homebase into something dynamic- help the audience understand the central "character" of the story of this result- how we got here and where we go from here
* here we can do what the paper couldn't do- we can make the story more clear by animating it so the visual and oral parts of the presentation align (don't need to engage with each indendently)
* using the overhead camera space to graadually unfold the visual story in pieces
**Part IV: Present!** (30-45 min)
* every group presents and gets feedback on presentation
## Space and gear prep
* arts supplies on the tables
## Media prep
* buttons for the grid
## Reflections
This workshop gave students the chance to spend a good amount of time considering the role of visualization in communicating and elucidating complicated ideas in science. Students eagerly contributed to conversations about the strategies that enable us to create clearer and more effective visuals. They also were able to spend time unpacking and more thoroughly understanding material from earlier in the course that had previously been dense and confusing. The act of creating visuals explaining concepts from the paper not only allowed them to practice generating successful visuals but also helped them better understand the data in the paper. Students also gained valuable experience orally unpacking a visual as they would in a presentation, and they began to consider how they might animate those visuals to align with their words.
### Notes from the Instructor
[20230216 consultation notes](https://docs.google.com/document/d/1ujAupeOi9lsocd0eCZAyMXsyhkXhqTksVW5a-V-G4M0/edit#heading=h.absunsv25hxr)
 Sign in with Wallet
Connect another wallet
Sign in with Wallet
Connect another wallet