# Graphics Lab Lookbook
## slides
[Steve Jobs iPad Launch](https://www.youtube.com/watch?v=6Fk1V5NqoD4&t=103s)

[Harvard Horizons 2023](https://www.youtube.com/watch?v=oAwPbgR5sDA)
more Harvard Horizons, across the years!
## graphical abstracts
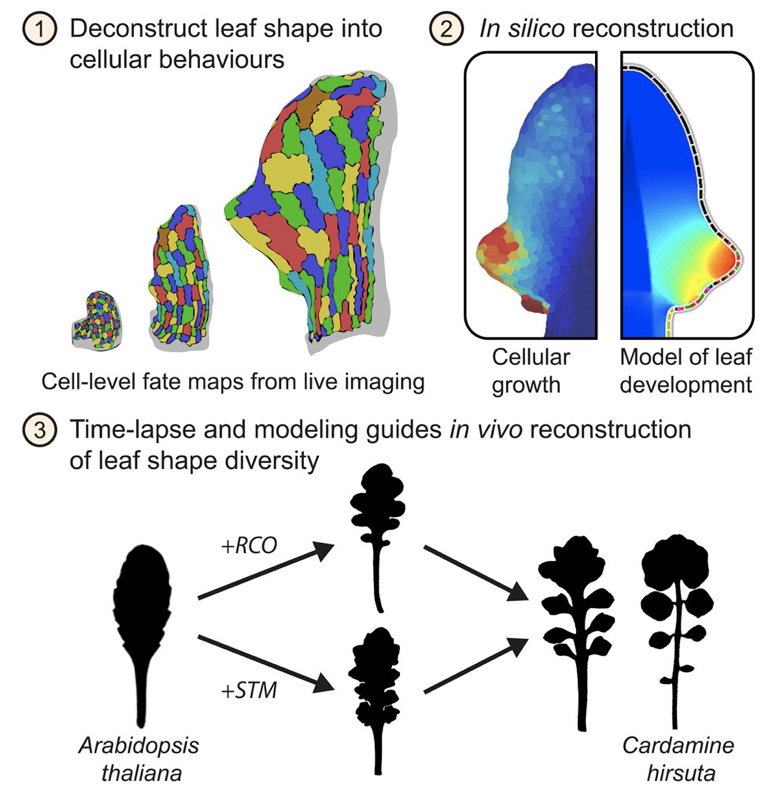
[A Growth-Based Framework for Leaf Shape Development and Diversity](https://www.cell.com/cell/fulltext/S0092-8674(19)30509-4), Kierzkowski et al. 2019, *Cell*
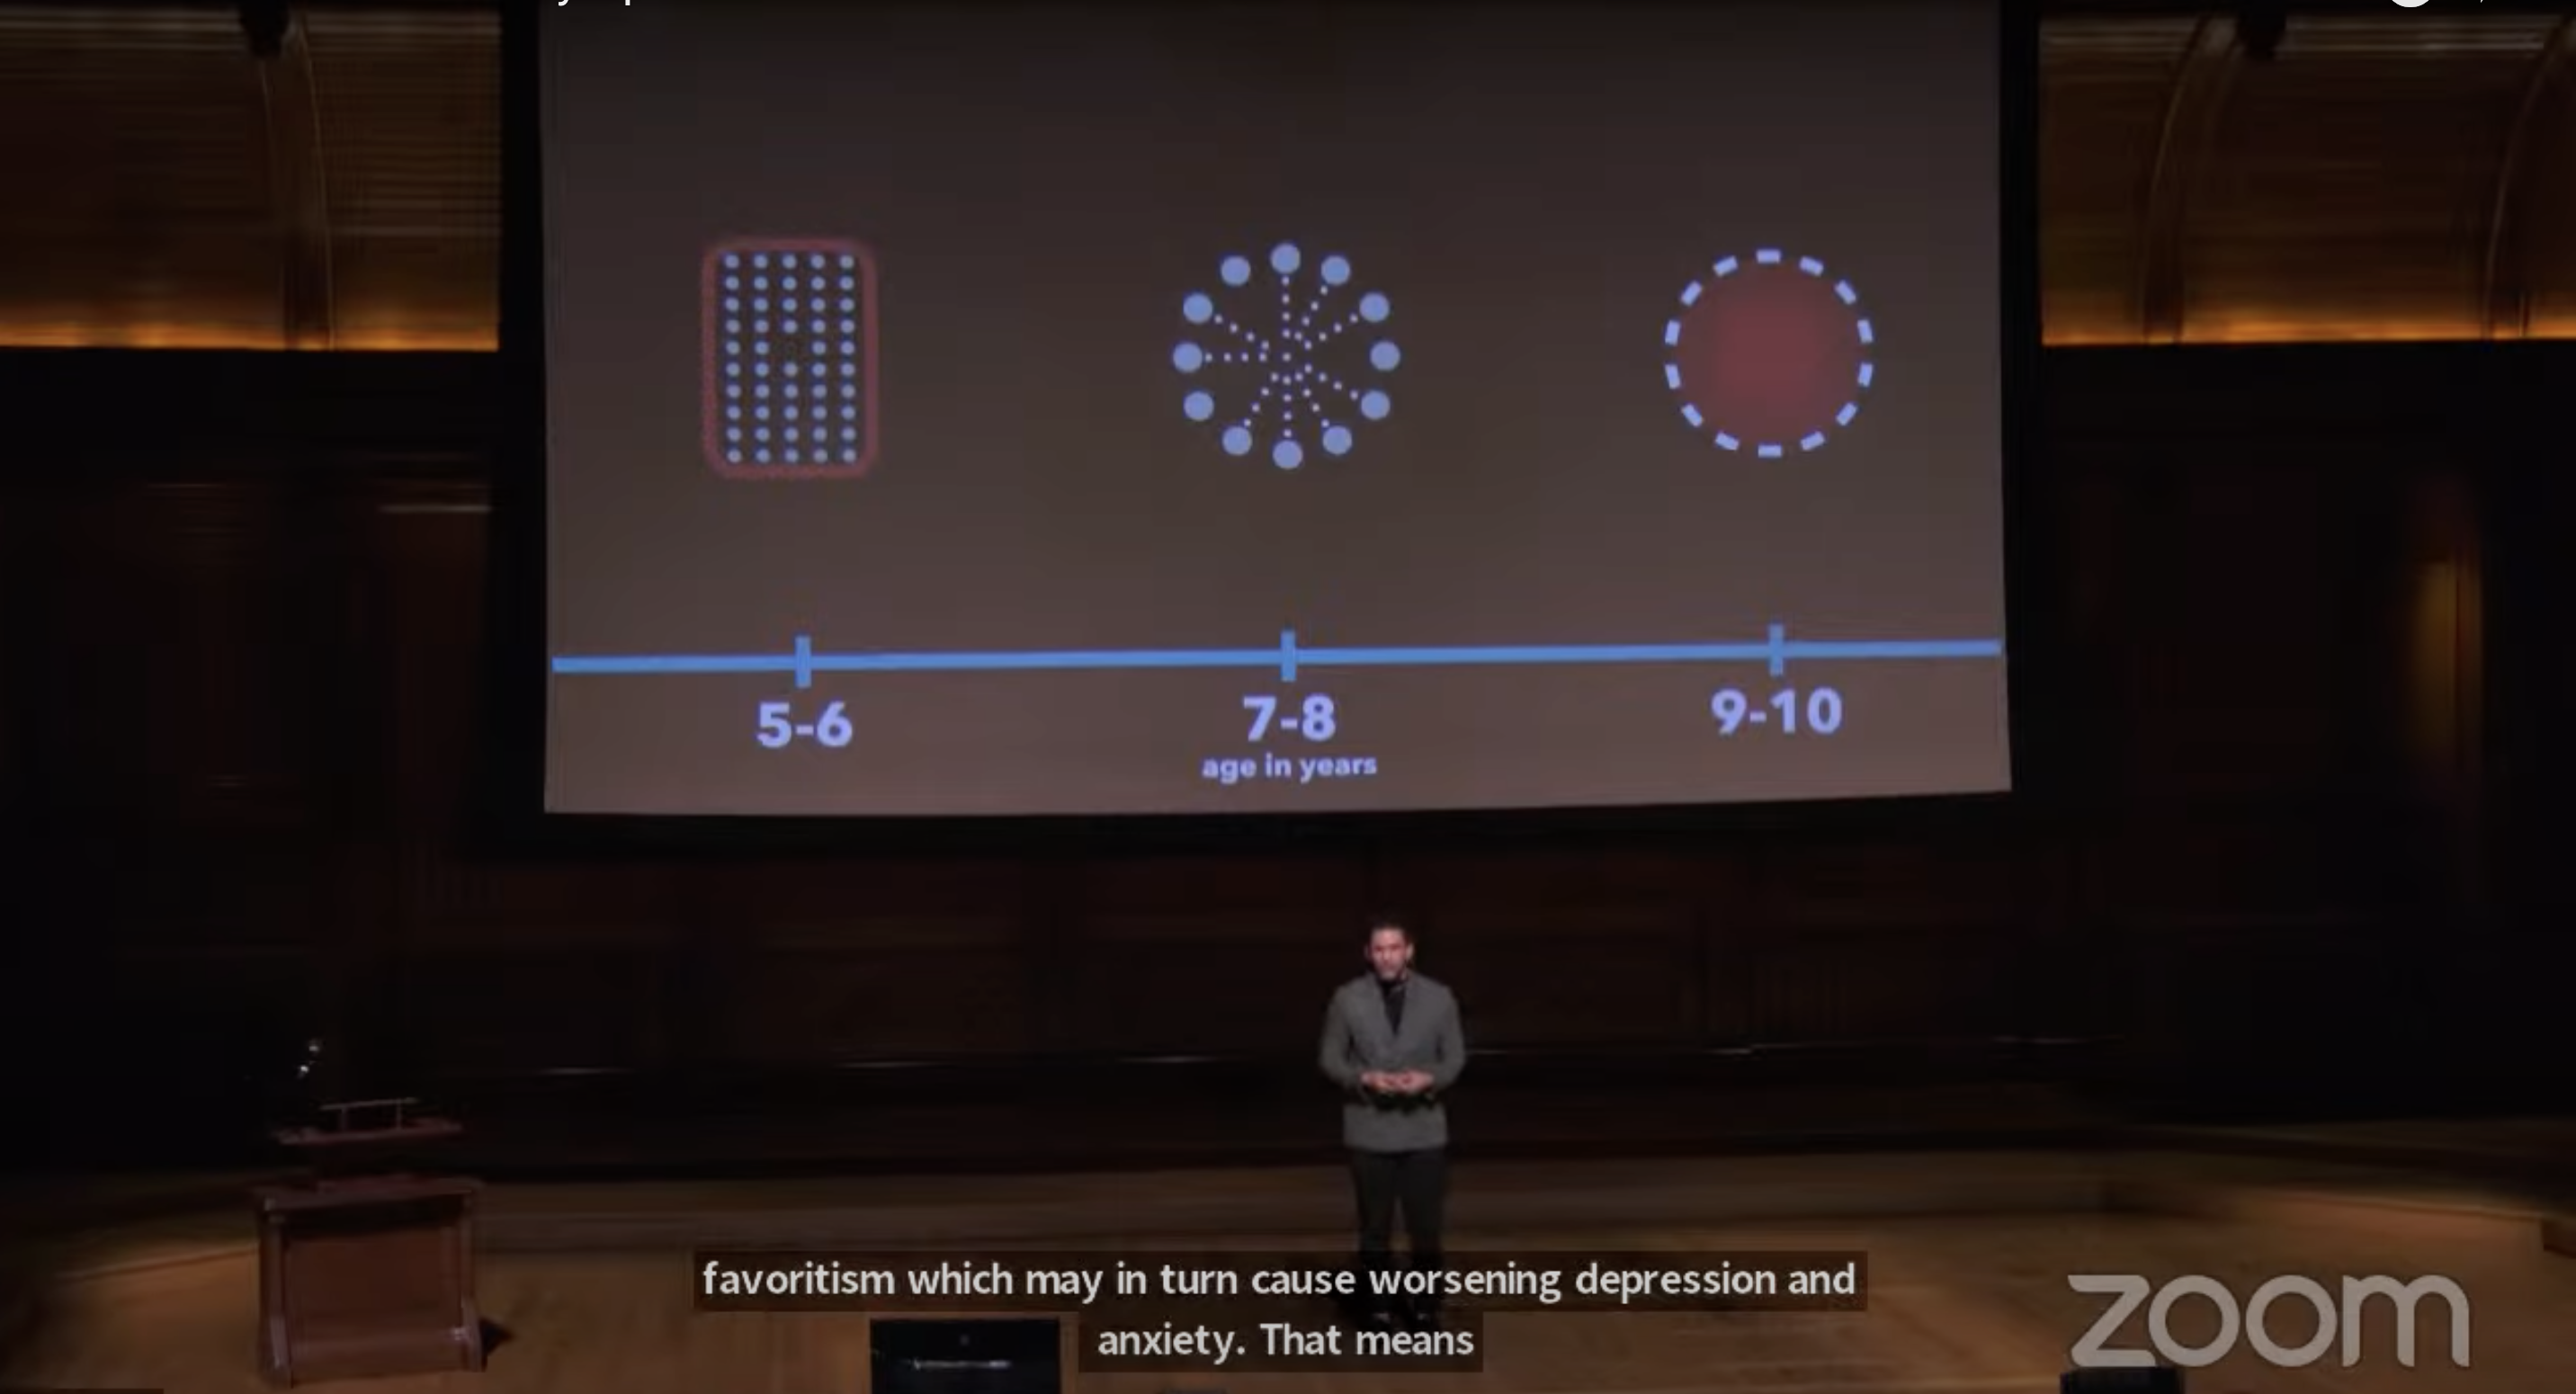
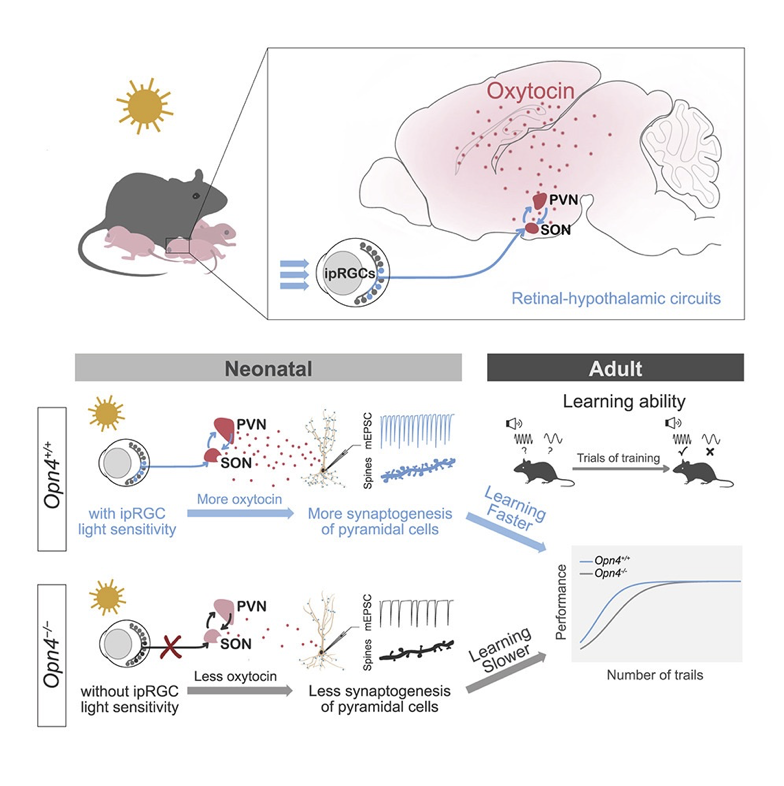
[Melanopsin retinal ganglion cells mediate light-promoted brain development](https://www.cell.com/cell/fulltext/S0092-8674(22)00912-6), Hu et al. 2022, *Cell*
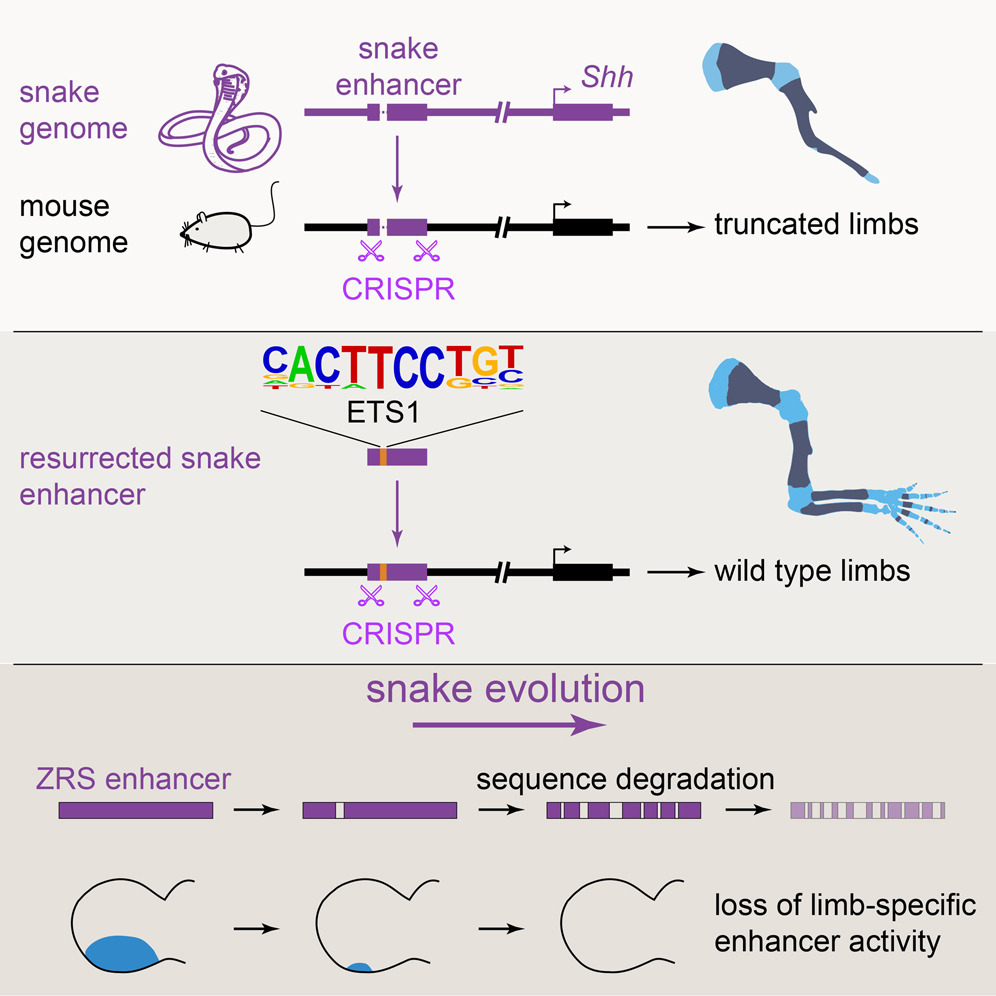
[Progressive Loss of Function in a Limb Enhancer during Snake Evolution
](https://www.cell.com/cell/fulltext/S0092-8674(16)31310-1), Kvon et al. 2016, *Cell*
## websites
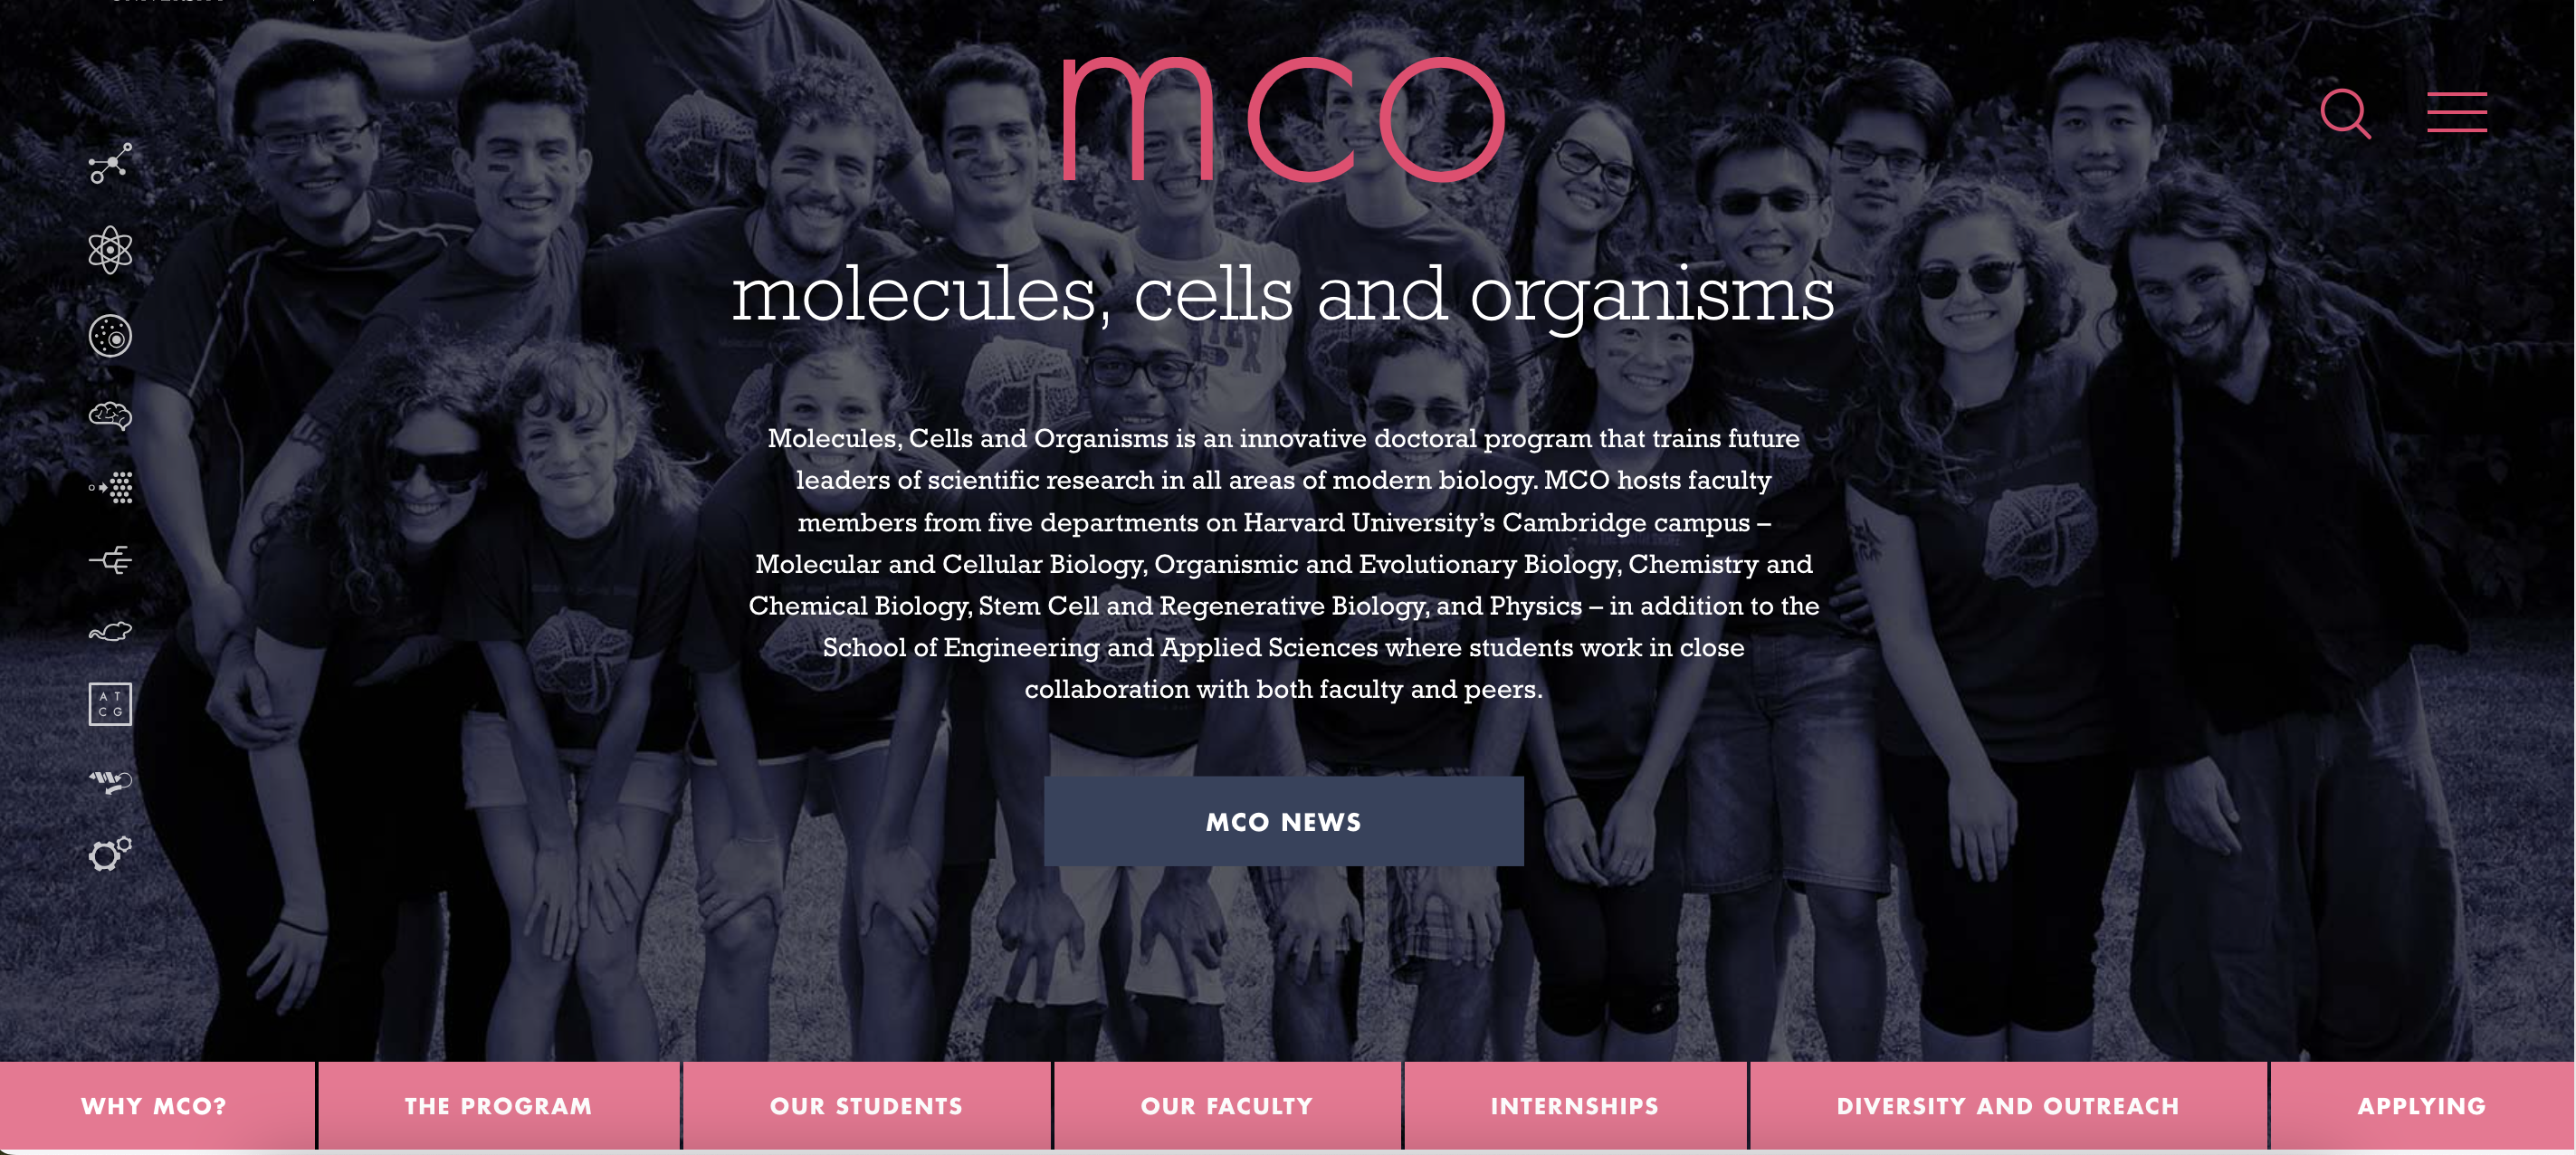
[Harvard Department of Molecular and Cellular Biology](https://www.mcb.harvard.edu/)
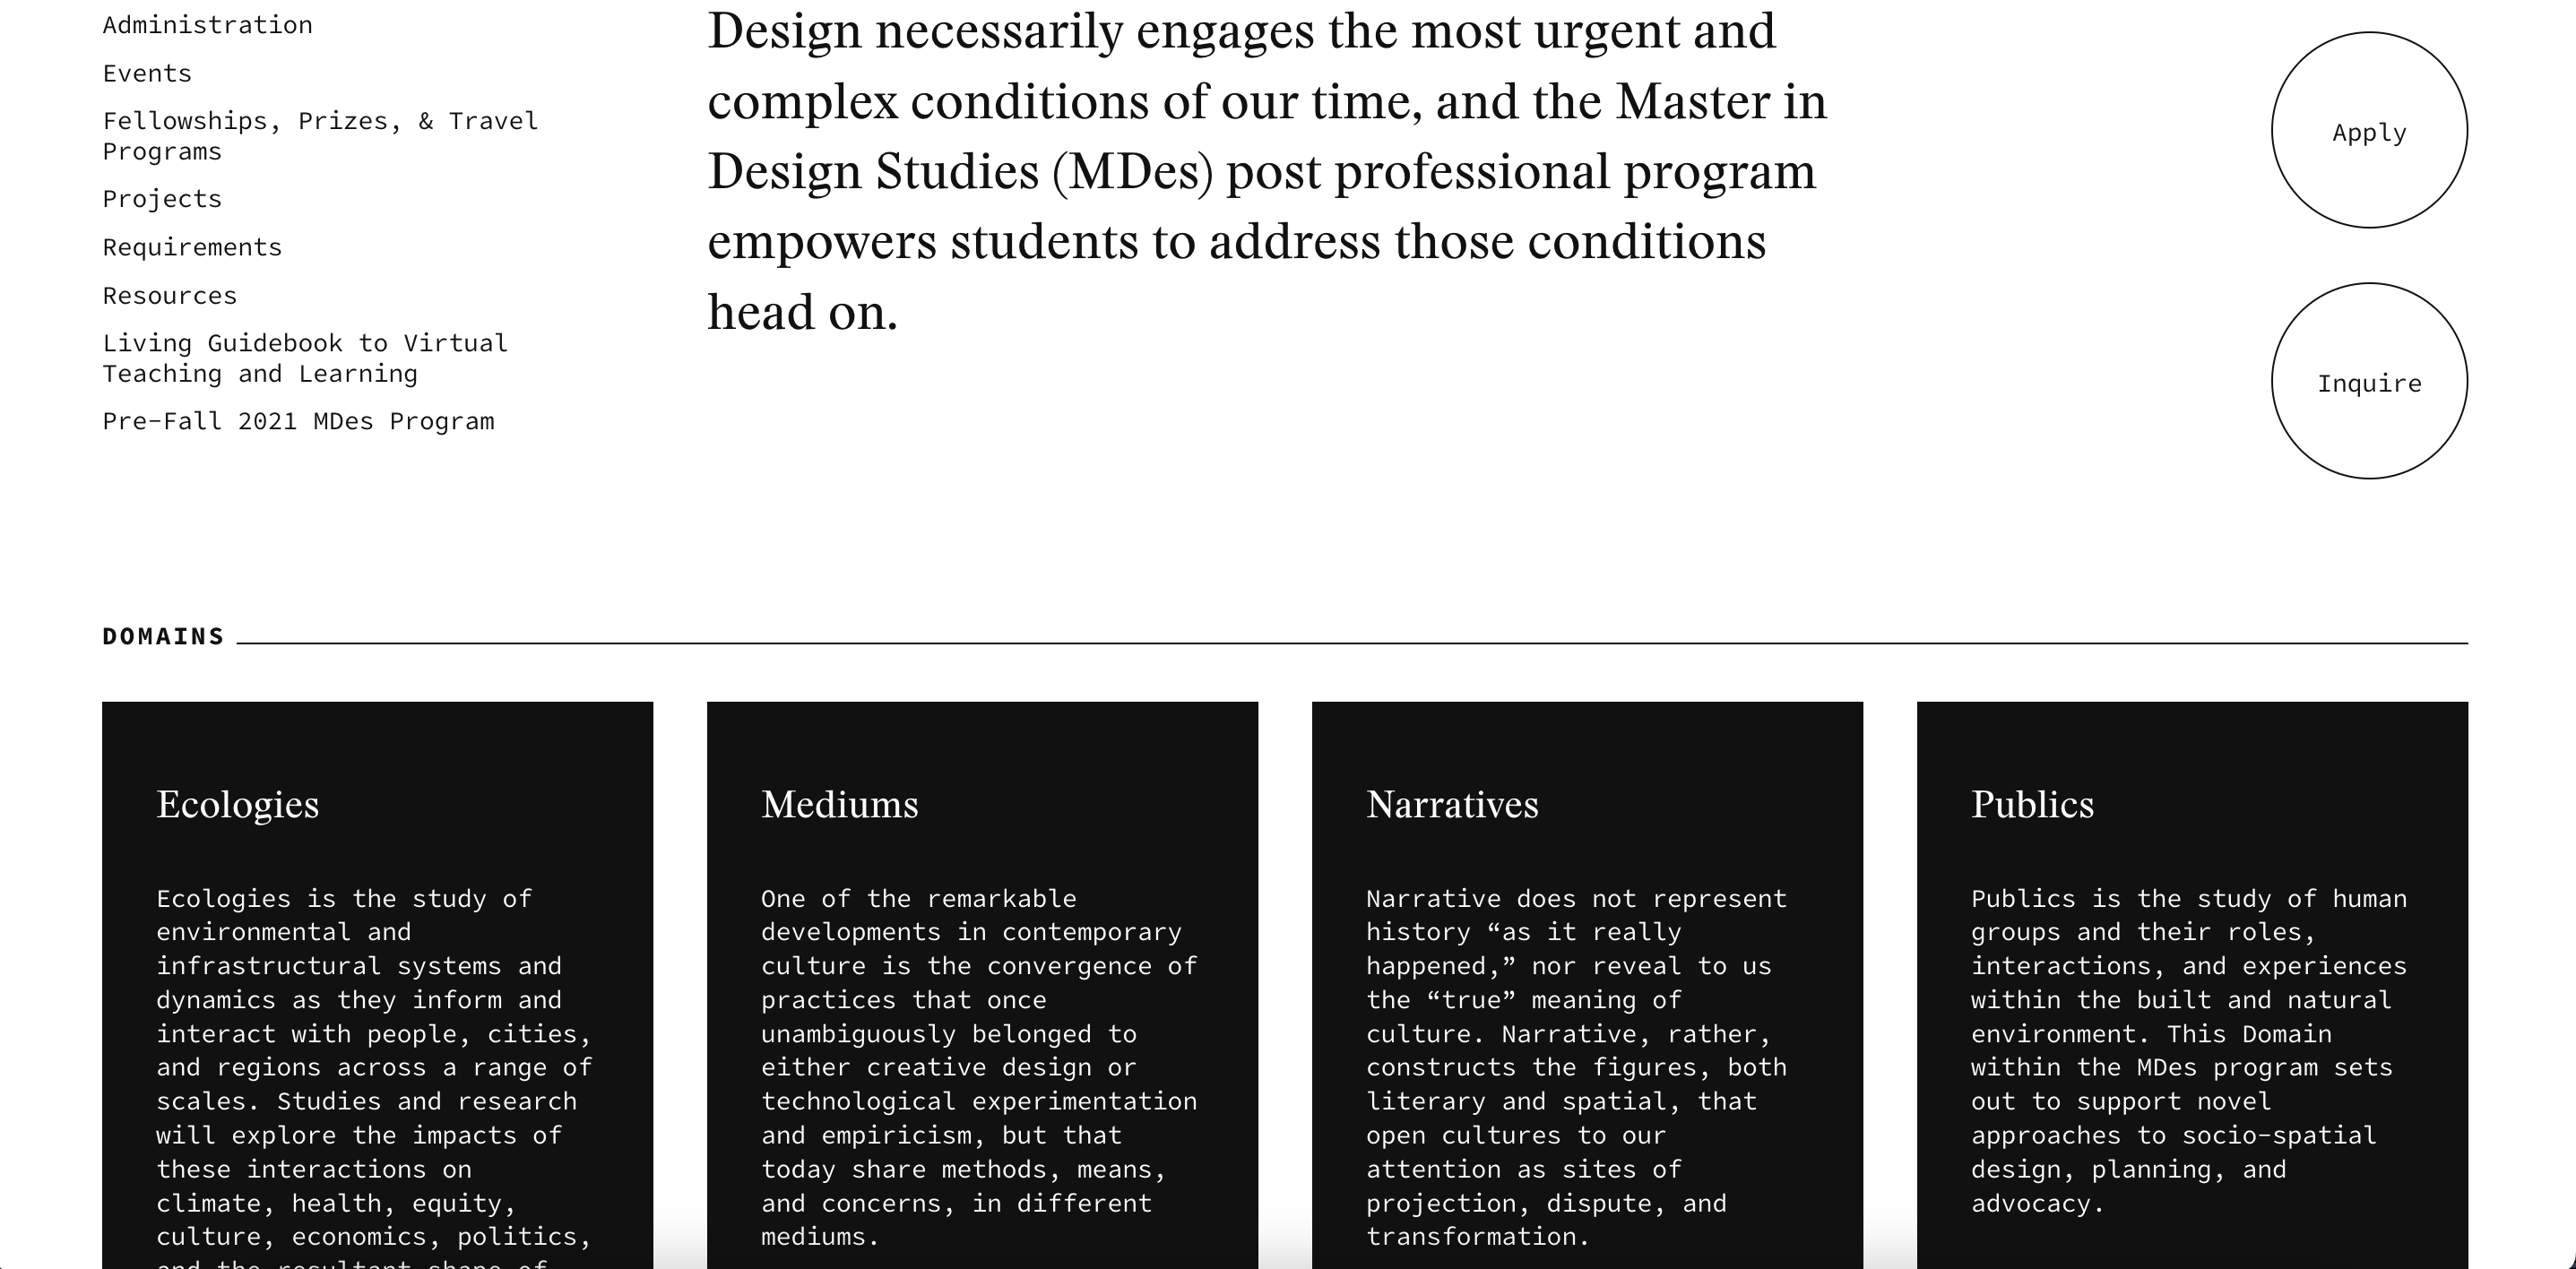
[Harvard Graduate School of Design](https://www.gsd.harvard.edu/)
## infographics
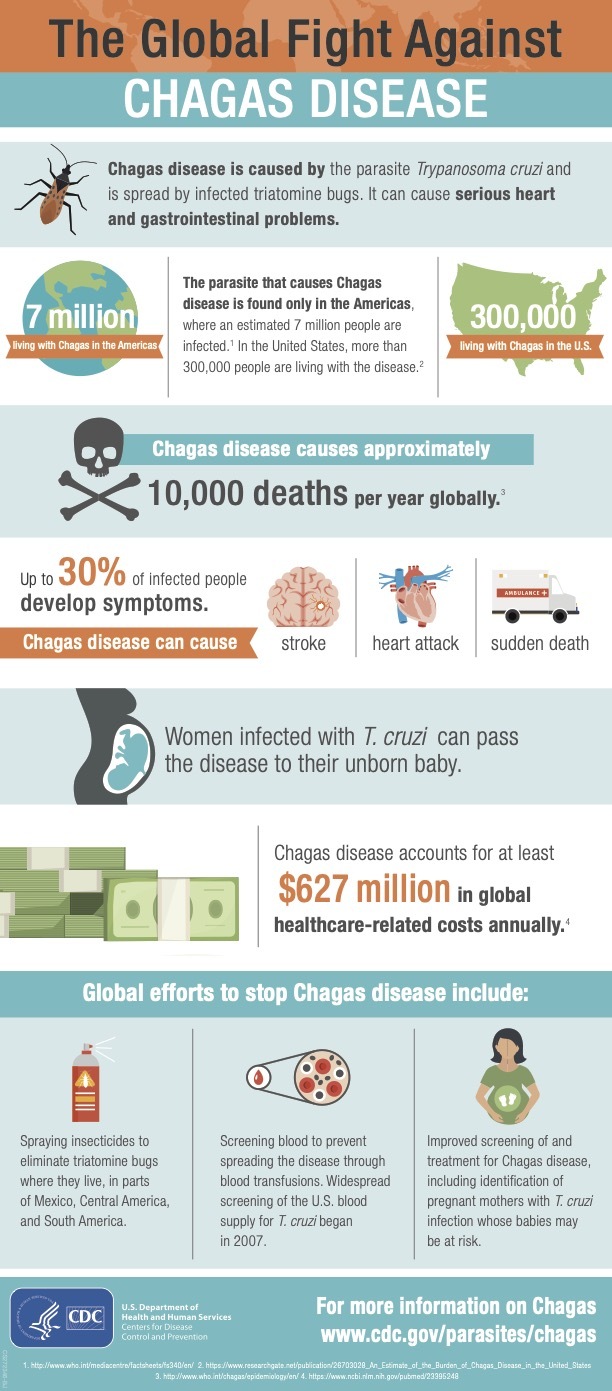
[CDC Global Health Infographics](https://www.cdc.gov/globalhealth/infographics/default.html)
[EPA PSA](https://www.epa.gov/ground-water-and-drinking-water/infographic-lead-drinking-water)

## conceptual illustrations
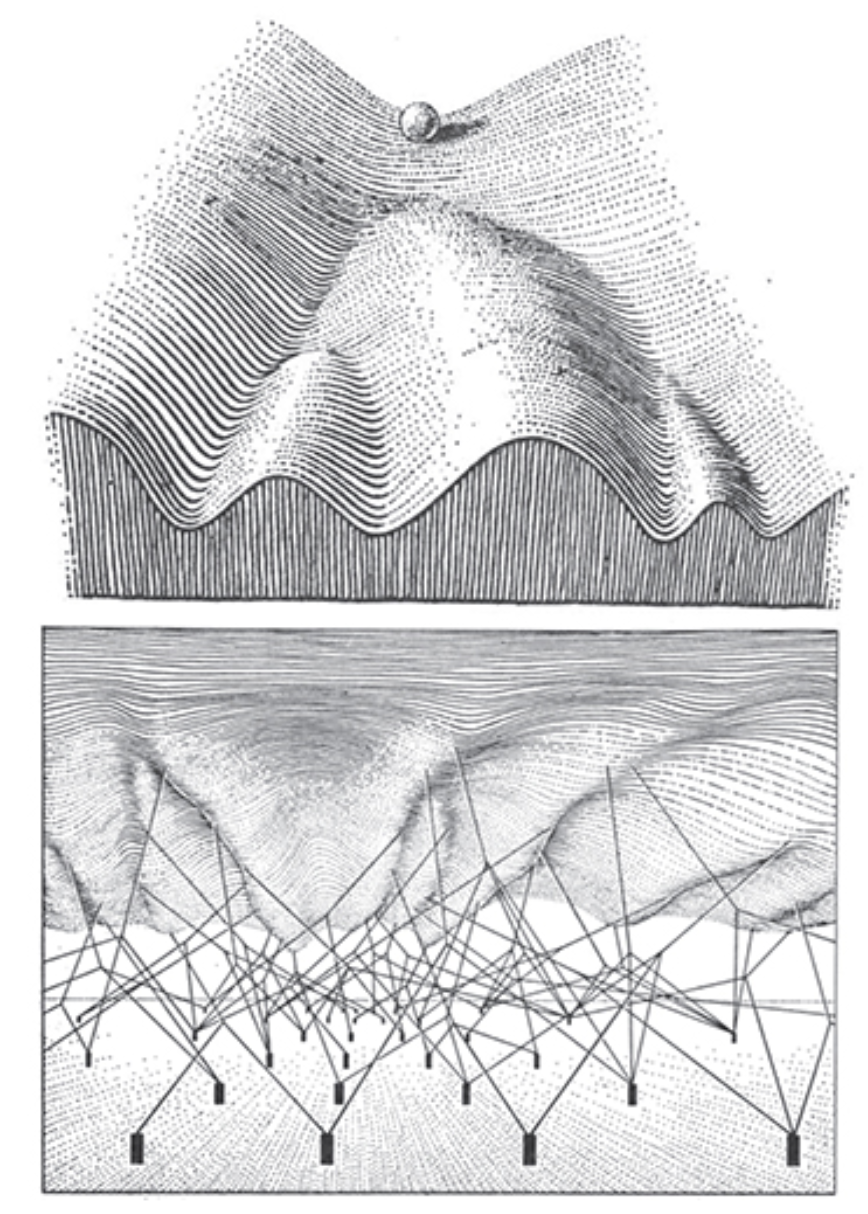
**Waddington's landscape (Waddington, *The Strategy of Genes*, 1957)**
A classic example from biological sciences of a visual representation of a complex concept. It was designed to explain the connection between developmental and evolutionary dynamics. The ball represents the current state of a developing biological system. The ball rolls downhill along valleys that determine the system’s possible trajectories. The branching points in these valleys represent each developmental decision (e.g., becoming a skin cell or a blood cell). The steepness of the slopes of the valleys that are keeping the ball on track represent the robust nature of development. Underneath the surface of the landscape, pegs are connected to it by a network of ropes, which pull and alter the topography above. The pegs represent genes and the ropes their influence on the developmental system.
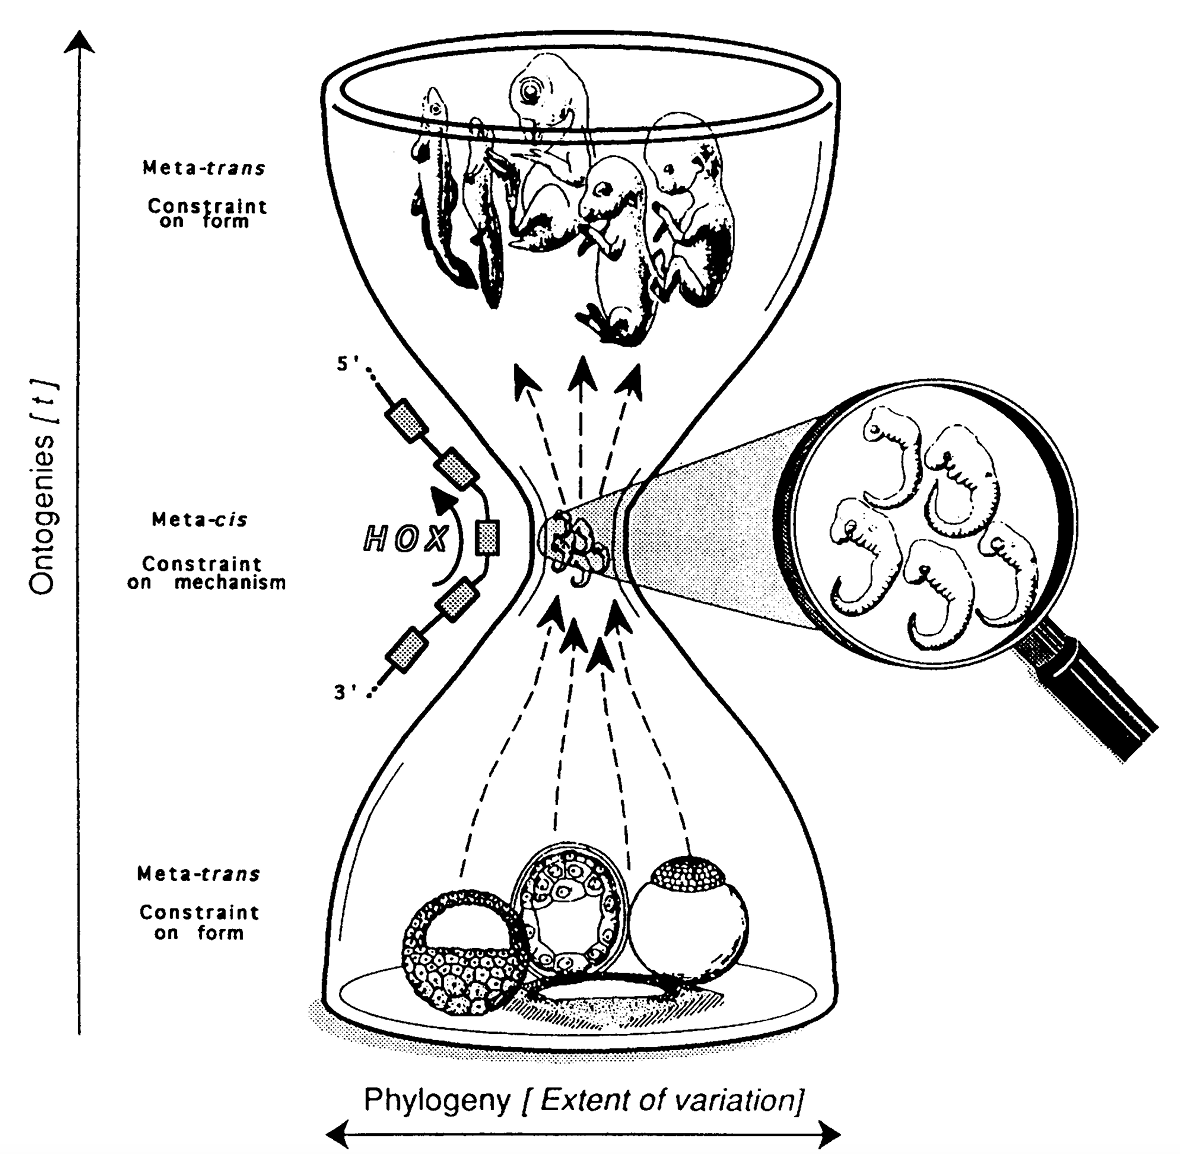
**Hourglass model for vertebrate development (Duboule 1994, *Development Supplement*)**
This visualization was designed to help explain the observation that when studying the development of different vertebrate species, their embryos are most similar during mid-embryogenesis (called the "phylotypic stage". This model suggests that the highest level of developmental constraints occur during mid-embryogenesis, while the lowered constraints earlier and later in development allow for more variation across species.
 Sign in with Wallet
Connect another wallet
Sign in with Wallet
Connect another wallet