---
tags: course support
---
# INFOGRAPHIC RESOURCES for PSY1845 Stigma, Discrimination, and Health
## Prompt
Create a 1-page infographic for a policy maker from your home state who is interested in reducing structural stigma against the group you are exploring this semester. In this infographic, you will provide the policy maker with information you think is relevant for understanding the issues confronting your group (e.g., basic demographic information, such as their prevalence in your state or prevalence of adverse health conditions). You will then advocate for a specific policy proposal (or proposals) that the policy maker should consider in order to reduce structural stigma, citing evidence for its potential effectiveness from this week’s readings or from other research you have conducted.
## Examples
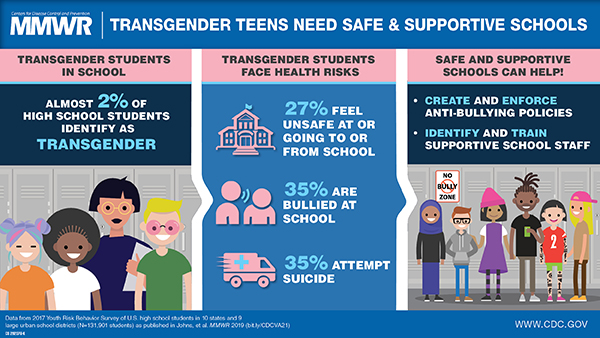
[Source](https://www.cdc.gov/mmwr/volumes/68/wr/mm6803a3.htm)

[Source](https://www.glaad.org/blog/violence-against-transgender-people-and-people-color-disproportionately-high-lgbtqh-murder-rate)
## Resources
Infographics combine data, text and graphical design to offer viewers compelling and informative arguments and explanations. In the examples above, the abstract, often highly technical content of a policy paper or proposal is summarized in a visal argument that can be consumed at a glance.
The Bok Center's Learning Lab has compiled some resources and tips here to help you create your infographics, but if you don't find exactly what you're looking for, or want a walkthrough of something specific, or run into challenges, don't hesitate to submit a question at [**help.learninglab.xyz**](http://help.learninglab.xyz)! We'll start with the tools in case you just want to get started immediately, but, if you can, stay tuned all the way to the bottom of the page for additional thoughts on the what and why of infographics.
### Digital Tools
There are a number of excellent, free resources for creating infographics online, including [Canva](https://www.canva.com/), [Google Slides](slides.google.com), and the [Adobe Creative Suite](https://harvard.service-now.com/ithelp/www.poetry.fas.harvard.edu?id=kb_article&sys_id=9f3244d3dba304d430ed1dca489619e0). While you are invited to use any tool you are comfortable in, we'll provide more resources on Google Slides and Canva.
#### Google Slides
While we imagine you all are Slides experts by now, here are a few things to get you started:
* [Infographics Templates in Slides](https://docs.google.com/presentation/d/1ajcswbWyzFaeX05lM7EPftbN260MMdDrtm3tF2k0Trg/edit#slide=id.g566fecf33e_0_57)
* [Google Slides "Cheat" Sheet](https://support.google.com/a/users/answer/9300133)
* [Formatting a Poster in Slides](https://drive.google.com/file/d/1NP-VfG0bxz3gEuNArLM_vJVRsQtYwAEd/view)
#### Canva
Canva is a free web-based graphic design platform that your can use to collaboratively create and share social media graphics, presentations, posters, documents, etc.
* [Create an account on Canva.com](https://support.canva.com/account-basics/creating-a-canva-account/create-personal-account/)
* [Follow this tutorial to learn how to use Canva](https://www.canva.com/design/DADBIDEcQzE/remix)
* If you want to learn more about Canva, [check out this guide](https://docs.google.com/document/d/16dB8gsWFLo9pkT9NjEJVA61dDoQGKuwqil44w_-7Nqw/edit?usp=sharing).
### Additional resources
* [**Thirteen Reasons Why You Brain Craves Infographics**](https://neomam.com/interactive/13reasons/): An infographic about the effectiveness of infographics
* [**Types of Infographics**](https://venngage.com/blog/9-types-of-infographic-template/): An overview of some common infographic formats with templates
* [**Pinterest of Design Principles**](https://www.pinterest.com/pin/465700417688840345/)
* [**datasketches**](http://www.datasketch.es/): Some beautiful data-driven graphics and notes on the process behind them for inspiration
* [**The Noun Project**](https://thenounproject.com/): Database of free icons
* Explore color palettes: [**Coolors**](https://coolors.co/) and [**Colormind**](http://colormind.io/)
* [**The Bok Center's pinterest on information design**](https://www.pinterest.com/learninglabpins/medium-information-design/)
* [**The Bok Center's pinterest on graphic design**](https://www.pinterest.com/learninglabpins/medium-graphic-design/
)
* [**Canva's best infographics**](https://www.canva.com/learn/best-infographics/)
* [**15 steps to make an infographic**](https://www.canva.com/learn/create-infographics/)
* [**How to tell a story with data**](https://www.forbes.com/sites/nicolemartin1/2018/11/01/data-visualization-how-to-tell-a-story-with-data/?sh=2eda1bd64368)
* [**Journalistic strategies for data visualization**](https://hbr.org/2013/04/how-to-tell-a-story-with-data)
* [**Adobe CC for science**](https://spark.adobe.com/page/1DNTRncz9bpsX/)
 Sign in with Wallet
Connect another wallet
Sign in with Wallet
Connect another wallet