---
tags: hh22
---
# Chika Okafor - HH22
[Drive Folder](https://drive.google.com/drive/folders/16VdoceJhip00FHzbk4PqS5pzVo2gdb9t?usp=sharing)
[microproject-hh-chika-footage](https://hackmd.io/z80panztReGsXqR86liNtQ)
[R Data files](https://drive.google.com/drive/folders/1NAVD8Xw2HplpANb9RExh6C6TzNm6x8D1?usp=sharing)
## Visual Ideas
### 2/8
Story
- Will plan to continue to refine his script
- He talked through script and we talked about how to help people focus on main points, perhaps reduce some detail
Visuals
- Animating graphs?
- Maps or timeline
### 2/17
Hi @marlon! I added relevant R data visualizations that I hope can be refined and incorporated as some of the visuals in my presentation. Would love to hear what you think and/or talk through the best way of coordinating: https://drive.google.com/drive/folders/1uhL3ByxVq3GbaOoiQl_nD06FjSuHd7f3?usp=sharing
### 2/24
Hey @katie and @marlon, I added the source data files to the R data visualizations folder. I also have been collecting some images, some of which will likely be integrated into my presentation: https://drive.google.com/drive/folders/1NAVD8Xw2HplpANb9RExh6C6TzNm6x8D1?usp=sharing
### 3/10
followup on our conversation yesterday: I added three files to this folder on my google drive: https://drive.google.com/drive/folders/1uhL3ByxVq3GbaOoiQl_nD06FjSuHd7f3?usp=sharing
### 3/11
Two additions to my google drive folder: https://drive.google.com/drive/folders/1AsTYaxVwWbqEObYNdxWmmC-c8Vz_rKio?usp=sharing
I updated/added images in the VideoMontage_1980s1990s folder
I created a second VideoMontage folder. A great idea I heard from my faculty mentor today was to replace the current slide 17 with a second video montage (i.e,. replace the slide that currently has the "Criminal Justice Reform" and "Public Opinion" text to create a video montage). This folder also includes the corresponding script I will say for that slide
Latest Keynote slides: https://drive.google.com/file/d/1n4QrCgCc4NsqfIDYDC44AnAeA8IH1Ppe/view?usp=sharing
## Images
* animated graphs and timelines. seems self-sufficient, but we could do some proofs of concept in After Effects
* [folder of examples here](https://drive.google.com/drive/folders/1_T4HltVxDMCHjXAaGh8qpqWyfgf_DOkJ)
* [microproject-hh-chika-footage](https://hackmd.io/z80panztReGsXqR86liNtQ)
* https://opportunityinsights.org/atlasresources/
* Hi @marlon! I added relevant R data visualizations that I hope can be refined and incorporated as some of the visuals in my presentation. Would love to hear what you think and/or talk through the best way of coordinating: https://drive.google.com/drive/folders/1uhL3ByxVq3GbaOoiQl_nD06FjSuHd7f3?usp=sharing
### 20220309
Slide 3
* Chika added potenital visuals to [this folder](https://drive.google.com/drive/folders/17PG_upZOej93lx8zNkyr1cPNfK8S99T_)
* aiming for a more somber tone, so consider a filter or like the aesthetic of the reagen signing image
* wants to be able to click "tough on Crime" and "war on drugs" and that can be either on top of video montage or above/below.
Slide 4
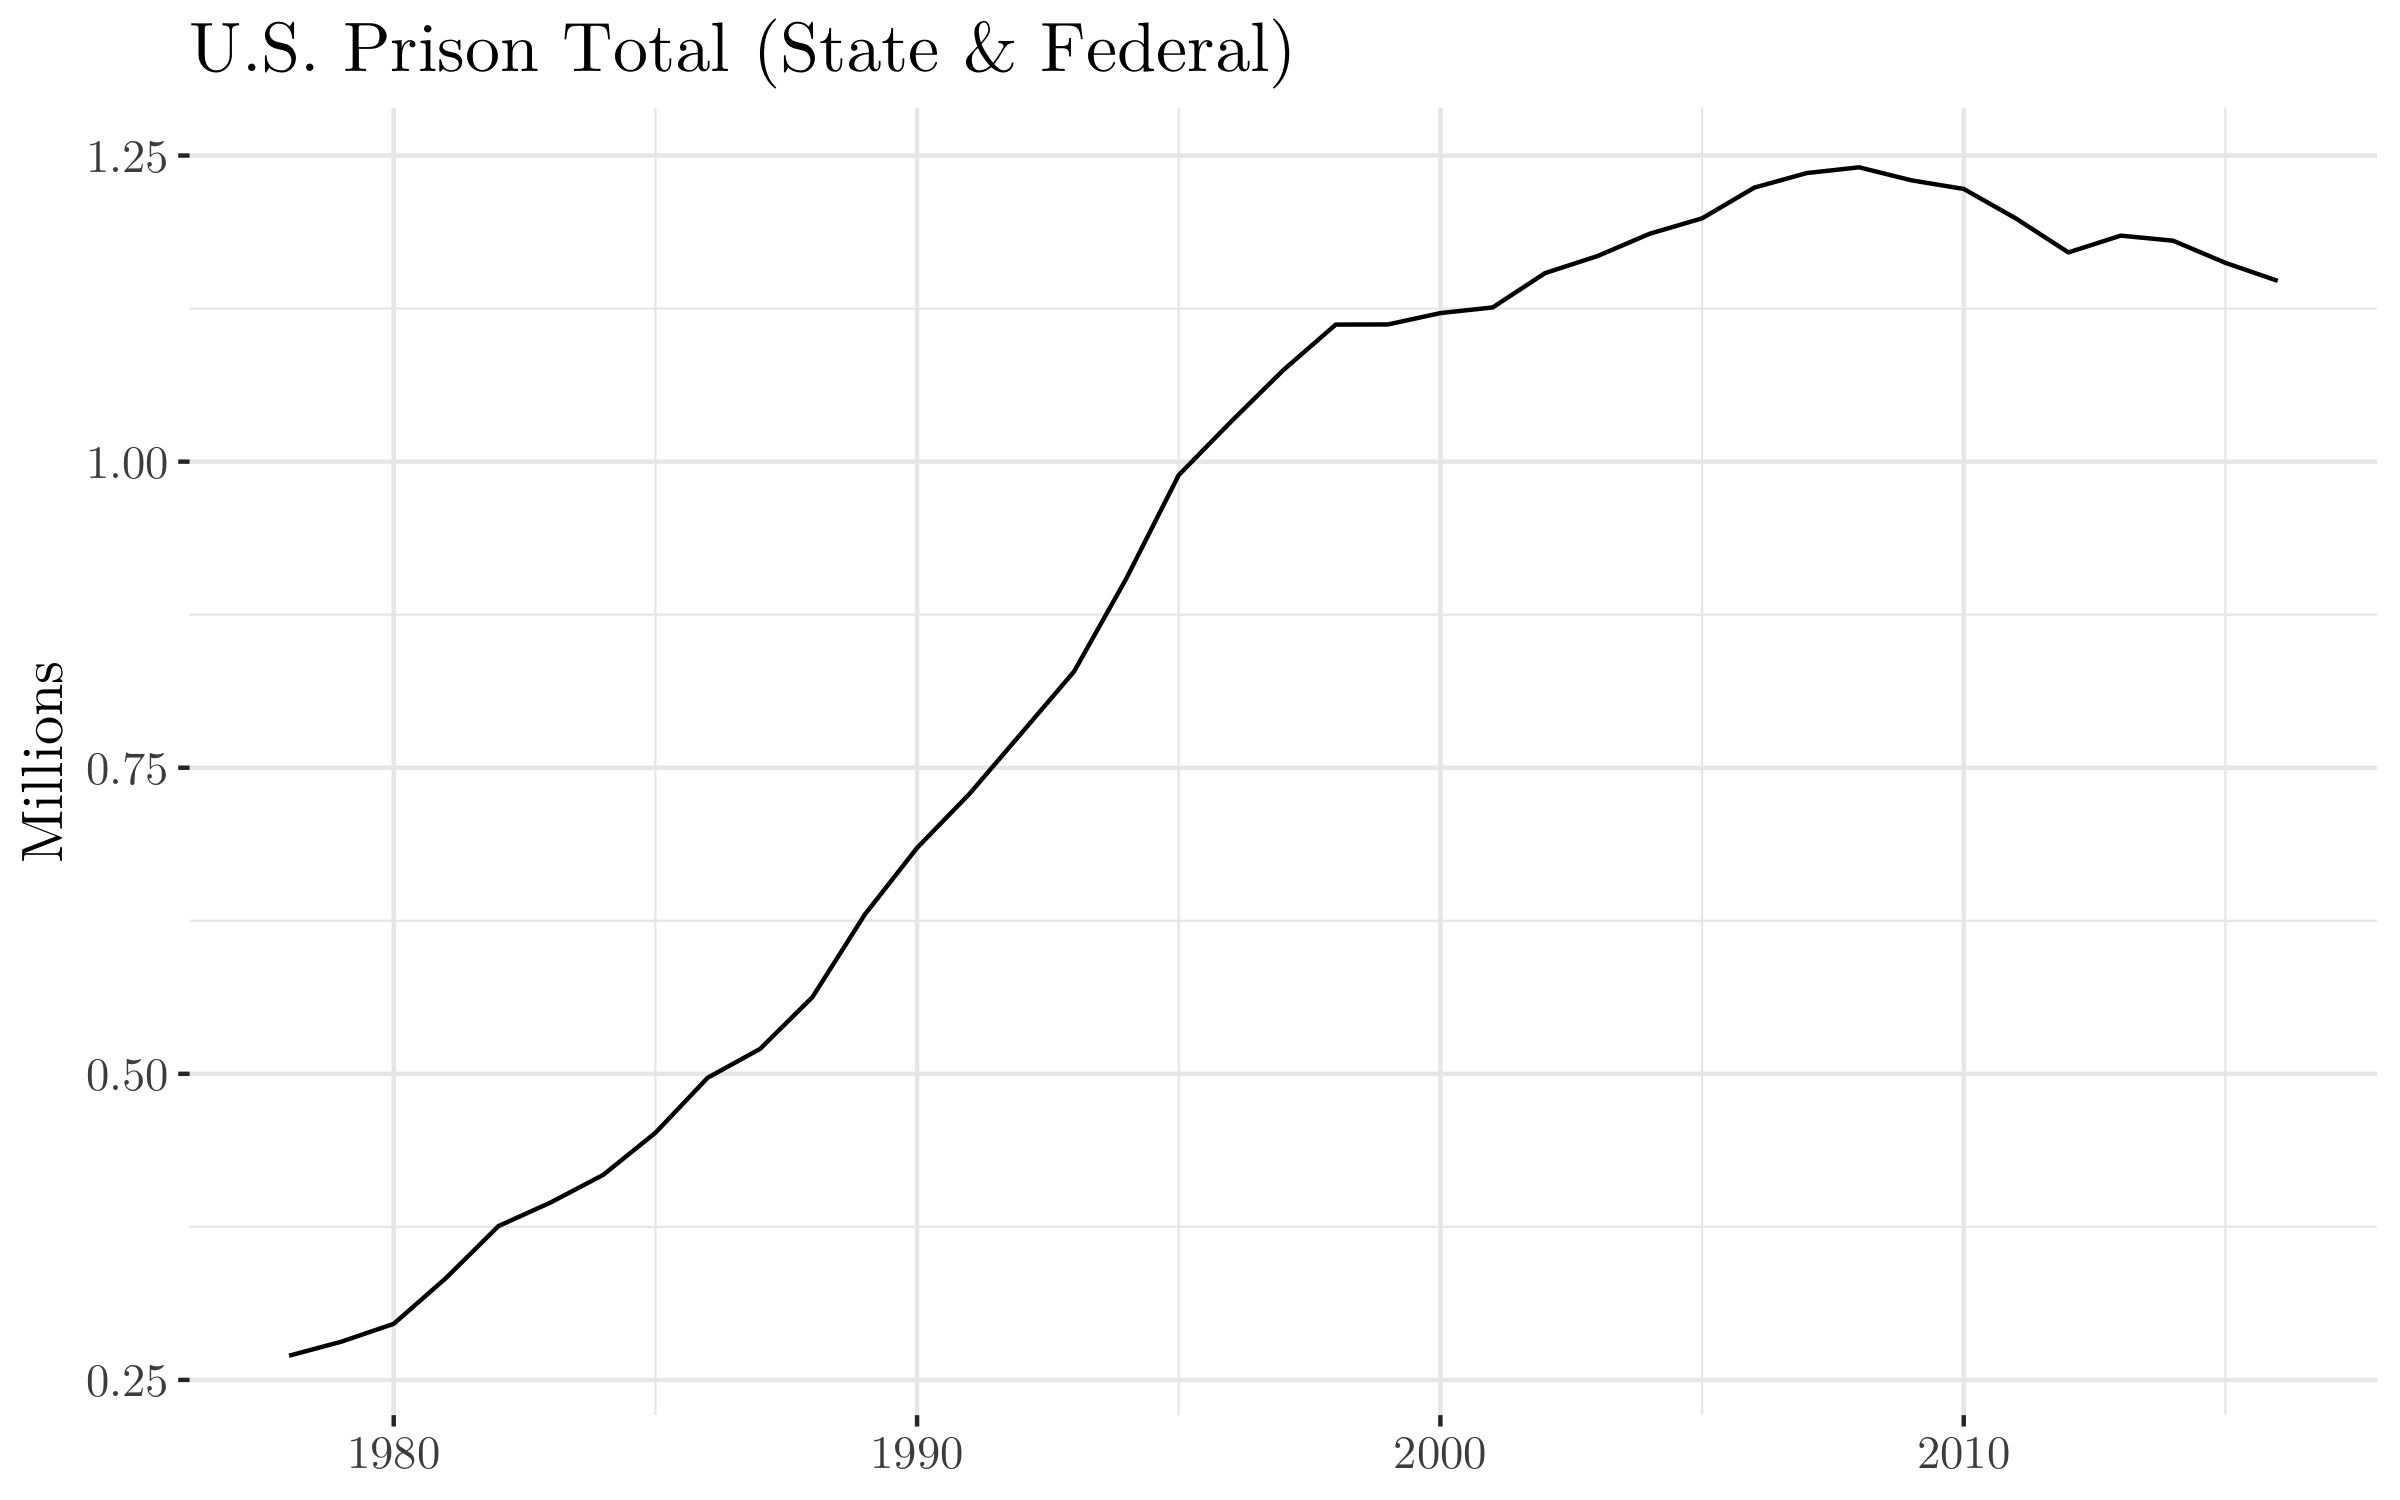
* ~~invert image to be white lines on black background~~ 3 assets in Chika folder: prison-graph
* csv [data](https://drive.google.com/file/d/1NPEQtyN-BCRVntrQ-0BG7I7Ty44Qa-FV/view?usp=sharing) to create [chart](https://drive.google.com/file/d/1QRvd28GiVD-FpC7nt1dB0nMGfzfE1Pm5/view?usp=sharing)
Slide 6
* ~~add kerning space between TT in ATTORNEYS~~
* ~~replace (1) with circle instead of ()~~
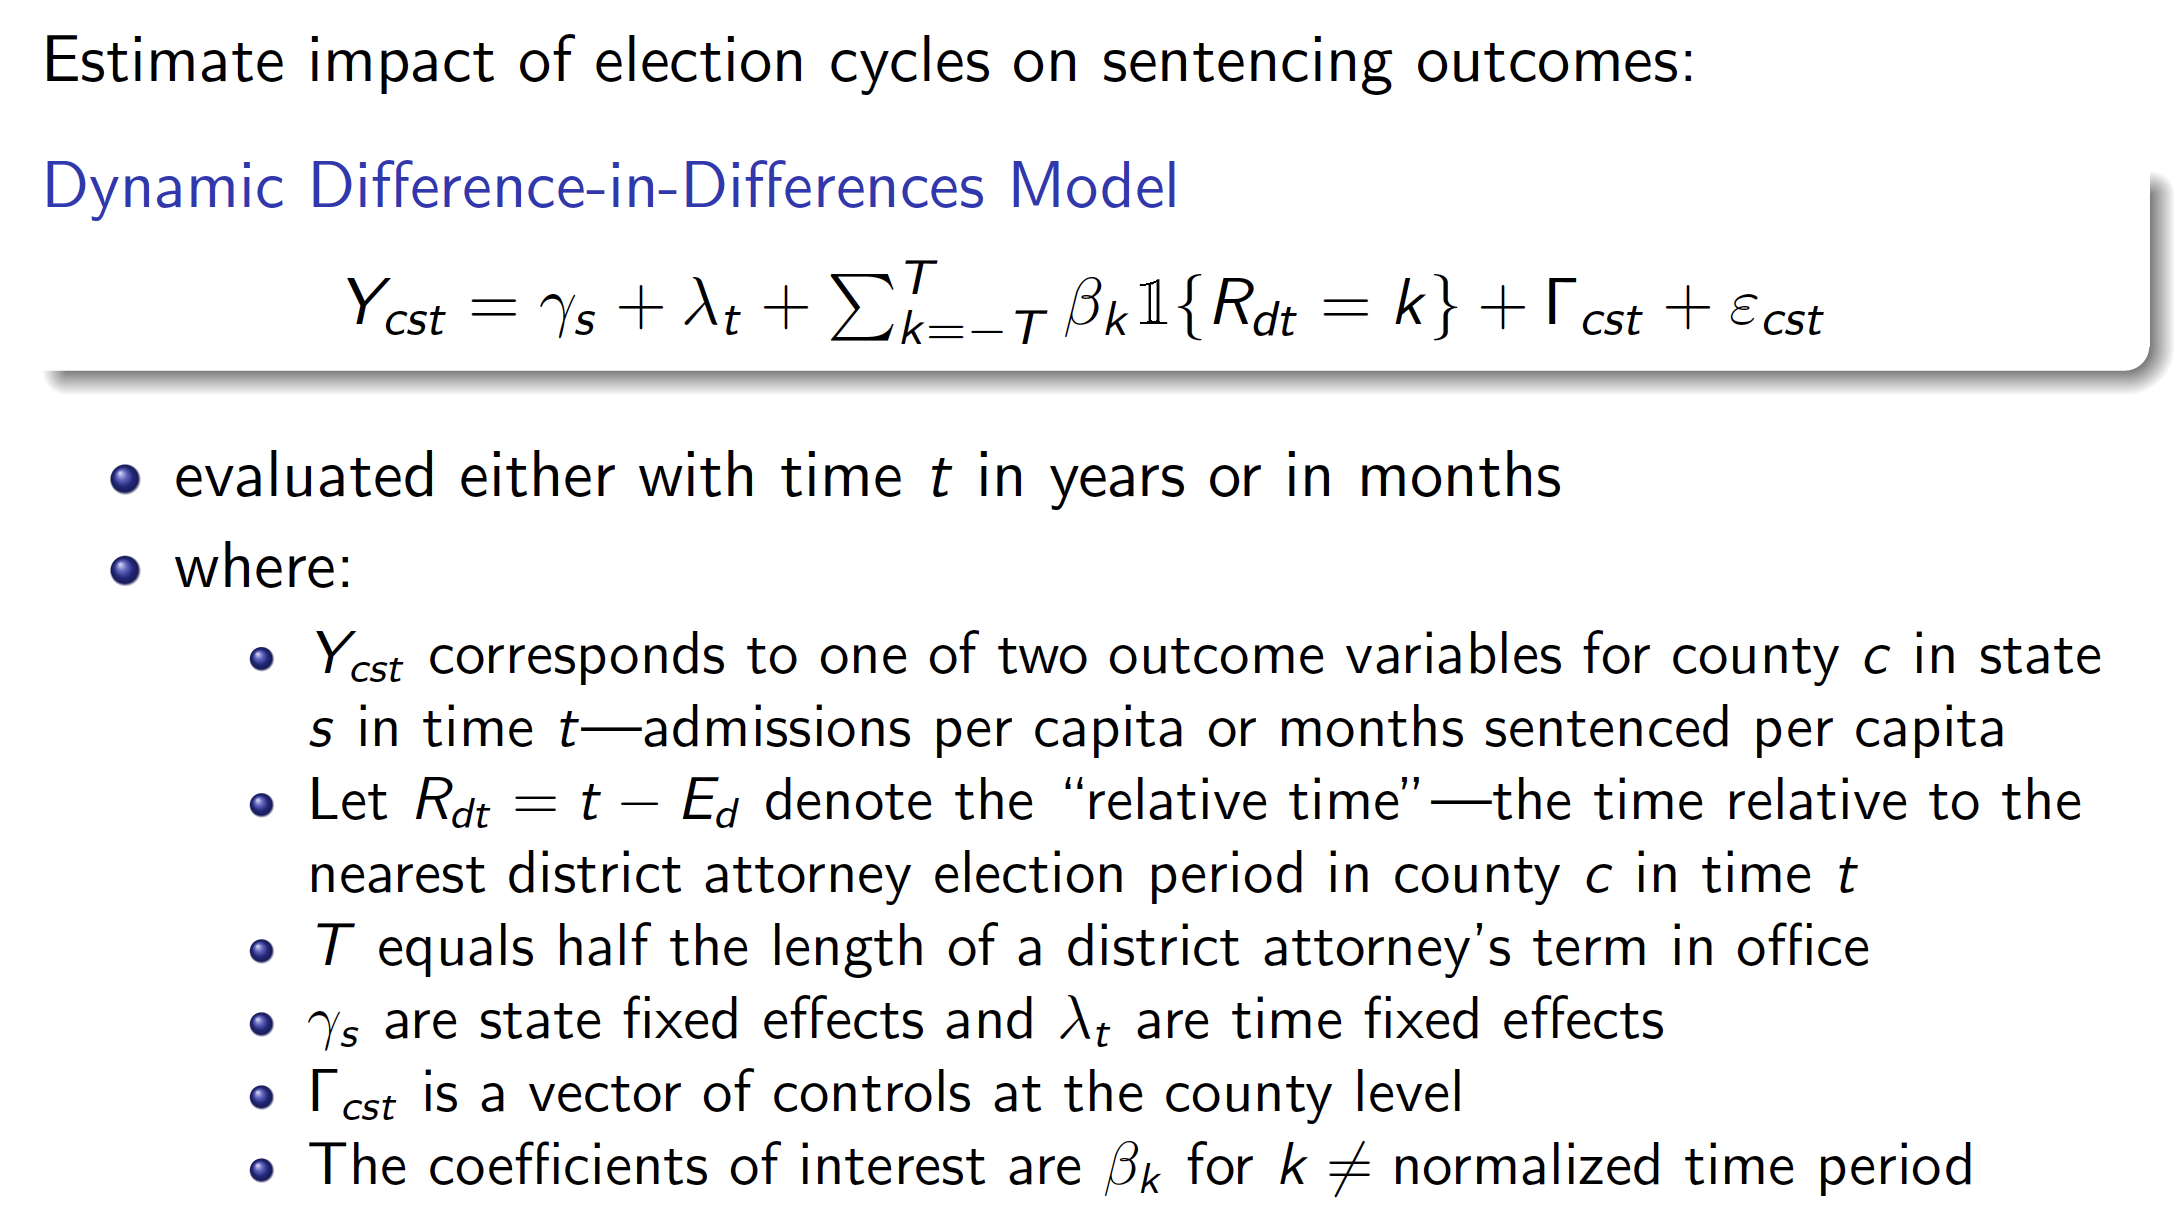
Slide 9
* replace with video from smith center of chika working
Slide 10
* ~~invert [image](https://drive.google.com/file/d/1HJO4vmFIXOmDW8xe2S1W99PArZULccAQ/view?usp=sharing) to be white lines on black background. [csv](https://drive.google.com/file/d/1WPoFNWq5R5BfPoGaDD3N2Df0cb_g2v6h/view?usp=sharing)~~
* ~~have blue line, vertical 0 doted line, and pink dots (maybe dots wipes from left to right) fade in independently on clicks~~
* ~~highlight vertical line , mabe with call out "time of election"~~
* ~~fix postion/duplication of equation~~
Slide 12
* invert to black background [image](https://drive.google.com/file/d/1TedmePmyLzhj3c4hYKxVDrmcEFcFw583/view?usp=sharing) and [csv](https://drive.google.com/file/d/150l6yASTGlLwfrC2WgnoM9hWtgdzhA5R/view?usp=sharing)
Slide 13
* put a placeholder in for eventual visual.
* Chika will send over the ratio of black to white defendents, and then also the ratio of each colr gradation in legend for black defendents and for white defendents with
* chika will think on these visuals a bit more and we will come back to it--maybe with MK!
Slide 15
* ~~convert charts to white on black background~~
* ~~clean up graph overlay~~
Slide 16
* make it stronger--was running out of steam with keynote but wantst o convey something better
Slide 17
* add a bleach bypass filter maybe
### 20220311
connect clock to montage: start with presidnet and rewidn back in time to raegen.
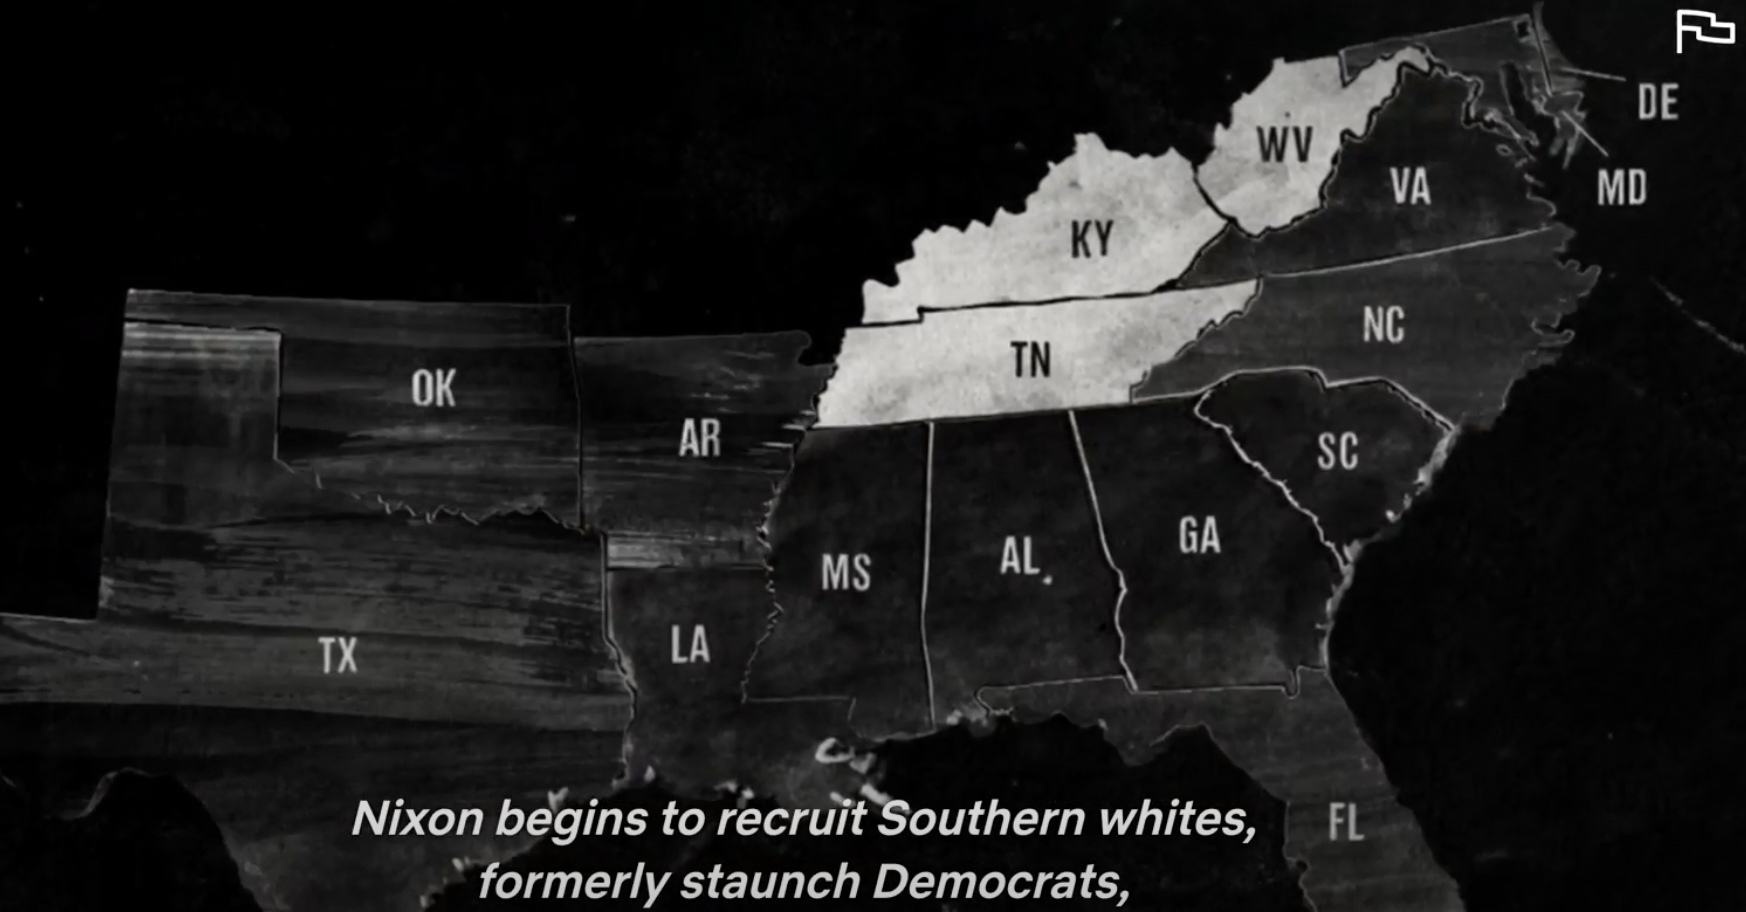
larger map
second montage: headline sof laws, then lots of people together doing activism (like BLM march) LAWS v. Communal Project
first montage: leaders signing bills.
get video of first talk--grab vo of that to get timing of montage 1 & 2.
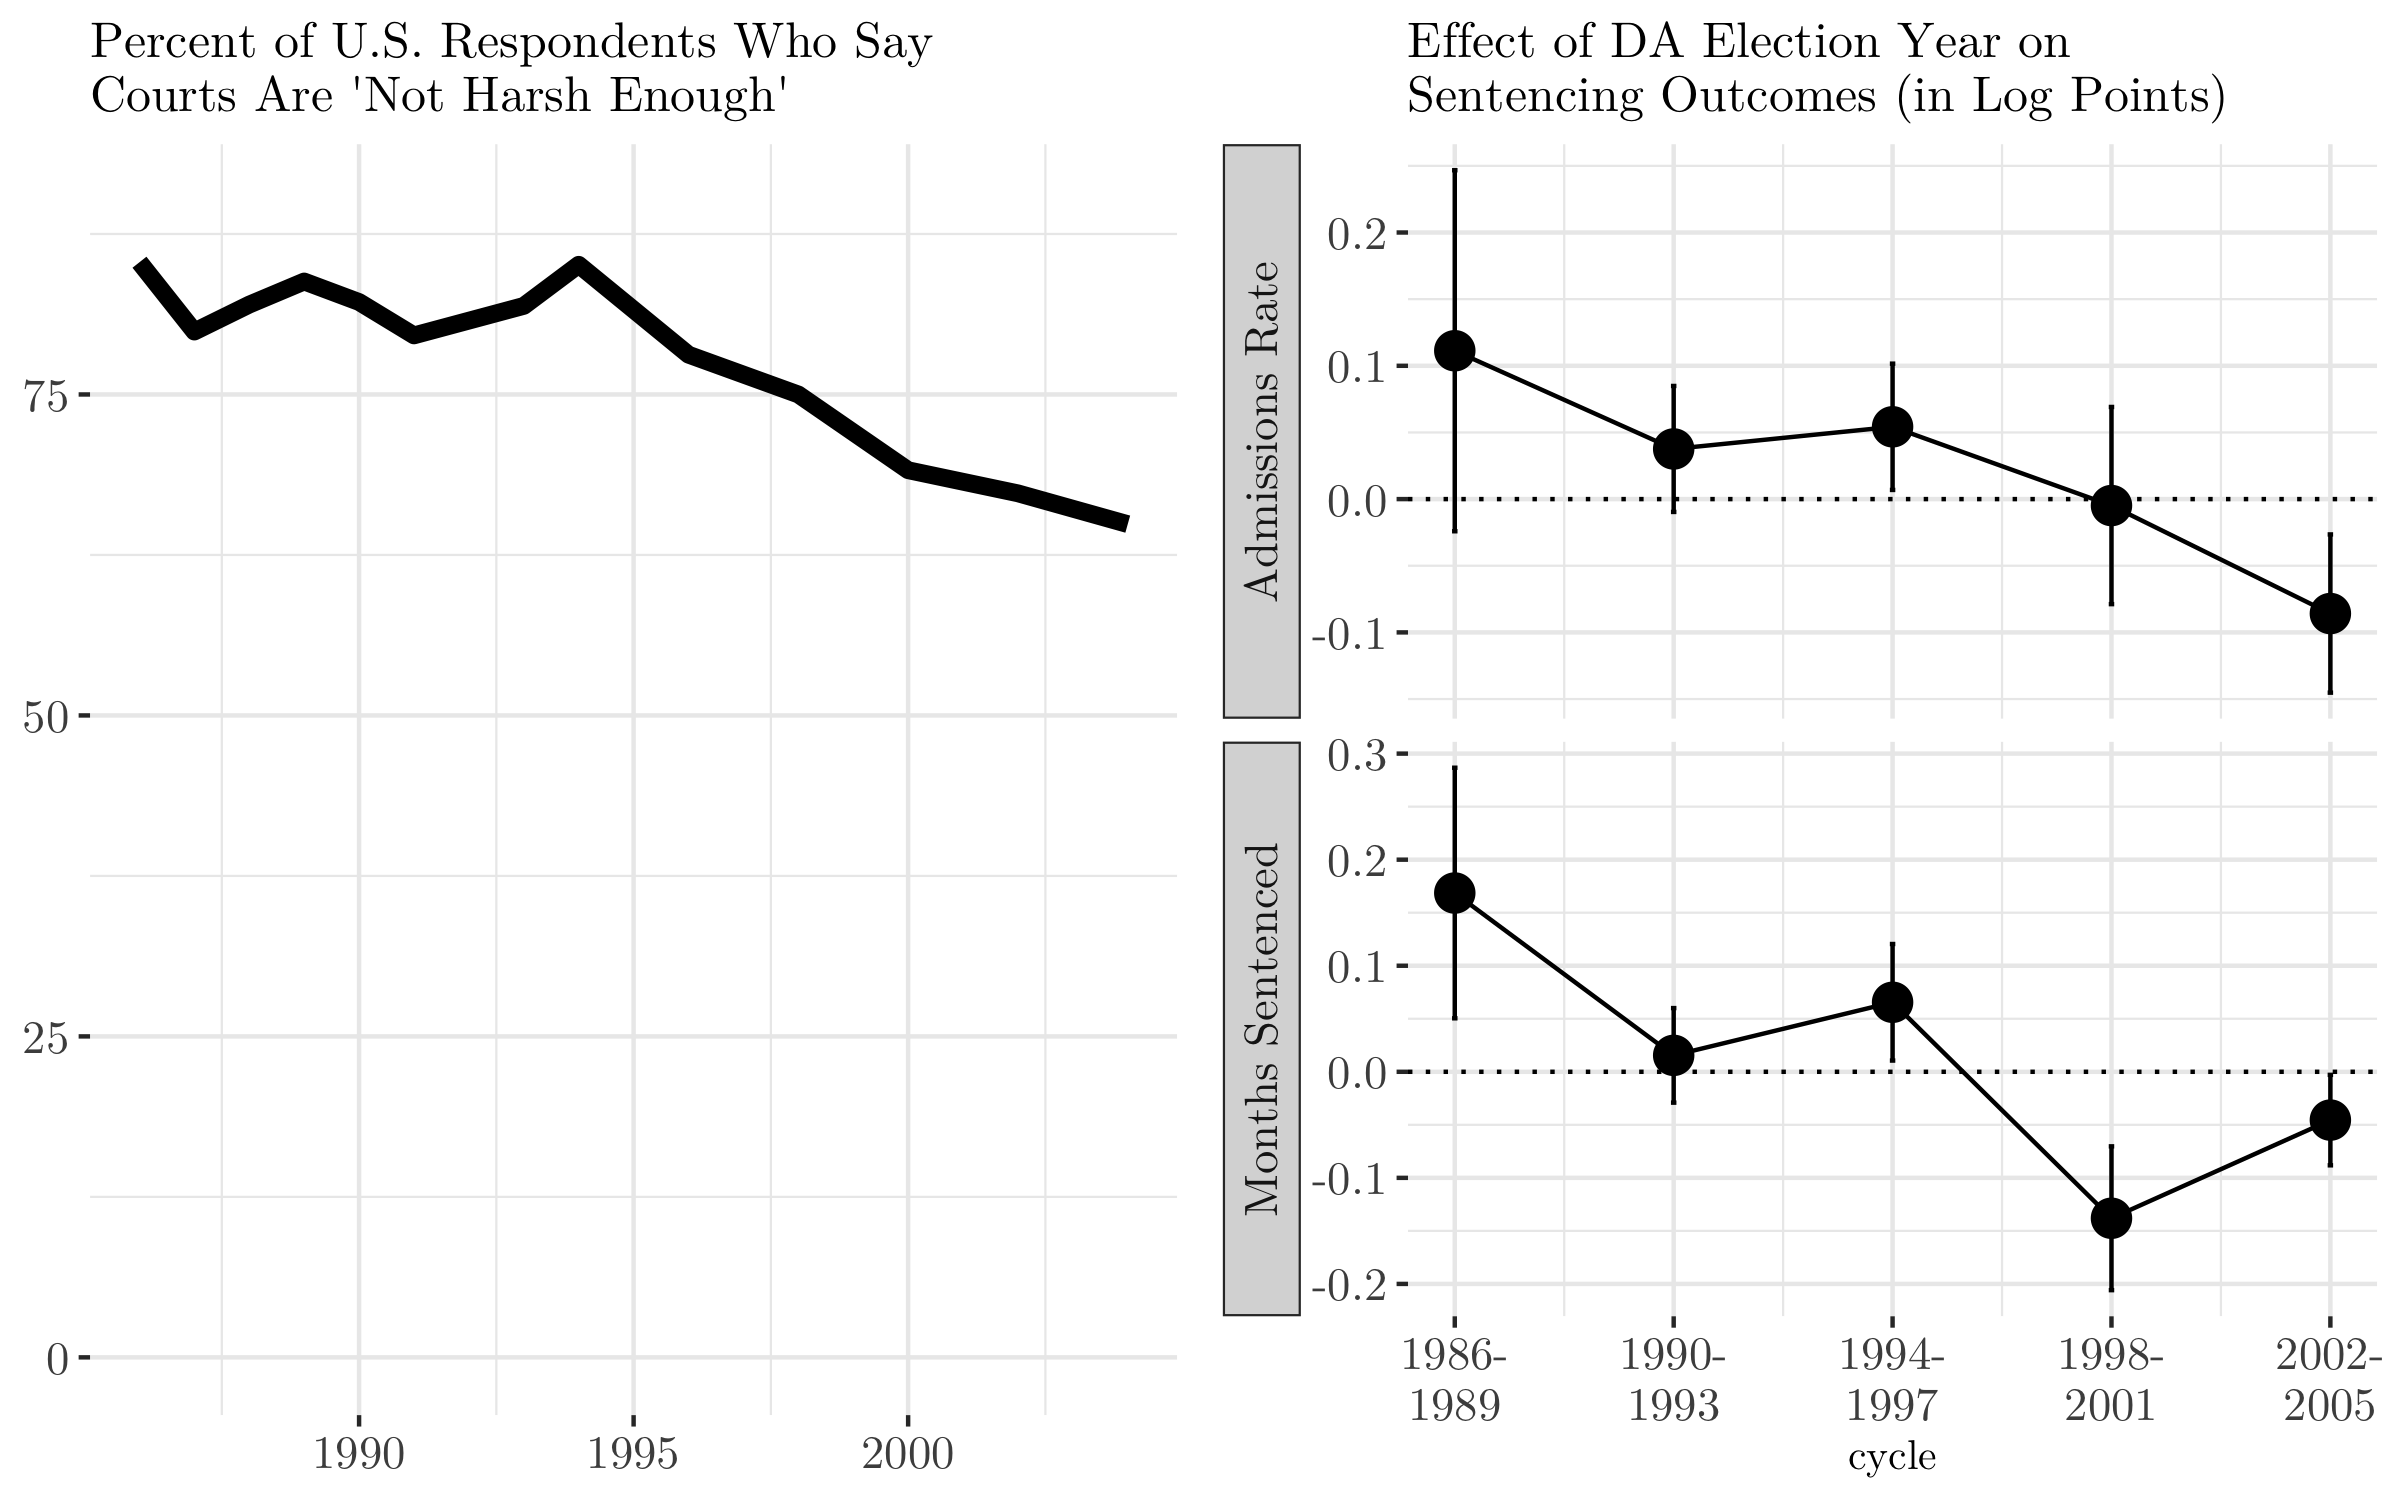
Slide 11
* ~~election line first~~
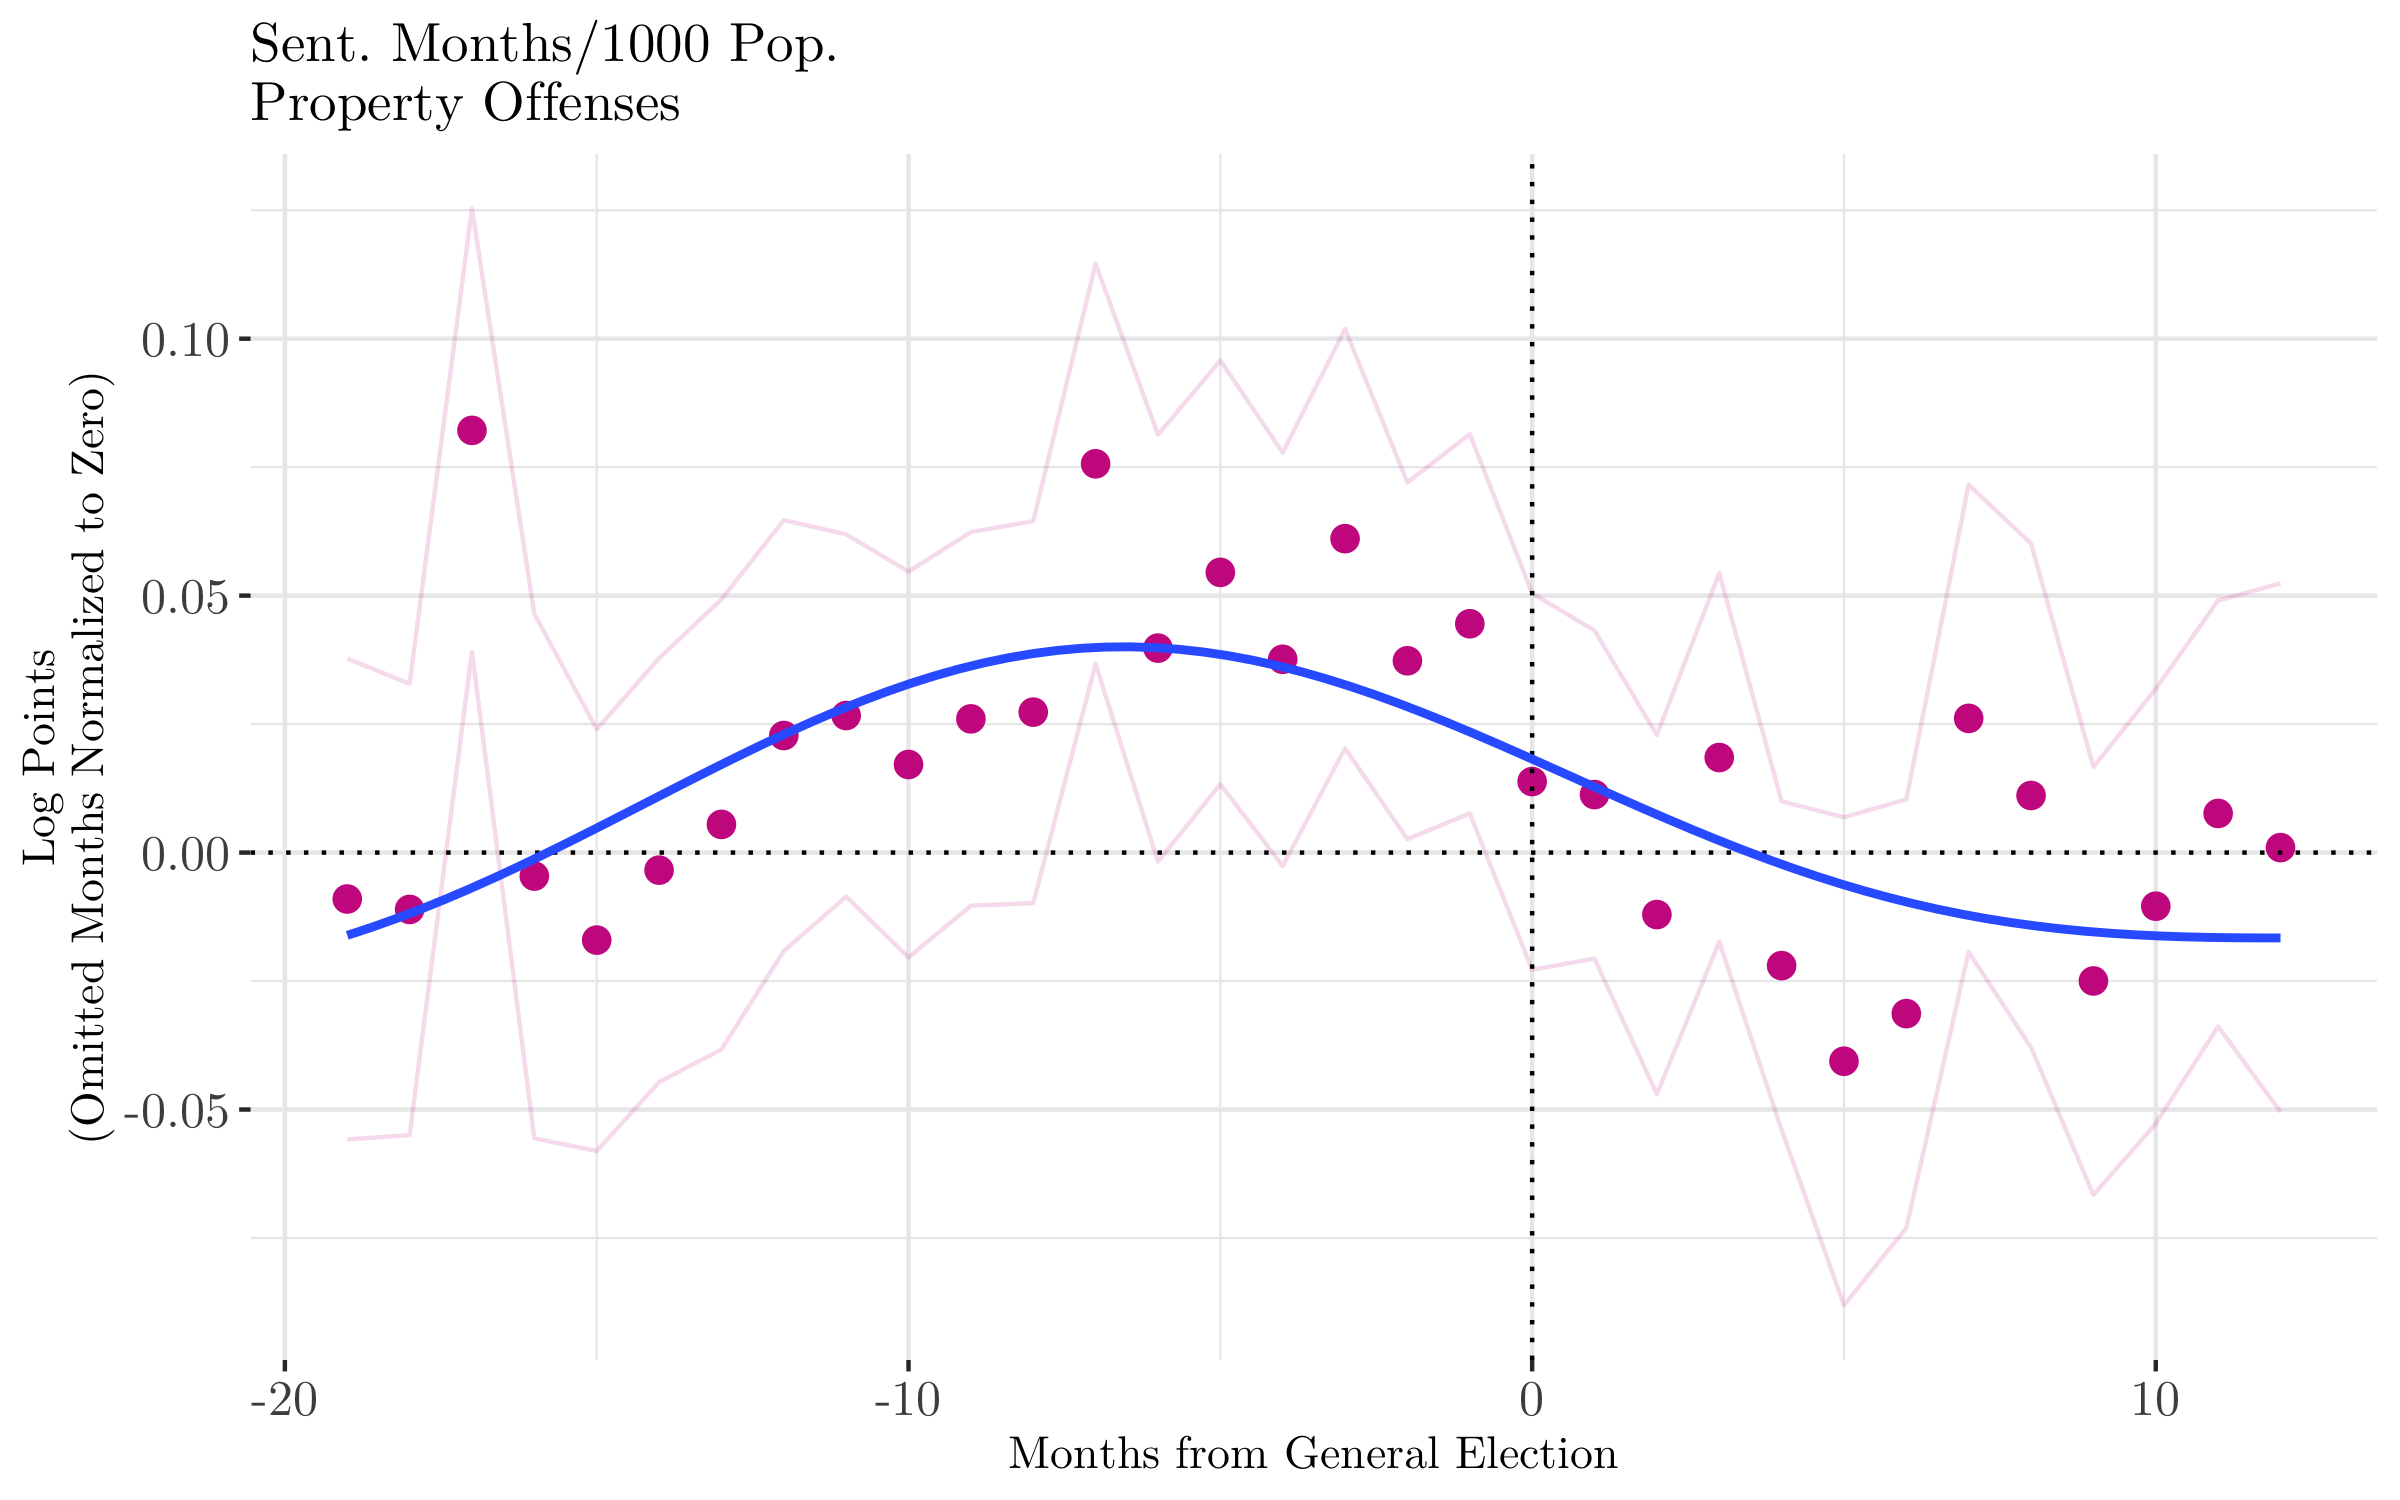
* ~~include stat lines~~ stat-lines-prop-mo_0318
Slide 12
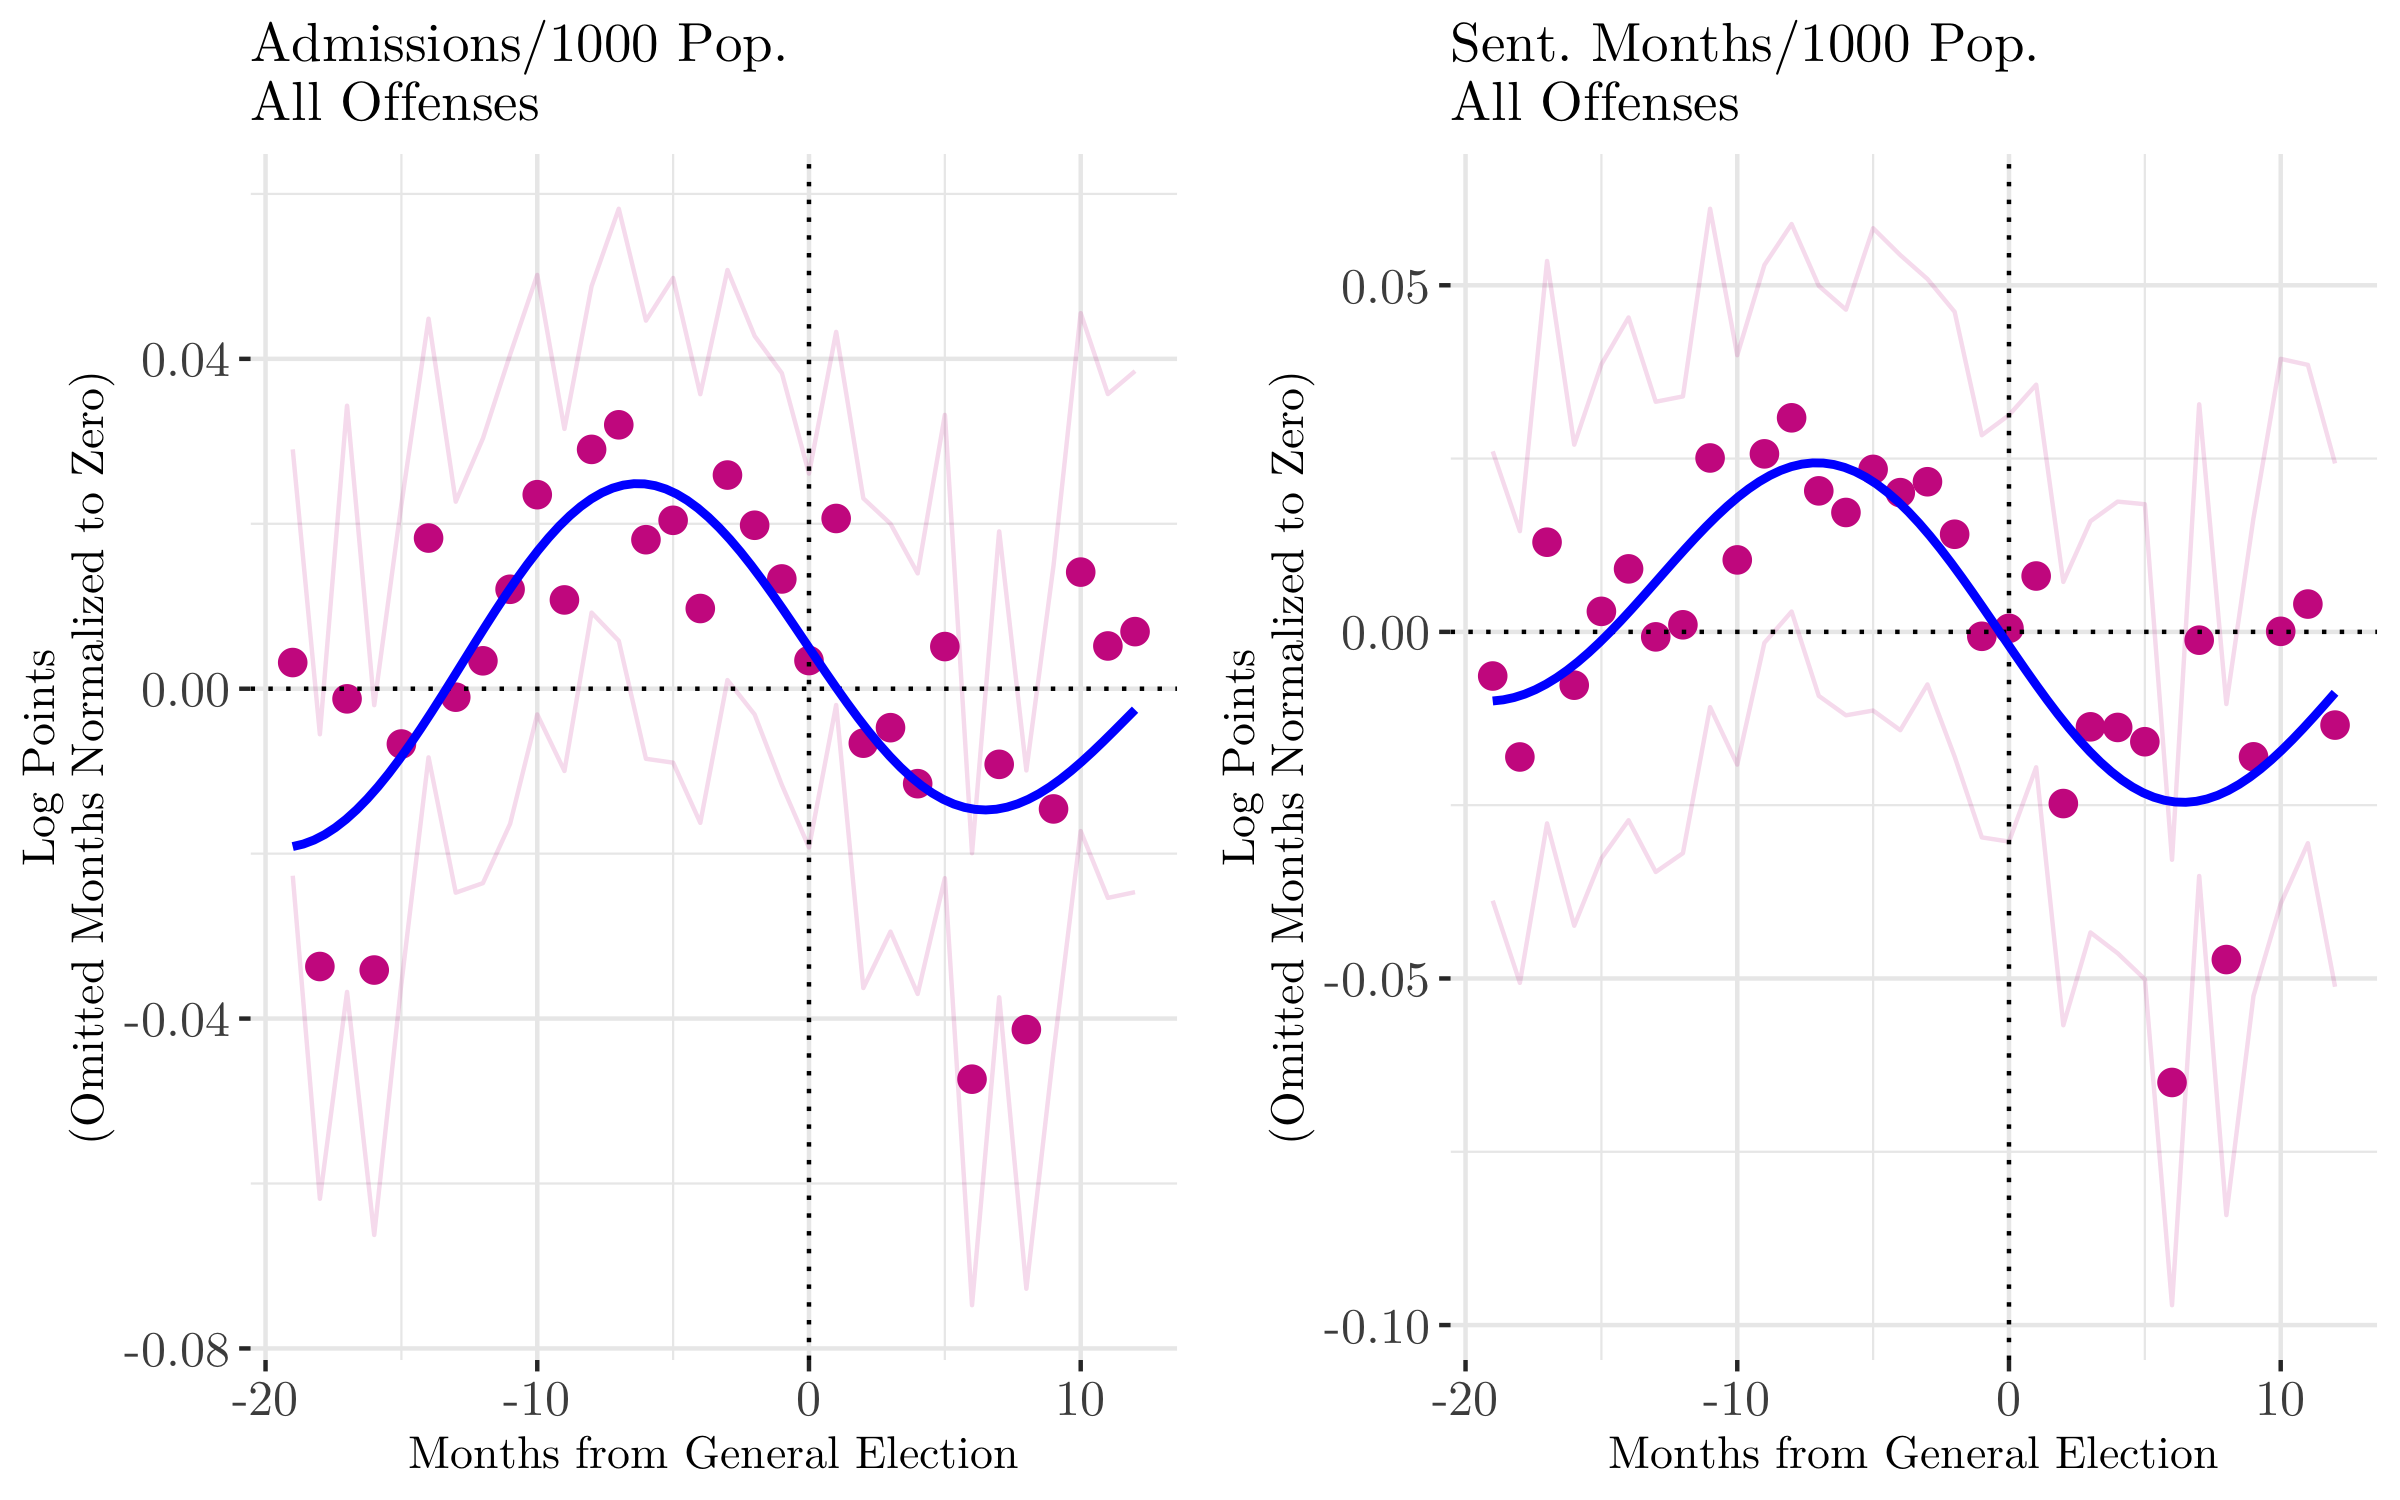
* ~~rebuild two charts as static images~~ admissions-graph + sent-mo-graph
* ~~include stat lines~~
Slide 13
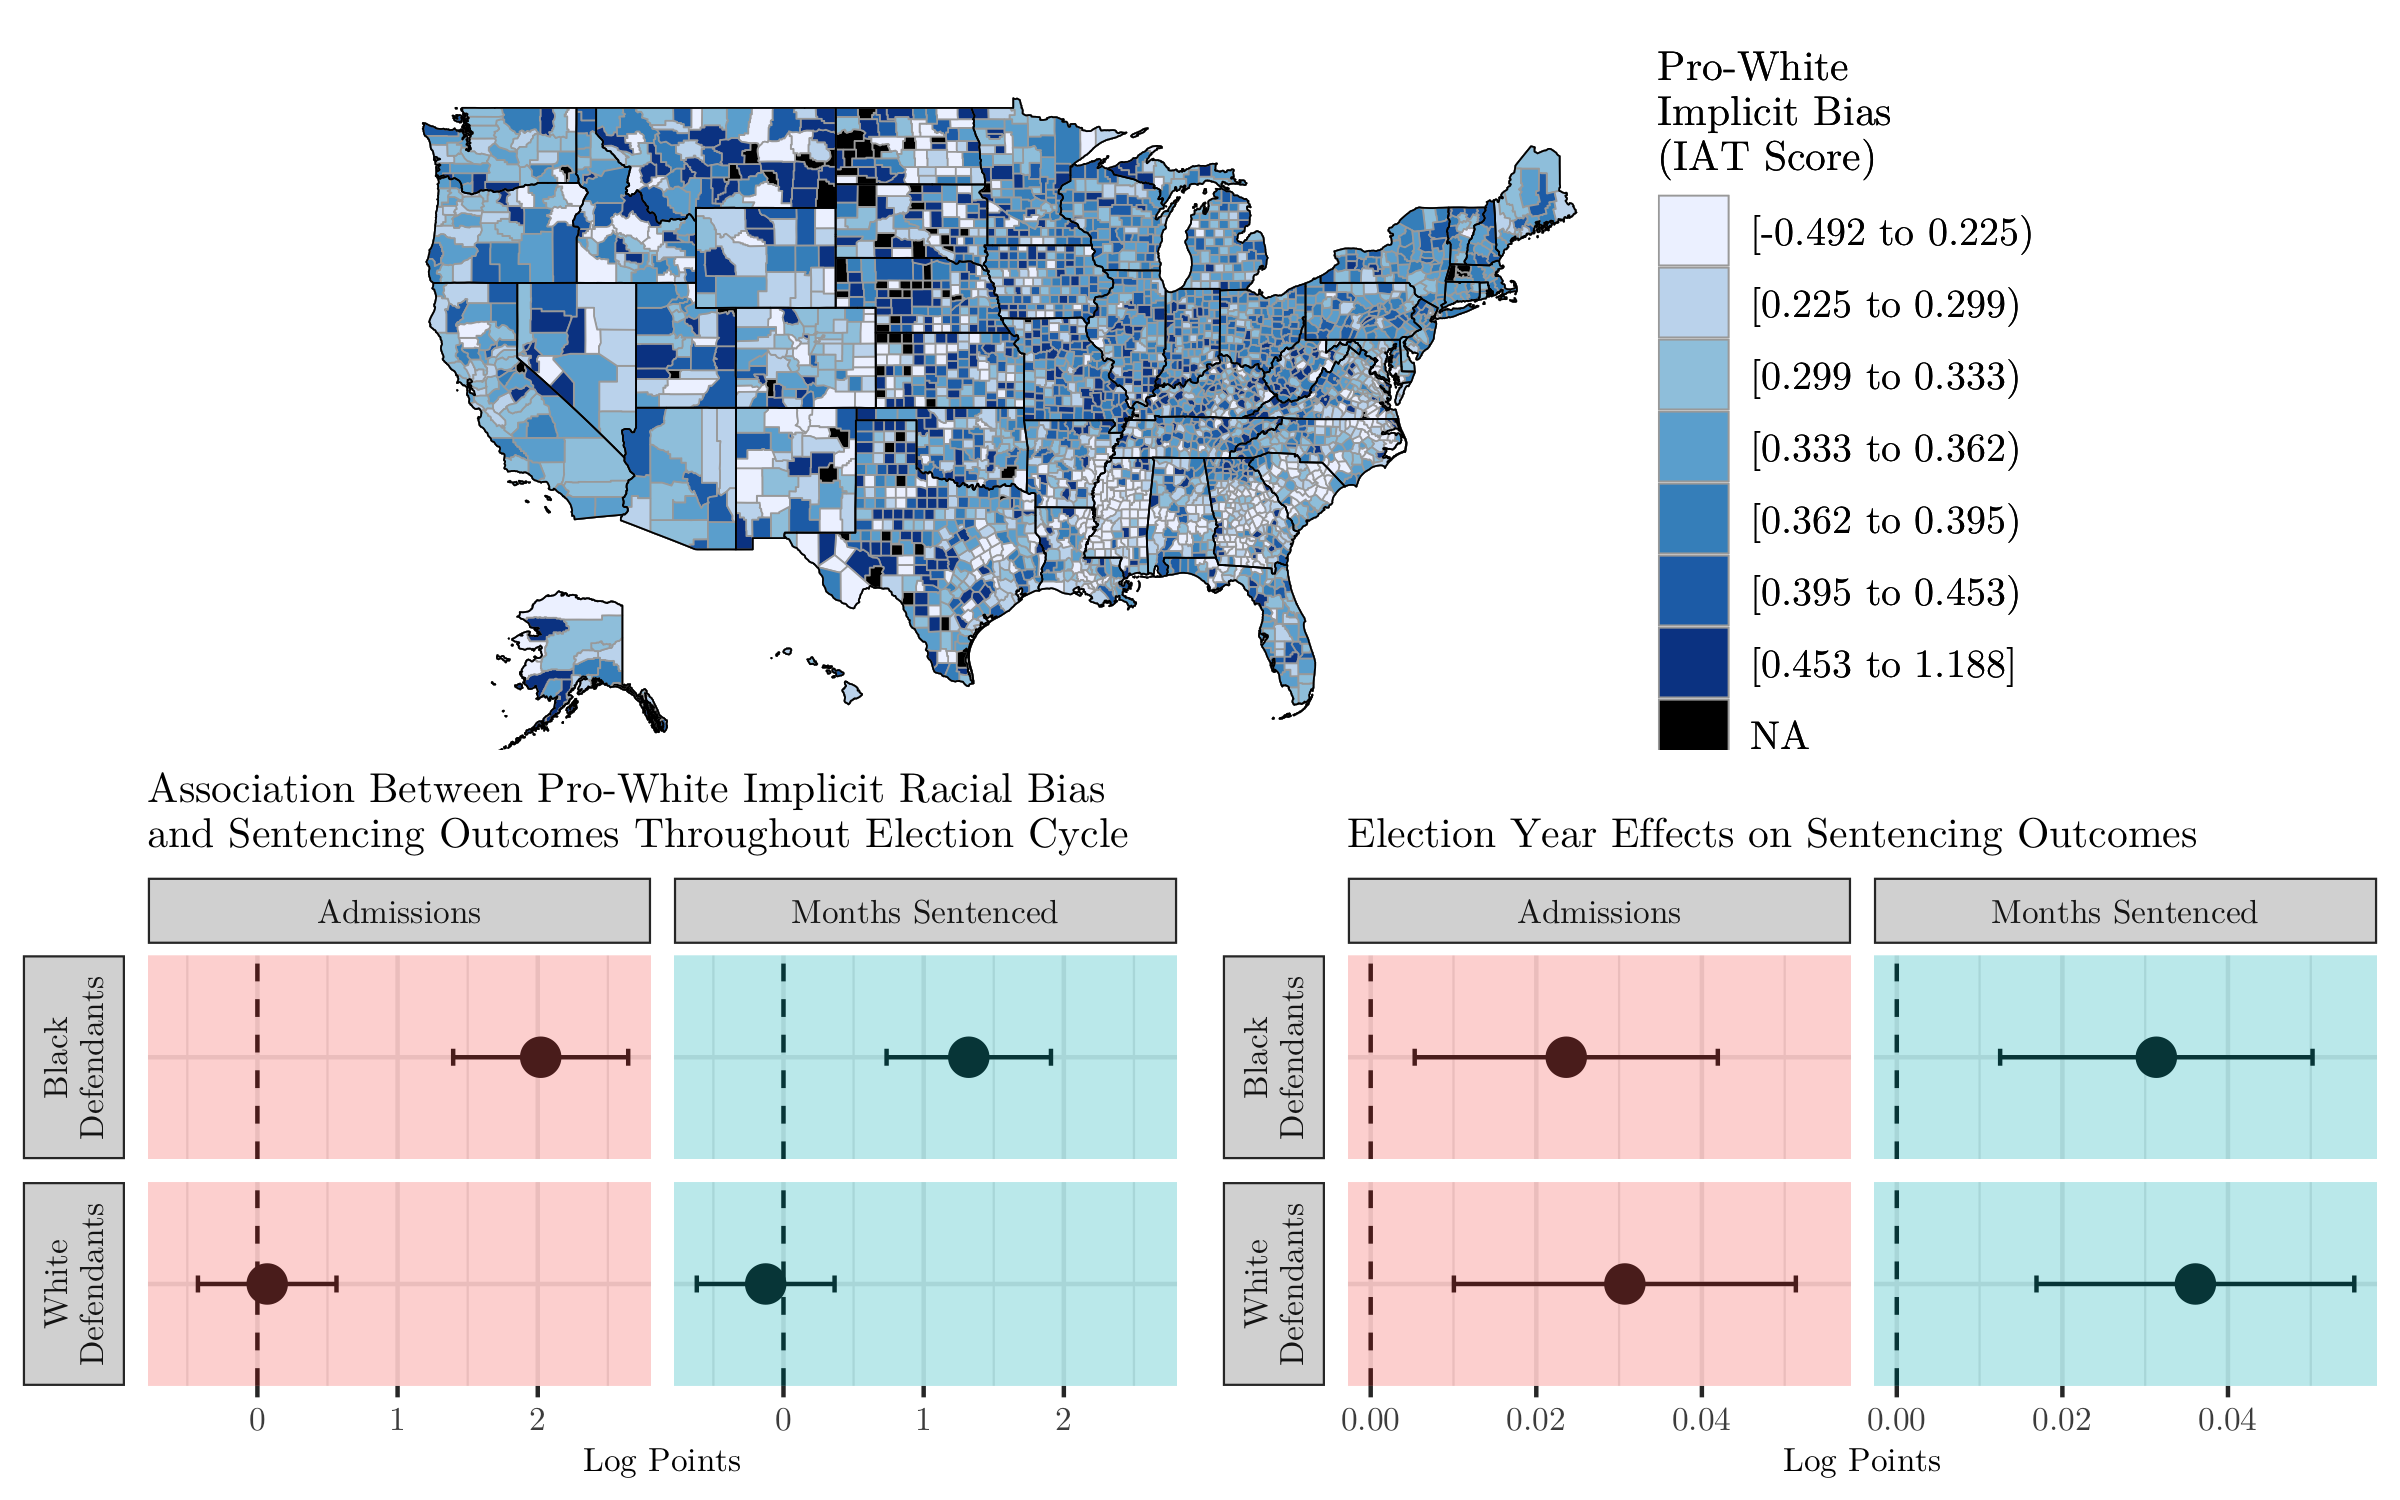
* ~~rebuild~~ implicit-map_0318 and implicit-map-key_0318
* ~~NA diagonal lines, try to rebuild in R?~~ Chika rebuilt in R and exported as red with NA as grey.
Slide 14
* MK & JK brainstorm how to visualize this, but for sure swtich White and Black, and think about
* color selection mask
* after effects
* abstract sample counties (as boxes)-to rep low and high leve bias
* map in middle and two country boxes on either side, then map reced into background once graph fills in
New slide! (for election effects)
* use adm pres consolidated chart (rebuild)
Slide 16
* make red lines as thick as blue
* increase transparency of grid lines
wait on last slide edits for now (until after montage, becasue might end on final image of video)
for Tuesday shoot:
* try for outdoor location (need to do a little scouting, maybe bbq place, outside smith center)
* est shot of him walking and sitting down and setting up.
# Packaged Instructions for Montage:
## What: 3 total montages.
### 80's-90's Montage
a "rewinding back in time" montage. The idea is to start with the president and rewind back in time to reagen as Chika talks about
* [Link to 80's90's Montage visual models](https://drive.google.com/drive/folders/17PG_upZOej93lx8zNkyr1cPNfK8S99T_?usp=sharing)
### Justice Reform Montage
* [Link to Justice Reform Montage visual models](https://drive.google.com/drive/folders/1Lf5-c6eWHDfAAXS3kV8fNrTImP6GZsG2)
### Chika at Work Montage
* for Tuesday shoot:
* try for outdoor location (need to do a little scouting, maybe bbq place, outside smith center)
* est shot of him walking and sitting down and setting up.
## 20220322 Walkthrough
* First montage - Practice the section with the montage and let us know about the timing. We can cut things to match your speaker notes. Let us know anything that feels a bit off.
* Slide 3 US Prison Total
- [x] Work on the contrast between the grey and the "Steepest rise in US history"
- [x] Cheat the graph to the left so that the slide is centered
* Working montage
- [ ] Cut to what he's looking at on the look
* Econometric slide
- [x] Make the red of the dots a bit brighter - is the contrast high enough? Just the dots, not the line. Note that Sanders will be even LESS contrast-y.
- [x] Adjust the alignment of the graph. Choose one spot on the keynote where the graphs live.
- [x] Center the axis titles, Log points on the y-axis isn't centered with the line below it.
- [x] The title can stay left aligned, but make sure it matches throughout the presentation.
* admissions - 2 graphs side by side
- [x] However dots are handled in the previous slide, match them here
- [x] Vertical line for time of election for both graphs, should match previous graph
- [x] Y axis 0 should align at zero. X-ais put in a line at 0 (to represent)
* Map is still in progress
- [x] Start with the map
- [x] Dots representing racial makeup of the US (7 white people for 1 black person)
- [x] Dots representing that the prison population is equal
- [x] 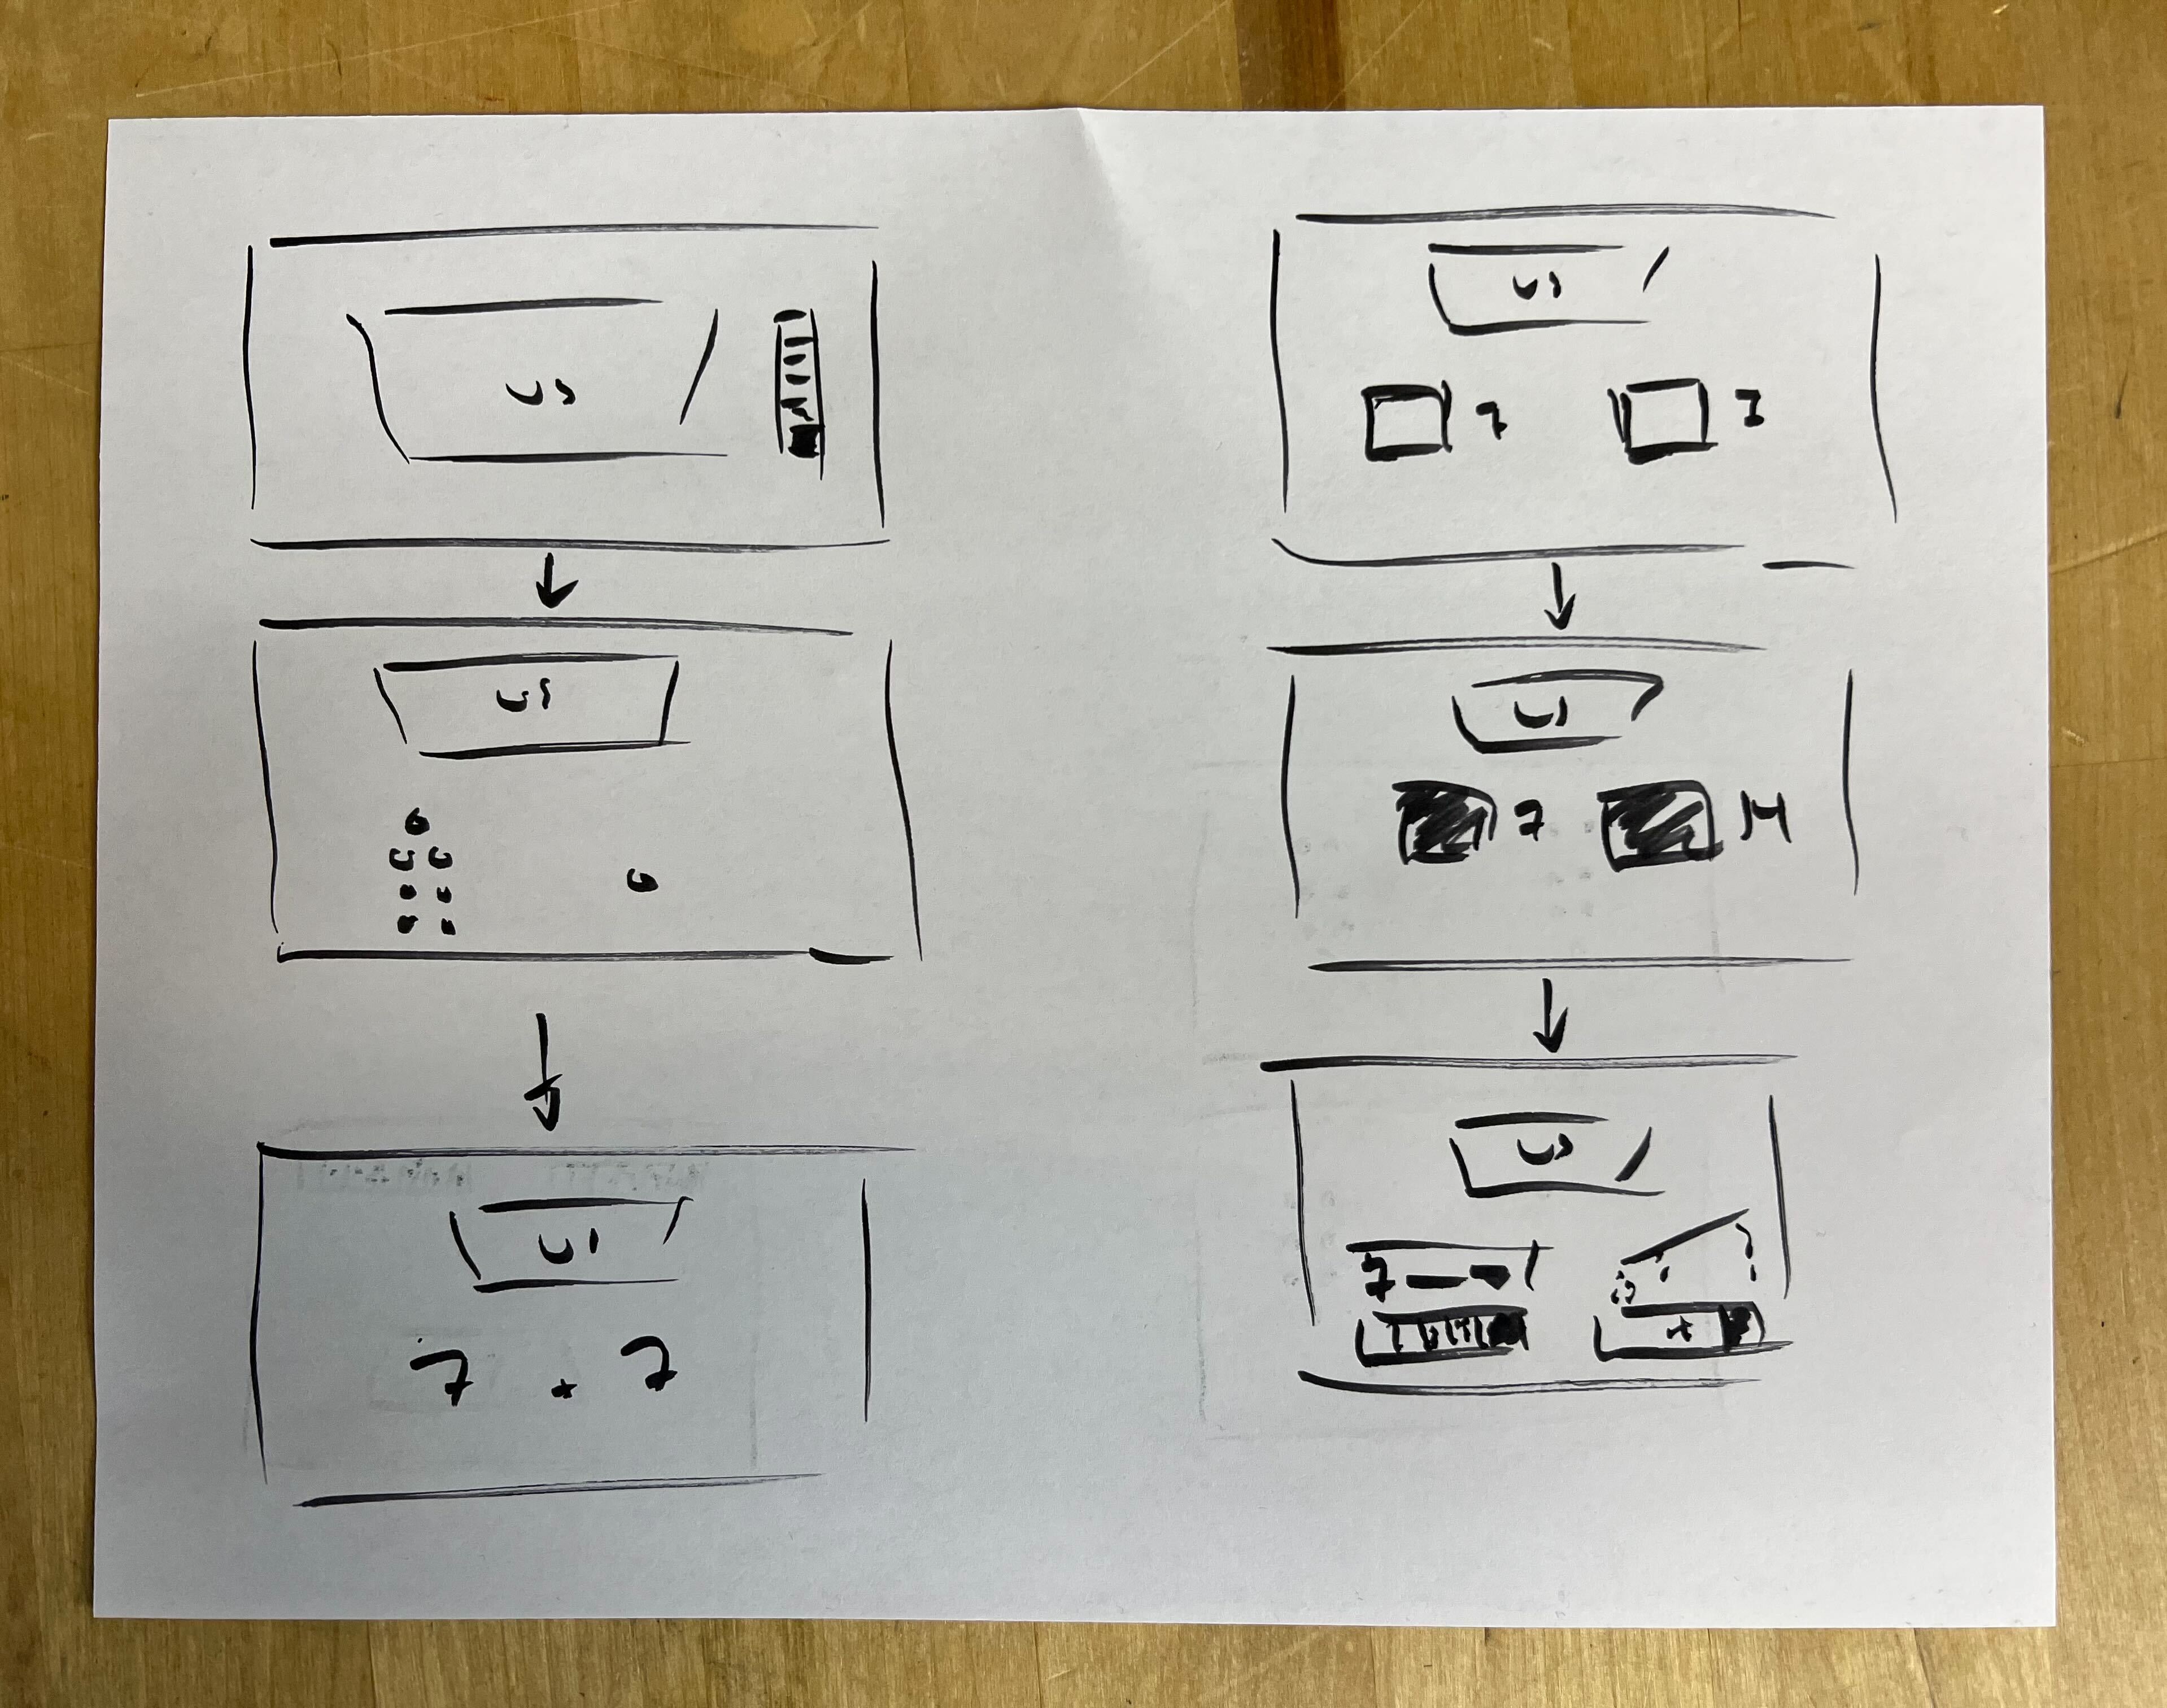
* Election effects - After this slide there would be a slide that covers the election effects of black and white defendents.
- [x] Now returning to election effects, for both black and white defendents there is an election effect.
- [x] [the graph to rebuild](https://drive.google.com/file/d/1szycvYaV1Q1BVczmdPpJTtqZGASsT7N-/view?usp=sharing)
* Final montage
- [ ] Use the same timeline graphic from before, but this time forward it to the present
- [ ] Hold on the flag for a while. Make sure the slide ends on that video so that is goes to black on a push.
 Sign in with Wallet
Connect another wallet
Sign in with Wallet
Connect another wallet