---
title: Parallel & Distributed Computer Systems (Jan 26, 2022) Exercise 4
---
# Bring Your Own Project
Propose a project of your own, or from another class or hobby of yours.
But it has to be non-trivial and I have to agree to it.
# Help Us on Our Own Project
Help us port [FGLT](https://github.com/fcdimitr/fglt) to Julia, using Base.Threads, [CUDA.jl](https://github.com/JuliaGPU/CUDA.jl) and [distributed computing](https://docs.julialang.org/en/v1/stdlib/Distributed/) to demonstrate that pure Julia can be as good as or better than OpenCilk with MPI and CUDA.
Let us know if you are selecting this project, to coordinate the effort from the beginning.
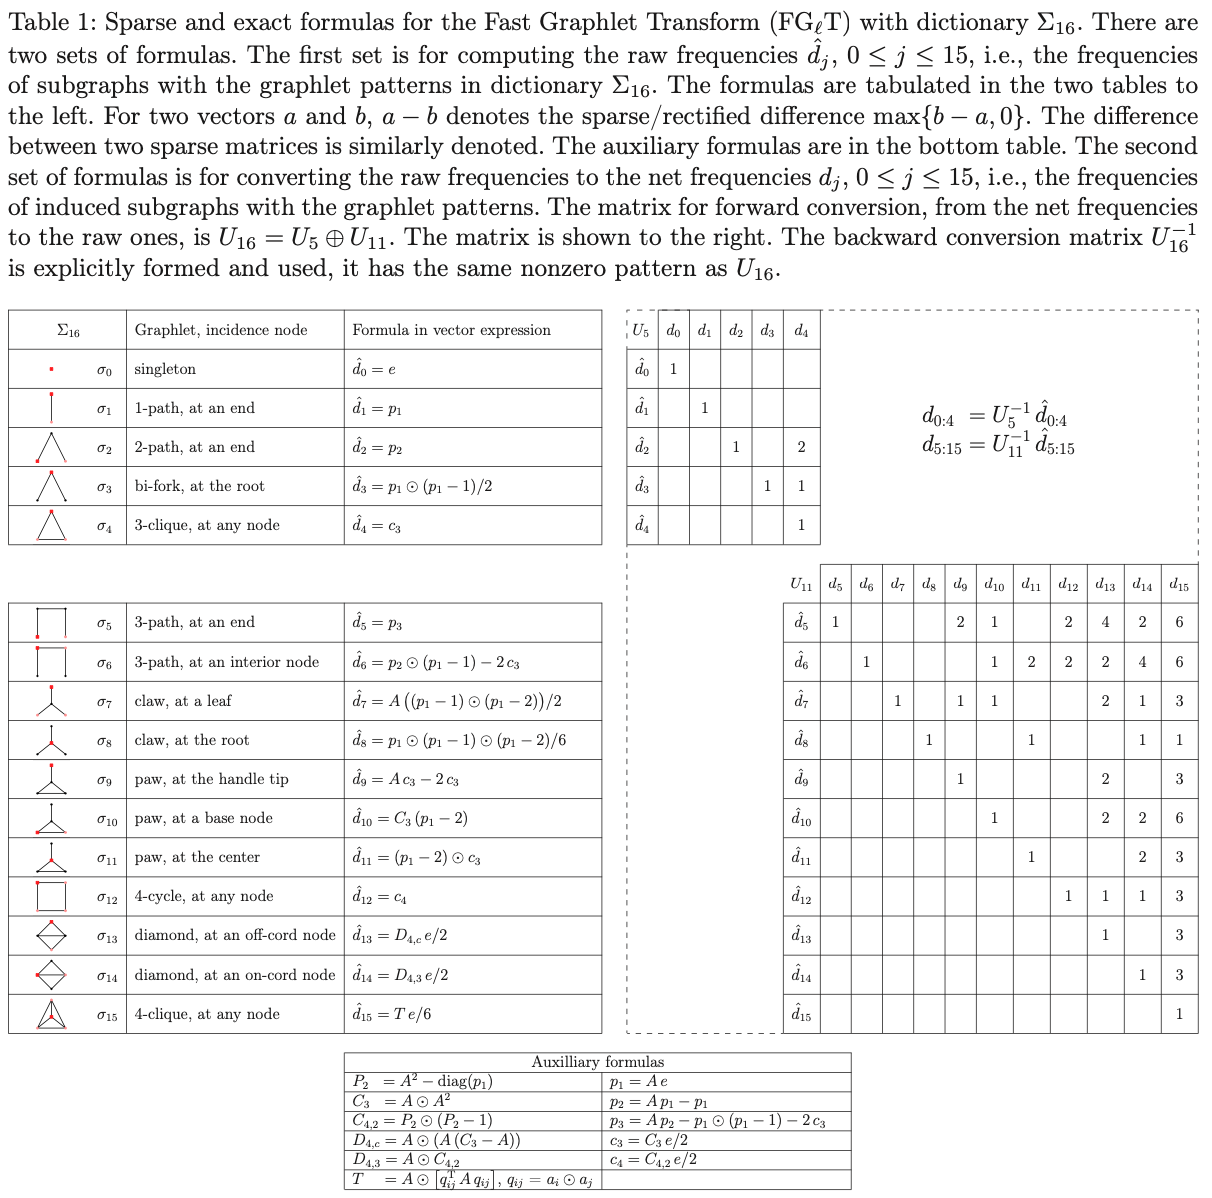
`FGlT` is a C/C++ multi-threading library, for Fast Graphlet Transform of large, sparse, undirected networks/graphs. The graphlets in dictionary Σ16, shown in Table 1, are used as encoding elements to capture topological connectivity quantitatively and transform a graph G=(V,E) into a |V| x 16 array of graphlet frequencies at all vertices. The 16-element vector at each vertex represents the frequencies of induced subgraphs, incident at the vertex, of the graphlet patterns. The transformed data array serves multiple types of network analysis: statistical or/and topological measures, comparison, classification, modeling, feature embedding and dynamic variation, among others. The library FGlT is distinguished in the following key aspects. (1) It is based on the fast, sparse and exact transform formulas which are of the lowest time and space complexities among known algorithms, and, at the same time, in ready form for globally streamlined computation in matrix-vector operations. (2) It leverages prevalent multi-core processors, with multi-threaded programming in Cilk, and uses sparse graph computation techniques to deliver high-performance network analysis to individual laptops or desktop computers. (3) It has Python, Julia, and MATLAB interfaces for easy integration with, and extension of, existing network analysis software.
More details in [the paper](https://arxiv.org/abs/2007.11111).
```
@inproceedings{floros2020b,
title = {Fast Graphlet Transform of Sparse Graphs},
booktitle = {{{IEEE High Performance Extreme Computing Conference}}},
author = {Floros, Dimitris and Pitsianis, Nikos and Sun, Xiaobai},
year = {2020},
}
```
# Or Do This One
We will implement step-by-step a shared memory vantage point tree construction, given a data set of d-dimensional points $X$. The structure is used to perform the $k$ nearest neighbor search (kNN) of the points on the vantage-point tree as introduced in the publication:
> Peter N Yianilos, [Data structures and algorithms for nearest neighbor search in general metric spaces](http://web.cs.iastate.edu/~honavar/nndatastructures.pdf), In Fourth annual ACM-SIAM symposium on Discrete algorithms. Society for Industrial and Applied Mathematics Philadelphia, volume 93, pages 311–321, 1993.
The algorithm is based on a very simple idea: select a point as the vantage point, compute the distance of every point to the vantage point and split the points according to the median distance.
```matlab
clear
n = 100000; d = 2; % works for any d
X = rand(n,d);
% assume vantage point is the last one
% get squares of distances from it
d = sqrt( sum((X(1:n-1,:) - X(n,:)).^2,2) );
% and find the median distance
medianDistance = median(d);
% plot them to confirm
clf; hold on; axis equal
plot(X(d <= medianDistance,1), X(d <= medianDistance,2), 'r.')
plot(X(d > medianDistance,1), X(d > medianDistance,2), 'b.')
plot(X(n,1), X(n,2), 'bo') % vantage point
```
And then repeat the same on the inner and outer partitions until no point is left, to build a balanced binary tree.
```matlab
function T = vpTree(X)
% function T = vpTree(X)
% computes the vantage point tree structure with
% T.vp : the vantage point
% T.md : the median distance of the vantage point to the other points
% T.idx : the index of the vantage point in the original set
% T.inner and T.outer : vantage-point subtrees
% of a set of n points in d dimensions with coordinates X(1:n,1:d)
%
T = vpt(X, 1:size(X,1));
function T = vpt(X, idx)
n = size(X,1); % number of points
if n == 0
T = [];
else
T.vp = X(n,:);
T.idx = idx(n);
d = sqrt( sum((X(1:n-1,:) - X(n,:)).^2,2) );
medianDistance = median(d);
T.md = medianDistance;
% split and recurse
inner = d <= medianDistance;
T.inner = vpt(X( inner,:), idx( inner));
T.outer = vpt(X(~inner,:), idx(~inner));
end
end
end
```
You do not need to follow the MATLAB implementation shown here, but make sure you understand all of the above and design tests to confirm correctness so that we can rewrite it in C and then parallelize it.
## 0. Implement the vantage-point tree in C (2 points)
Pay attention your implementation to be correct and efficient. Decide what needs to be copied and what can be done in place. Find the median distance using [Quickselect](https://en.wikipedia.org/wiki/Quickselect).
## 1. Parallelize your implementation on multicore CPUs (3 points)
There are two things you can do in parallel
1. compute the distances in parallel
2. compute the inner set in parallel with the outer set
We can also compute the median in parallel, using the exact same
techniques we discuss here, but it won't be as critical so you can
skip it.
## 2. Threshold the parallel calls (1 point)
Assigning too little work to be done in parallel will actually slow down your
computations. Modify your parallel implementation to switch to call the
sequential code after a certain threshold size. Also restrict the maximum number
of live threads to an upper bound. Experiment to identify the optimal threshold
value and maximum number of threads for your implementation and hardware.
## 3. Calculate the all-$k$-NN.
Calculate $k$ nearest neighbors of all points, with $k = 2^{[1: 8]}$.
## 4. Improve performance with MPI or CUDA
Extend your implementation to take advantage of either multiple CPUs with MPI or
GPUs with CUDA.
# What to submit
- A 4-page report in PDF format (any pages after the 4th one will not
be taken into account). Report execution time of your
implementations with respect to the number of data points $n$ and
the number of dimensions $d$.
- Upload the source code on GitHub, BitBucket, Dropbox, Google Drive,
etc. and add a link in your report.
 Sign in with Wallet
Connect another wallet
Sign in with Wallet
Connect another wallet