# ELIXIR Machine Learning & Biostatistics lesson Hackathon
## Day #1 - Monday October 12th
### Sign-In
Name / Location (Timezone) / GitHub (gh) username / Twitter (tw) handle
- Fotis Psomopoulos / Thessaloniki, Greece (UTC+3) / gh: fpsom / tw: fopsom
- Wandrille Duchemin / Basel, Switzerland (UTC+2) / gh: WandrilleD
- Van Du T. Tran / Lausanne, Switzerland (UTC+2) / gh: vanduttran
- Vojtěch Spiwok / Prague, Czech Republic (UTC+2) / gh: spiwokv / tw: spiwokv
- Shakuntala Baichoo / University of Mauritius (UTC+4) / gh/tw: ShakunBaichoo
- Claudio Mirabello / Linköping, Sweden (UTC+2) / gh: clami66
- Carles Foguet / Barcelona, Spain (UTC+2) / gh: cfoguet
- Alireza Khanteymoori / Freiburg, Germany (UTC+2) / gh: khanteymoori / tw: khanteymoori
- Klara Kuret / Ljubljana, Slovenia (UTC+2) / gh: kkuret
- Janez Lapajne /, Slovenia (UTC+2) / gh: janezlapajne
- Bengt Sennblad / Uppsala University, NBIS / gh: bsennblad
- Alexandros Dimopoulos / Athens, Greece (UTC+3) / gh: alex-dem
- Victoria Dominguez Del Angel / CNRS, Versailles, France (UTC+2) / gh: vdda / tw: vic_bioinfo
- Marko Vidak / Ljubljana, Slovenia (UTC+2) / gh: markowhatever
- Pedro L. Fernandes (pfern@igc.gulbenkian.pt) / Oeiras, Portugal (UTC+1)/ gh: pfern and gh:bicourses / tw: pfern
- Tom Lenaerts / Brussels, Belgium (UTC+2) / gh: tlenaert / tw:tlenaert
- maja.zagorscak at nib.si / Ljubljana (CET) / zagorGit / -
- Anmol Kiran / Blantyre, Malawi (UTC + 2)/ gh: codemeleon/ tw:AnmolKiran
### Logistics
- Zoom URL: https://us02web.zoom.us/j/81069686116?pwd=dFdRVkVSeEk0RW81M1NvWXIwUmVQQT09
- Lesson repository: https://github.com/fpsom/elixir-ml-biostats-hackathon
### Schedule
- 08:45 CEST (zoom session starts)
- __09:00 CEST 2020-10-12__: Start
- 09:15: Introduction to Reverse Instructional Design
- 09:45: Discussion and planning
- 10:00: Lesson development
- 10:45: Break part 1 (individual)
- 11:00: Break part 2 (group)
- 11:15: Lesson development
- 12:00: [Lunch] Break (individual)
- 13:00: Report out & discussion (recorded)
- 13:15: Lesson development
- 14:30: Break part 1 (individual)
- 14:45: Break part 2 (group)
- 15:00: Lesson development
- 15:30: Report out & discussion (recorded)
- 16:00: Wrap-up time
- 17:00: End of day 1
### Relevant Links:
- Markdown cheatsheet: https://github.com/adam-p/markdown-here/wiki/Markdown-Cheatsheet
- The Carpentries Instructor Training curriculum: https://carpentries.github.io/instructor-training/
### Introduction to Curriculum Development
### Audience Definition Questions
(From The Carpentries Curriculum Development Handbook.)
1. What is the expected educational level of your audience?
_Notes_:
- Researches with basic statistical and programming knowledge (and life sciences background)
- Phd/POstdoc~~, maybe PIs.~~ Usually biology or medicine background with limited math/stat and ~~no~~ programming experience. (There are exceptions -> this will not work!)
- PhD students and PostDocs with minimal litteracy in the usage of CS
- Biologists that understand that the the need for ML exists but have not started anything
- Researchers wanting to apply ML efficiently/reasonably with their life sciences data
- They have a basic or intermediate skill in programming.
- They don't have any background in ML.
- Life science students who wants to apply ML as a **black-box** in their data analysis workflow.
- life science graduates wanting to apply ML for data mining
- LS students who have basic understanding of statistics, have heard of Machine Learning but do not know what it is about
- <span style="color:black">*researchers who want to leave excel in the 'middle age'* </span>
- What about Bayesian stats?
**Key points**
- Researchers with basic statistical and programming knowledge (and life sciences background / biology or medicine background) - LS students / PhDs / Postdoc
- Question: limited or no knowledge in stats/programming
- Computer Scientists wanting to apply ML to life science
- ML as a black box or not (not means what?)
- Apply ML for Data Mining
- Researchers who work with small data (useless for ML) but want to be ready for big data (useful for ML) - mid-career people who want to move to the ML field
- awareness about data dredging: data fishing, data snooping, data butchery, and p-hacking
- it might be useful to have a profile that mentions both stats and ML
2. What type of exposure do your audience members have to the technologies you plan to teach?
_Notes_:
- They have a basic understanding of R (know how to use tidyverse for example)
- They have a basic understanding of Python (know how to use numpy / pandas / scipy ) <- is this basic?
- Probably used some stat software (used by their supervisors:); some may have used R. some may have used SPSS, SAS
- Some exposure to coding in Python or R, C/C#/C++, Matlab, Wolfram Mathematica
- Life science Research, he produces important volume of data. He has un ICT platform, he has a basic knowledge on R and Python
- everyday work includes ml and statistics
- Audience should have a deep knowledge in the application area.
- Basic knowledge in statistics -- awareness about data dredging: data fishing, data snooping, data butchery, and p-hacking
- have performed some statistical analysis while working on a paper as directed by their supervisor
**Key points**:
**Aim for this**
- More programming-oriented lesson (e.g. tweaking/writing functions, explaining how this works, but not going into too much detail across all/many methods): +1 +1 +1 +1*+ +1 +1 +1 +1 +1 (can we call it algorithm oriented?) (+9)
**Not this one**
- More tool-oriented lesson (e.g. no coding, but more details across each methods / process and their respective parameters/advantages): +1(for a heavier focus on methods ; + this lowers the technical bar on coding) (+2)
- Basic understanding of the target programming language (open questions: which one, and how do we assess the "basic" understanding)
- Probably used some stat software
- Life science Research, he produces important volume of data. He has an ICT platform (unix server), he has a basic knowledge on R and Python
- Audience should have a good knowledge in the application area (domain).
- have performed some statistical analysis while working on a paper as directed by their supervisor, but have no clear background on the theory (c&p recipes)
> basic -- <span style="color:green">*running some script on Linux workstation for their analysis/article?* </span>
| Basic stat. and prob. topics | understanding of: |
| :------------------ | :---------------------------------------- |
| basic stat features & concepts| variance, mean, median, percentiles |
| | bias, CI, orthogonality |
| | permutation, combination |
| set | subset, partition |
| | union, intersect, complement, difference |
| | permutation, combination, cartesian product |
| probability | coin flipping/dice rolling, |
| | probability distributions |
| experimental design | sampling and subsampling, over and under sampling |
| | randomization, blocking, factorial experiments |
| stat tests | t-test, anova, non-parametric|
| | F-value, p-value, FDR|
| | confusion matrix, type I and type II errors |
| basic stat models | linear/polynomial/generalised/time series models |
| | Markov chain|
| supervised and unsupervised learning| classification vs regression vs |
| |clustering vs dim. reduction |
| dimensionality reduction | PCA, NMDS |
| | e.g. dont push PCA as clustering|
| data visualisation | what to and not to do |
| | e.g. [dynamite plots must die](https://simplystatistics.org/2019/02/21/dynamite-plots-must-die/)|

| linear algebra. topics | understanding of: |
| :------------------ | :---------------------------------------- |
| matrix | row/column matrix, triangular, identity |
| | multiplication, subtraction, composition, |
| | rank, inverse, transpose|
| determinant| |
| eigenvalue| |
| prog. | understanding of: |
| :------------------ | :---------------------------------------- |
| variable | declaration, definition; keywords |
| paths | full vs relative path |
| functions | including truth functions and recursions|
| loops | |
| libraries | packages, libraries, header files, sources|
| vignetes, manuals | |
| pipelines & log files | replicable & reproducible research|
| regular expression | |
3. What types of tools do they already use?
- R (beginner ~~to intermediate level~~) :+1::+1::+1::+1::+1::-1:(most other ML courses are already R-based, could be nice to have something python-based for complementarity)
- Python :+1::+1::+1:+1:+1:+1 +1:+1
- Galaxy :+1:+1:-1
- Also STATA, SPSS (among medical students) :+1:-1:-1
- excel / libre /calc ([fun fact - Why using Microsoft's tool caused Covid-19 results to be lost](https://www.bbc.com/news/technology-54423988)) :-1:-1 :-1:-1:-1: -1
- matlab :-1: :-1::-1::-1::-1::-1:
- mathematica :-1: :-1::-1:
- Weka :-1:-1:-1
- Knime :-1:-1:-1 :-1:
- Orange [Open source machine learning and data visualization](https://orange.biolab.si/) :-1:-1
- Linux command line : -1 :-1:
- Julia :-1:-1:-1
- Galaxy :+1:
are we using "+1" or thumbs up? thumbs up is :+1:
4. What are the pain points they are currently experiencing?
- They want to learn statistically sound methods to evaluate their data
- They do not know which statistical test could/should be applied depending on the type of experiment they are performing
- They don't know when data is "small" or "big" and what tool should be used for either
- Don't know how to apply Ml for data mining in their domain/field
- Don't know how to structure their data for ML application
- THey have never heard of Bayesian stats :P
- any extra knowledge wont hurt :wink:
Include in the new lesson
- basic statistics: :-1:
- distributions :+1: :+1: :+1: :+1:, tests :+1: :+1:, confidence intervals :+1: :+1:, confounding factors :+1::+1: :+1:; data preprocessing :+1: :+1: :+1: :+1: :+1: :+1:+1:
, (handling missing values :+1: :+1:, outliers) :+1:, linear algebra :+1: :+1: :+1::-1: this will frighten participants/to wide field,:+1: hypothesis testing : :-1: :+1: :-1: :+1: this is under _tests_ already; linear models :+1::+1::+1:
- Include only advanced stats :+1:
- bayesian :+1::+1: :+1: :+1: :+1: :+1::+1:
on example, not all of the theory (basic theory, becuase they likely don't have that:)
- Also adv frequentist meth (bootstrap, more advanced regularization etc.) :+1:+1: iterative random forests (e.g.), HMM (e.g.) Coalescence! Hierarchical models
- Not include any stats: :-1: :-1::-1:-1:
- Data & Results Visualization :+1::+1::+1: :+1: (including reproducible research -- _pipeline/log_) :+1:
**Key points**
- Life science students who are not familiar with ML and want to apply ML in their research.
- They don't have the theoretical background!! So they work from some learnt recipe used in their reserach group. +1 :+1: sounds like error propagation :smiley:
- They don't know which ML algorithm works best in which situation (based on data they have at hand) <span style="color:green">*Its not so much about the best, as about one that might or should not be used* </span>
- They do not know how to evaluate the quality of their ML procedure / results (linked to a lack of theoretical back ground)
- There are many tools available, difficult to chose some (R, Python, matlab?) <span style="color:green">*those are not tools*</span> -> they were defined "tools" above though
- They'd like to test out multiple models to evaluate the best case
- Some experience in statistics (possibly through a connected course), but will like a formal refreshment of the topics
5. What types of data does your target audience work with?
- Host-Pathogen interactions (and all other graph theory related aspects)
- Drug discovery and repurposing
- Precision OncoloIgy - drug targets
- etc
- data from plants
- images: from CCD to confocal/electronic microscopy/light microscopy, fluorometer
- protein folding, active sites, motifs, structure prediction
Provide profiles that use tabular data formats:
- multi-omics:
- RNA-Seq/Ribo-Seq,
- proteomics,
- metabolomics
- Precision Oncology
- Drug Discovery and Repurposing
- Clinical / phenotypic data :+1: (<span style="color:green">*could someone elaborate more on this?* </span>)
- Survival analyses - clinical and gene expression
- small data/big data
- high-throughput data including **curse of dimensionality ** high-dimensional data
<Suggestion>
We are working on profiling target audience(s). In between we were raising issues that clearly address Pre-requisites that are not uniformly applicable to all the target audiences that we discussed. I suggest that we separate the Pre-requisites away and from those select the ones that apply to our choice of thematic coverage ( More programming-oriented lesson)
</Suggestion>
### Learning Outcomes
### Lesson Structure
### Learner Profiles
#### Profile #1
(AD,AK,Anmol, CF, Gasper)
- who are they?
- Life science students (Msc, PhD, Postdoc ) with a basic knowledge about Data analysis, statistical modeling. Programming Knowledge is preferable but not necessary.
- what problem are they having?
- Programming problems (not related to the data science).
- Preprocessing: producing train and test data, data cleaning, extracting more relevant features.
- Visualization.
- Having global vision to the data (visualization, statistical measures analysis).
- Tuning the parameter and finding the best parameters which suit for their own data.
-
- how will the tutorial help them?
- They will have a basic and ML-related understanding of programming.
- They will know the steps of Machine Learning analysis pipeline.
- They can visualize the results and raw data.
- Feature engineering.
- How they can easily tune the parameters for used model (hyper parameter optimization).
- ML measures to interpret their results.
#### Profile #2
(Bengt, Klara, Janez, Marko V.)
- who are they?
- Life scientists, level of phD-student and postDoc, with basic knowledge of statistics and of programming in the relevant language. They don't necessarily know much ML.
- what problem are they having?
- want to optimally process data and get as much as possible from it.
- want to use the optimal ML method tailored to their data
- Lack theoretical background
- data of different quality - how to get data quality to processing level
- how will the tutorial help them?
- provide a framework which can be applied to analyze their data in the future
- being able to indepenedently explore other ML methods of relevance
- get the information where to find information to learn about specific ML method
- quality control of data for ML (study design?)
#### Profile #3
PF, VD, CM, MZ
- who are they?
- _older_ students and _young_ researchers who are not affraid to try a plethora of new tools and approaches (NOT PIs / exclude learners with very poor knowledge of stats, or established PIs who might not have a lot to gain)
- biol. or biomed. background (wet-lab); knows how to generate the high-quality data AND questions that could to be answered using this data
- group that didn't have _enough_ background in stat. -- _open minded_, not _polluted_ with pre-assumptions; aware of the concepts listed in the tables above
- interested in starting to use Machine Learning on top of classical biostats
- big data _generation_
- don't have other _easily-accessible_ intra-institutional help to _handle_ their datasets
- keep-up with the current buzz-words
- basic knowledge of programming concepts in at least one language (e.g. R, Python, Perl)
- what problem are they having?
- publish or perish :grin:
- need clarification on terminology (what is stats? what is ML? Deep Learning?! AI; text mining & data mining and how to implement it)
- work _alone_, they don't know where to begin
- know how to apply some methods but don't always know which is best suited based on a problem
- how will the tutorial help them?
- they will be able to handle their data (at least to a some degree)
- more confidence in their data and research output
- they will know when to apply which method and **WHY**
- more independence in _handling_ additional on-line materials later on
- they will be critical reviewers and help to de-clogg journals from bad science
- propper analyses lead to good practice documentation (**FAIR**)
<span style="color:green">
buzz-words,
unstructured data,
data quality,
data analytics,
data transformation,
data harmonization,
application integration
</span>
#### Profile #4
(TL,VD,WD,SB,VS)
- who are they?
* study level : phd student | postDoc/young researchers | PIs
* background : life sciences | others
* programming fluency : copy-paster | function writer | full on dev
* stat fluency : beginner | good frequentist | statistician
- what problem are they having?
* needs to know how to use the library for ML.
* wants to a get a grasp on what it is and how it can help them.
* wants to get a deeper understanding of the techniques / evaluation of techniques
* wants to understand their data
*
- how will the tutorial help them?
* know what to do and what NOT to do with their data
* know when to call in some help
* Improve pipelines for data analysis
* To make beautiful visualization
* Understand why apply a specific methode versus another.
## Common Profile
- who are they?
- Early life science researchers (older students and young researchers -> NOT established PIs or younger students) m
- Basic knowledge of data analysis (prog knowledge useful, not necessary). Know how to produce data (e.g. big data generator), doesn't know how to analyze.
- programming fluency: copy-paster / adapt recipes from literature (not function writer, full on dev)
- stat fluency: beginner / knows what p-value is (not good frequentist, not statisticians)
- No knowledge of ML
- no institutional support for ML / data analysis
- what problem are they having?
- don't know how ML can be tuned (better insights on how ML tuning works) - different parameters -> different results
- how to do efficient preprocessing (create train/test)
- **NOT** Data wrangling (denoise, missing values)
- select the appropriate method for the data
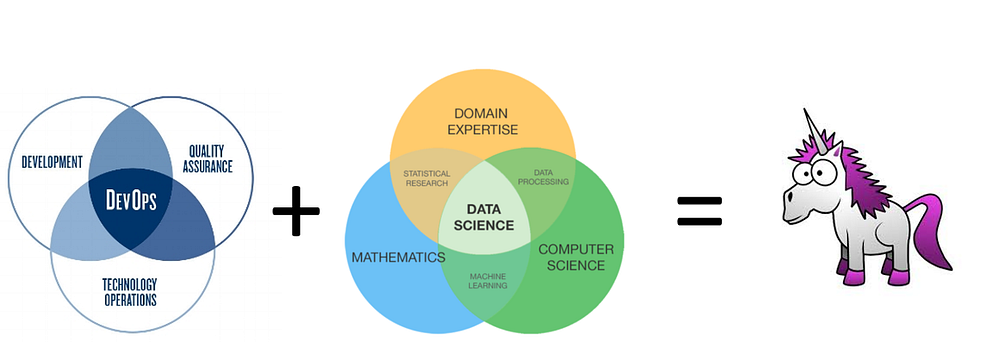
- what is statistics, what is ML, where is the overlap
- work alone, don't know where to begin
- how will the tutorial help them?
- Basic understanding of ML pipelines and steps (both in theory and in practice)
- being able to independently explore other ML methods
- know where to look for more information, how to ask for help
- when to apply each method and *why*
- what to do and what *not* to do
- Know the measures for ML model evaluation
- Feature engineering, visualization (raw data / models)
- More confidence in their data (understand their data) and research output
### Learning Outcomes
#### Prerequisites
Before taking this tutorial learners should have basic knowledge of the following concepts:
- Researchers with basic statistical and programming knowledge
- Have used "recipes" for stats analysis in published papers
- have attended an undergraduate course
- know how to run a script (in R/Python)
- know how to load data (in R/Python)
- know how to clean data wrangling (denoise, missing values)
- know how to use "recipes" (in R/Python)
- awareness about data dredging: data fishing, data snooping, data butchery, and p-hacking
- are aware of these issues - not a clear understanding
- no prior knowledge / experience in ML
#### Goals
After following one of these tutorials, learners will be able to:
_By the end of the [lesson|section], learners will be able to..._
also list how this outcome could be assessed (e.g. "how comfortable would you be in doing x" -> quantitative list)
### Group #1
- Outcome #1
- Learn the machine learning pipeline.
- Categorize the ML techniques and models.
- Knowing the criteria for selecting the best ML model based on our data analysis.
- What is the hyperparameter optimization? and learn hyperparameter optimization to tune the parameter.
- Get familiar with measuring and evaluating criteria.
- Know the avaiable visualization techniques to interpret the results
- Data Imputation, Data Normalisation and Data Restructuring
- Algorithmic and Hardware Limitations
-
### Group #2
- Outcome #1
- locate appropriate ML method A (taught in the course) for the research question
- Outcome #2
- understand assumptions pertaining to the associated model of method A, its applicability to data
- Outcome #3
- apply method A to own data (having access to relevant code snippets/function/library)
- Outcome #4
- locate alternative methods B, not taught in the course (using resources shared in course), appropriate for research questions and data
### Group #3
CM, PF, MZ, VD
- Outcomes (not yet sorted):
- Mention the components of machine learning (data, features and models)
- Explain the difference between supervised and unsupervised methods
- Explain the difference between classification and regression, clustering and dim. reduction, continuous and discreete space
- execute the appropriate software packages/libraries to apply a given method to data; and examine how to combine them to get the most out of the analysis
- evaluate models that have been developed (training, testing, validation/cross-validation)
- Argue what the role of stat is in AI/DL/ML
<!---
-->
### Group #4
(VD,WD,SB,VS)
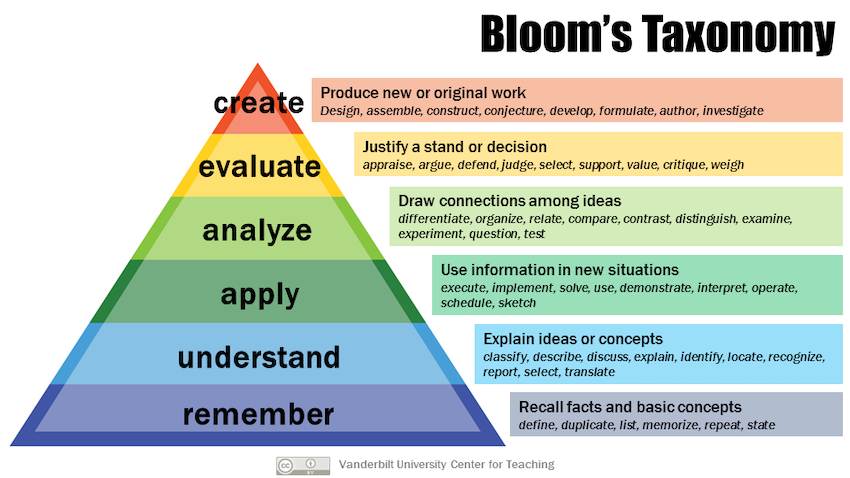
- Outcome #1
- create
- evaluate : appraise the quality of your model, choose optimal features using feature selection
- analyze : relate/associate the ML model to the biological object.
- apply : perform the analysis on their data
- understand : select some techniques based on type of data, explain supervised vs. unsupervised, classification vs. regression, structured vs. unstructured data
- remember : list some ML techniques
(self-)evaluation :-1:
* ask them which technique to use in a particular data/objective configuration
* Given the results of some ML analysis (eg, a confusion matrix), what could you do to improve your model ?
### Common Learning Outcomes
1. Mention the components of machine learning (data, features and models)
2. Argue what the role of statistics is in AI/DL/ML
3. Explain the difference between supervised and unsupervised methods
- _Internal Note_: Mention also other types such as Reinforcement learning, Deep learning
4. Be able to state the different categories of ML techniques
- list some ML techniques: Linear Regression, Logistic Regression, K-Nearest Neighbors, Support Vector Machines, Naive Bayes, Decision Tree, Random Forest, K-means Clustering (including how to decide on the number of clusters)
5. Explain the difference between classification and regression
6. Explain the difference between clustering and dimensionality reduction
7. Explain the difference between continuous and discrete space
8. Explain the difference between linear and non-linear methods
9. Explain the difference between structured vs. unstructured data
10. Be able to explain the different steps in an ML pipeline
- _Internal Note_: Pre-processing / Feature Selection / Training /Testing / Evaluation / Validation
11. Be able to list the criteria for evaluating an ML model
- _Internal Note_: Referring to F-measure, accuracy, recall, specificity, sensitivity, silhouette, confusion matrix, etc
12. Be able to evaluate and compare ML models for a particular dataset; what could you do to improve your model ?
- _Internal Note_: Referring to training, testing, validation/cross-validation, dangers of overfitting/underfitting
13. Understand assumptions pertaining to the associated model of method A, its applicability to data
14. Be able to choose one or more appropriate ML methods (taught in the course) for the research question / dataset in question
15. For each appropriate ML method, being able to identify the optimal parameter set (hyperparameter optimization)
- _Internal Note_: Also define what is hyperpatameter optimization
16. Be able to choose optimal features using feature selection
17. Be able to define different methods for data preprocessing, and apply them to the given dataset.
- _Internal Note_: Data Imputation, Data Normalisation and Data Restructuring
18. Be able to visualize the results of an ML method, and provide an interpretation
19. Execute the appropriate software packages/libraries to apply a given method to data;
20. Examine how to combine the appropriate software packages/libraries to automate the analysis
21. Apply method A to own data (having access to relevant code snippets/function/library)
- _Internal Note_: Define method A/B in the final lesson
22. Be able to locate alternative methods B, not taught in the course (using resources shared in course), appropriate for research questions and data
Happy: :+1::+1::+1::+1::+1::+1: :+1: +1: +1
Not happy:
If not happy, what is missing / could be improved
-
### Concept Maps
https://carpentries.github.io/instructor-training/05-memory/index.html
Work here
https://docs.google.com/presentation/d/1mMj6KtEHk56soVgSqf-Qa0UmyJUMIuWEZrz-r-fAt30/edit#slide=id.g9e3c699220_0_0
## Key concepts
### Group #1
### Group #2
LO #14 and/or #12 and/or #22 (concepts are the first level items)
- Assumptions of
- method A
- method B
- ...
- do they fit data structure?
- LO #13 is a prerequisite for this
- Outcome of methods
- does it fit research question
- data structure
- sample size
- classes
- research question
- clustering
- classification
- prediction
- feature analysis
### Group #3
(VD, PF, MZ)
- (1) DATA, Features, Models, Prediction (one on each box)
- (2) AI, ML, DL, Statistics
- (3, 4, 5, 6, 8) Supervised, UnSupervised (one on each boxe) -> creating a tree : Classification and regression (link to Supervised): Clustering and Dimension reduction (link to unsupervised). Link linear
- (7, 9) input data: structured, unstructured, continous, discrete
- (10, 12) Pre-processing, Feature Selection, Training, Testing, Evaluation, validation, cross-validation (Perhaps link with models and prediction from concept map 1)
- (11, 12) concepts from <https://en.wikipedia.org/wiki/Confusion_matrix>; overfitting/underfitting
### Group #4
(VD, WD, SB, AK)
- (5) classification
- (5) regression
- (3) supervised learning
- (3) unsupervised learning
- (6) clustering
- EDA (could be a subgraph in itself)
- (6) dimensionality reduction (could be a subgraph in itself)
- Visualization
- (12,16) model evaluation (could be a subgraph in itself)
-
- Fitting (could be a subgraph in itself)
### Other questions
When would be the Day #2 of the hackaton be
02-06/11 +1:+1 +1(Mon,Fri) +1 (Mon, Thu, Fri) +1(Thu-Fri) +1 :+1:(Mon,Tue,Thu):+1 (Thu-Fri)
09-13/11 +1 +1(Mon) +1 (not Tue) :-1: :+1:(Mon,Tue,Thu)
16-20/11 +1(Mon,Fri) +1 (Mon, Wed, Fri)
23-27/11 +1 +1(Mon,Fri):+1:(Tue,Thu) +1 (not Tue)
December, week 1 :+1: +1(Mon,Fri) +1 (Mon, Fri):+1:(Mon,Tue,Thu)
### organizing the learning objectives
## Next steps
Write at least one exercise for each learning objective (each bullet point).
<span style="color:green">**Proposal**</span> include <https://github.com/sumbose/iRF>
Writing the exercises will not be easy, but makes writing the tutorial and is required.
It would be good to revisit the concept maps once some/most of the exercises have been written. Concept maps can also be used as an assesment tool by presenting an incomplete map and asking the learner to fill in the blanks; then to analyze and difference in the mental model between the instructor and the learners.
## How to contribute exercises?
Preview: each set of learning objectives will be moved to their own pseudo-lesson markdown file, then the exercises can be created/edited there
the Carpentries Curriculum Development Handbook has a section on Designing Challenges, but it seems data analysis centric: https://carpentries.github.io/curriculum-development/designing-challenges.html#designing-challenges-1
Toby recommends http://teachtogether.tech/#s:exercises )
Toby: Check out http://teachtogether.tech/#s:exercises & http://teachtogether.tech/#s:models (and any other chapters that look interesting like http://teachtogether.tech/#s:process) and the cognitive load & mental models part of the Carpentries Curriculm Development Handbook
 Sign in with Wallet
Connect another wallet
Sign in with Wallet
Connect another wallet