HW5 Report
===
###### tags: `Parallel Programming 2020`
# 先備知識
要比較差異,首先我們必須要知道 GPU 與 CPU 是如何交換與傳輸資料的
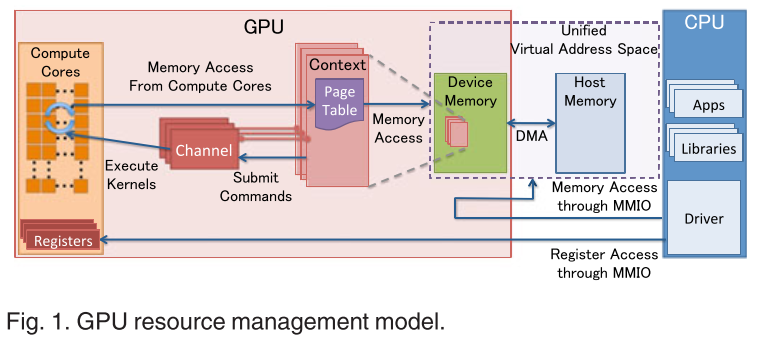
GPU 存取記憶體的方式是透過 DMA (Direct Memory Access) 來完成的。所有對記憶體進行讀取或是寫入等動作都要使用 DMA,所以理想狀況只要把資料從 Host memory 搬到 device memory 或者是反方向就完成 operation 了。
然而在我們的作業系統中,為了解決 memory fragmentation 的問題,引入了 page 的概念,其核心概念就是把一塊連續的 logical memory 映射到可能為不連續的 physical memory 片段,或甚至是磁碟 (swap) ,讓每個 process 都以為它真正擁有一塊連續的記憶體
因此 GPU 即使是使用 DMA 存取記憶體,但是也只限於記憶體的物理位址,所以如果 process malloc 了一塊 memory ,也只能代表是 process 的 logical memory,所以 GPU 無法馬上存取這塊記憶體的資料。
於是這時候 GPU 如果要使用這塊記憶體的話,它必須先找出這塊記憶體的資料,然後把它放到真正的物理記憶體裡面,叫做 pinned memory or page-locked memory,表示這塊記憶體會保證留在物理記憶體裡面,然後在把裡面的資料搬到 GPU 的 device memory 裡面
# Q1
根據作業 Spec,Method 1 必須使用 `malloc()` 來分配 host memory , Method 2 使用`cudaHostMalloc()`來分配 host memory
而其中 `malloc()` 所分配的記憶體是 non-pinned memory (pageable memory) ,要使用的時候 GPU 會悄悄地分配一塊 pinned memory 然後把 `malloc()` 所分配的記憶體內容丟進去再進行後續的操做
而 `cudaHostMalloc()
` 所分配的記憶體是 pinned memory ,如果 GPU 要使用的時候可以直接用 DMA 來存取

除此之外,在作業 Spec 的 Method 2 也規定我們使用 `cudaMallocPitch()` 這個 function 來分配 GPU 的 device memory
根據 [CUDA 的官方文件](https://docs.nvidia.com/cuda/cuda-c-programmingguide/index.html#device-memory-accesses)
> Any address of a variable residing in global memory or returned by one of the memory allocation routines from the driver or runtime API is always aligned to at least **256** bytes.
所以從 256 的倍數的地址開始存取 device memory 是最有效率的,所以用 `cudaMallocPitch()`,讓每行多分配一些空間,使接下來的每行都是從 256 的倍數的地址開始,以達到較高的存取速度。
而 method 2 與 method 3 相比是 method 3 等於是讓一個 thread 多做一些事情,相較於 method2 利用到的 threads 數量比較少,平行化程度也會比較低
所以我的初步猜測是: method2 最快, method3 次之,method1 最慢
# Q2
這裡的數字都是跟 reference 比的倍率,然後取 20 次前五高的
## 1000 iterations
### View 1
| | 1st | 2nd | 3rd | 4th | 5th | avg |
|:-------:| ---- | ---- | ---- | ---- |:----:|:----:|
| method1 | 1.31 | 1.16 | 1.13 | 1.11 | 1.11 | 1.16 |
| method2 | 1.14 | 1.14 | 1.12 | 1.11 | 1.09 | 1.12 |
| method3 | 1.11 | 1.11 | 0.87 | 0.86 | 0.86 | 0.96 |
### View 2
| | 1st | 2nd | 3rd | 4th | 5th | avg |
|:-------:| ---- | ---- | ---- | ---- |:----:|:----:|
| method1 | 1.20 | 1.14 | 1.09 | 1.09 | 1.07 | 1.11 |
| method2 | 1.09 | 1.08 | 1.07 | 1.02 | 0.96 | 1.04 |
| method3 | 1.12 | 0.99 | 0.86 | 0.84 | 0.83 | 0.93 |
## 10000 iterations
### View1
| | 1st | 2nd | 3rd | 4th | 5th | avg |
|:-------:|:----:|:----:|:----:| ---- |:----:|:----:|
| method1 | 1.24 | 1.19 | 1.12 | 1.12 | 1.12 | 1.16 |
| method2 | 1.11 | 1.09 | 1.09 | 1.08 | 0.94 | 1.06 |
| method3 | 1.10 | 0.85 | 0.85 | 0.85 | 0.85 | 0.90 |
### View2
| | 1st | 2nd | 3rd | 4th | 5th | avg |
|:-------:| ---- | ---- | ---- | ---- | ---- |:----:|
| method1 | 1.12 | 1.11 | 1.11 | 1.10 | 1.09 | 1.10 |
| method2 | 1.11 | 1.04 | 1.04 | 0.99 | 0.83 | 1.00 |
| method3 | 1.12 | 0.94 | 0.85 | 0.84 | 0.83 | 0.91 |
## 100000 iterations
### View1
| | 1st | 2nd | 3rd | 4th | 5th | avg |
|:-------:| ---- | ---- | ---- | ---- | ---- |:----:|
| method1 | 1.15 | 1.14 | 1.11 | 1.11 | 1.10 | 1.12 |
| method2 | 1.33 | 1.07 | 1.05 | 0.97 | 0.88 | 1.06 |
| method3 | 1.05 | 0.91 | 0.87 | 0.86 | 0.86 | 0.91 |
### View2
| | 1st | 2nd | 3rd | 4th | 5th | avg |
|:-------:| ---- | ---- | ---- | ---- | ---- |:----:|
| method1 | 1.11 | 1.10 | 1.10 | 1.09 | 1.09 | 1.10 |
| method2 | 1.11 | 1.08 | 1.07 | 0.92 | 0.91 | 1.01 |
| method3 | 1.10 | 1.00 | 0.85 | 0.84 | 0.83 | 0.92 |
## Graphs
### View1
固定為 view1 ,針對不同 iterations 對結果製圖

### View2
固定為 view2 ,針對不同 iterations 對結果製圖

### 1000 Iterations
固定為 1000 個 iterations ,針對不同 view 對結果製圖

### 10000 Iterations
固定為 10000 個 iterations ,針對不同 view 對結果製圖

### 10000 Iterations
固定為 100000 個 iterations ,針對不同 view 對結果製圖

# Q3
### 發現 1
首先觀察固定 view 的圖表,method1 都是最快的,跟一開始想的不一樣
為了探討這個問題,我把原本測試程式的 refthread 和 serial 部份程式碼移除,並利用 `nvprof` 來對程式進行效能分析
#### method1 at 1000 iterations for view1
```
GPU activities: 70.65% 39.252ms 10 3.9252ms 3.9188ms 3.9345ms mandelKernel(float, float, float, float, float, float, int, int, int, int*)
Time(%) Time Calls Avg Min Max Name
70.89% 126.43ms 10 12.643ms 111.24us 125.26ms cudaMalloc
17.69% 31.548ms 10 3.1548ms 3.1519ms 3.1596ms cudaDeviceSynchronize
10.72% 19.124ms 10 1.9124ms 1.4954ms 3.3728ms cudaMemcpy
```
#### method2 at 1000 iterations for view1
```
GPU activities: 86.46% 39.396ms 10 3.9396ms 3.9351ms 3.9486ms mandelKernel(float, float, float, float, float, float, int, int, int, int*, unsigned long)
Time(%) Time Calls Avg Min Max Name
79.28% 155.21ms 10 15.521ms 1.5450ms 140.87ms cudaHostAlloc
16.24% 31.796ms 10 3.1796ms 3.1753ms 3.1853ms cudaDeviceSynchronize
3.16% 6.1774ms 10 617.74us 603.13us 633.04us cudaMemcpy2D
0.54% 1.0499ms 10 104.99us 96.960us 122.71us cudaMallocPitch
```
#### method3 at 1000 iterations for view1
```
GPU activities: 87.99% 44.639ms 10 4.4639ms 4.3961ms 4.5064ms mandelKernel(float, float, float, float, float, float, int, int, int, int*, unsigned long)
77.41% 185.98ms 10 18.598ms 1.5023ms 172.24ms cudaHostAlloc
18.59% 44.663ms 10 4.4663ms 4.3975ms 4.5088ms cudaDeviceSynchronize
```
跑完 `nvprof` 我發現在 method2 的 `cudaHostAlloc` 速度是比 `cudaMalloc` 慢了不少,但是 `cudaMemcpy` 跟 method1 比起來沒有差很多,換句話說 `cudaHostAlloc` 換來的資料複製速度反而被 `cudaHostAlloc` 帶來的 overhead 給蓋過了
而再來看 method2 與 method3 的效能差別,可以看到在 `mandelmethod()` 這個 method function method3 比 method2 花的時間還要多。我的理解是因為 method3 等於自己手動幫不同 thread 分配工作,而 method2 等於是 GPU 幫你分配工作,所以 method2 的速度會比 method3 來的快
### 發現 2
觀察固定 iterations 次數的圖表,我發現 method1 和 method2 的 view1 都比 view2 還快
但是 method3 的 view2 卻比 view1 還快,我猜測這可能是 thread 分配到的工作的問題
在 view1 中,是一個很對稱的圖形,而 method1 與 method2 都是一個 thread 處理 1 個 pixel ,但是在 GTX 1060 中沒有那麼多個 concurrent threads (最多同時只有 10 * 2048 個, total SMs * max threads per sm) ,所以 GPU 手動會做 scheduling ,而加上我的 method1 與 method2 的實做方式, blockIdx, threadIdx 都會從 0 開始計數 ,所以自然會從左上角開始計算
我們可以假想如果 blockIdx 掃到所有分配 blocks 總數的一半的時候,某些 threads 可能已經算好了,但是某些 threads 可能在算中間白色的部份還沒算好,這時好的 threads 就會接手去算下面白色的部份,等到剛剛算白色的 threads 算好的時候,他們就只能算暗色的部份,這樣互補剛好大家都同樣時間完成計算圖片。

那在 view2 中,因為這個是一個很不平均也不對稱的圖形,所以最後面可能每個 threads 算完的時間都不一樣,因此就會拖慢速度(需要同步)

那為什麼 method3 不會像 method1, method2 那樣 view1 的速度大於 view2 呢?
我認為是我實做的方法不同,導致處理 pixel 的順序是很不固定的
```
int base = blockIdx.x * blockDim.x + threadIdx.x;
int off = resX / GROUP_SIZE;
int j = blockIdx.y * blockDim.y + threadIdx.y;
for (int c = 0; c < GROUP_SIZE; c++) {
int i = c * off + base;
....
}
```
可以看到我讓每個 thread 一次處理 25 個 pixels,可以看到我是對 `i` 進行切割,所以每個 thread 是處理某個 row 的固定間距的 25 個 pixels ,所以沒有規律可言,所以就沒有 method1 與 method2 發生的現象出現
# Q4
一開始我是透過 `stream + cudaMemcpyAsync()` 來實做,我把要所有算的像素切成若干等分,這樣每等分算完之後可以 asynchrounus 的複製資料,不必等到所有的 pixels 都算完然後再複製,概念像是這張圖的下半部份:

一開始寫的程式碼:
```
cudaStream_t stream[NUM_STREAM];
for (int i = 0; i < NUM_STREAM; i++) {
cudaStreamCreate(&stream[i]);
}
dim3 blockSize(BLOCK_SIZE, BLOCK_SIZE);
dim3 numBlock(resX / BLOCK_SIZE, streamSize / BLOCK_SIZE);
for (int i = NUM_STREAM - 1; i >= 0; i--) {
int off = streamSize * i;
mandelmethod<<<numBlock, blockSize, 0, stream[i]>>>(stepX, stepY, upperX, upperY, lowerX, lowerY, resX, resY, maxIterations, output_d, pitch, off);
int offset = pixels / NUM_STREAM * i;
int poffset = pitch * streamSize * i;
int *arr = (int *)((char *)output_d + poffset);
cudaMemcpy2DAsync(&output_h[offset], resX * sizeof(int), arr, pitch, resX * sizeof(int), streamSize, cudaMemcpyDeviceToHost, stream[i]);
}
cudaDeviceSynchronize();
memcpy(img, output_h, bytes);
for (int i = 0; i < NUM_STREAM; i++) {
cudaStreamDestroy(stream[i]);
}
```
然而實做後發現 performance 不是很理想
於是我只好沿用 method1 的作法,因為它是 3 個 kernel functions 中最快的
 Sign in with Wallet
Connect another wallet
Sign in with Wallet
Connect another wallet